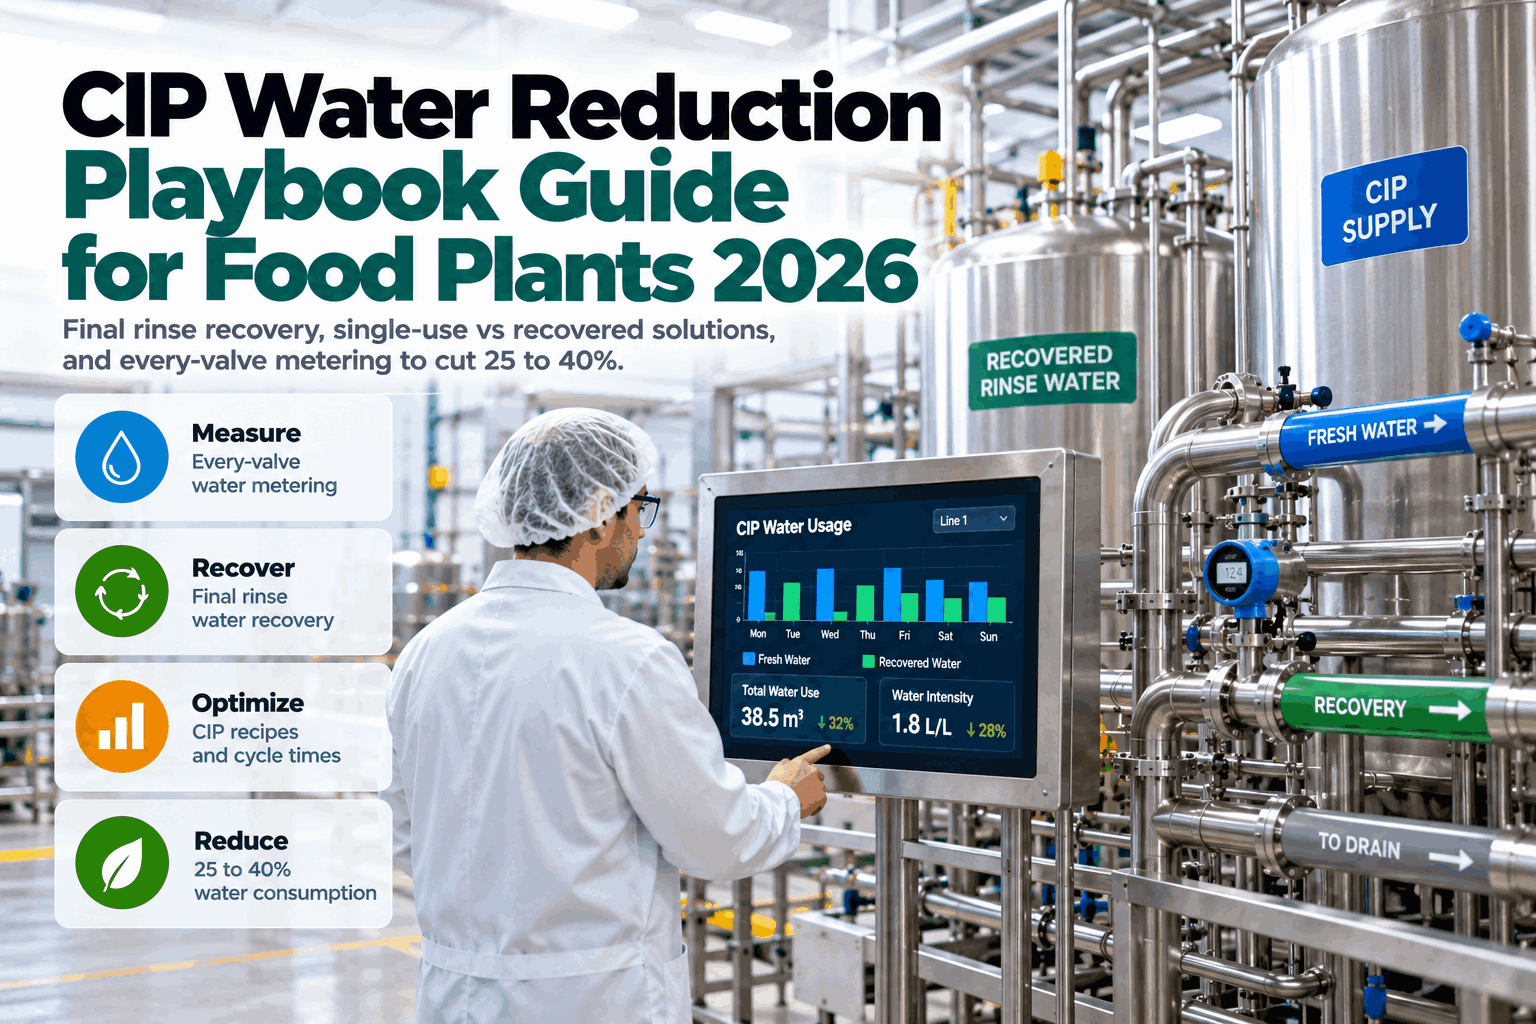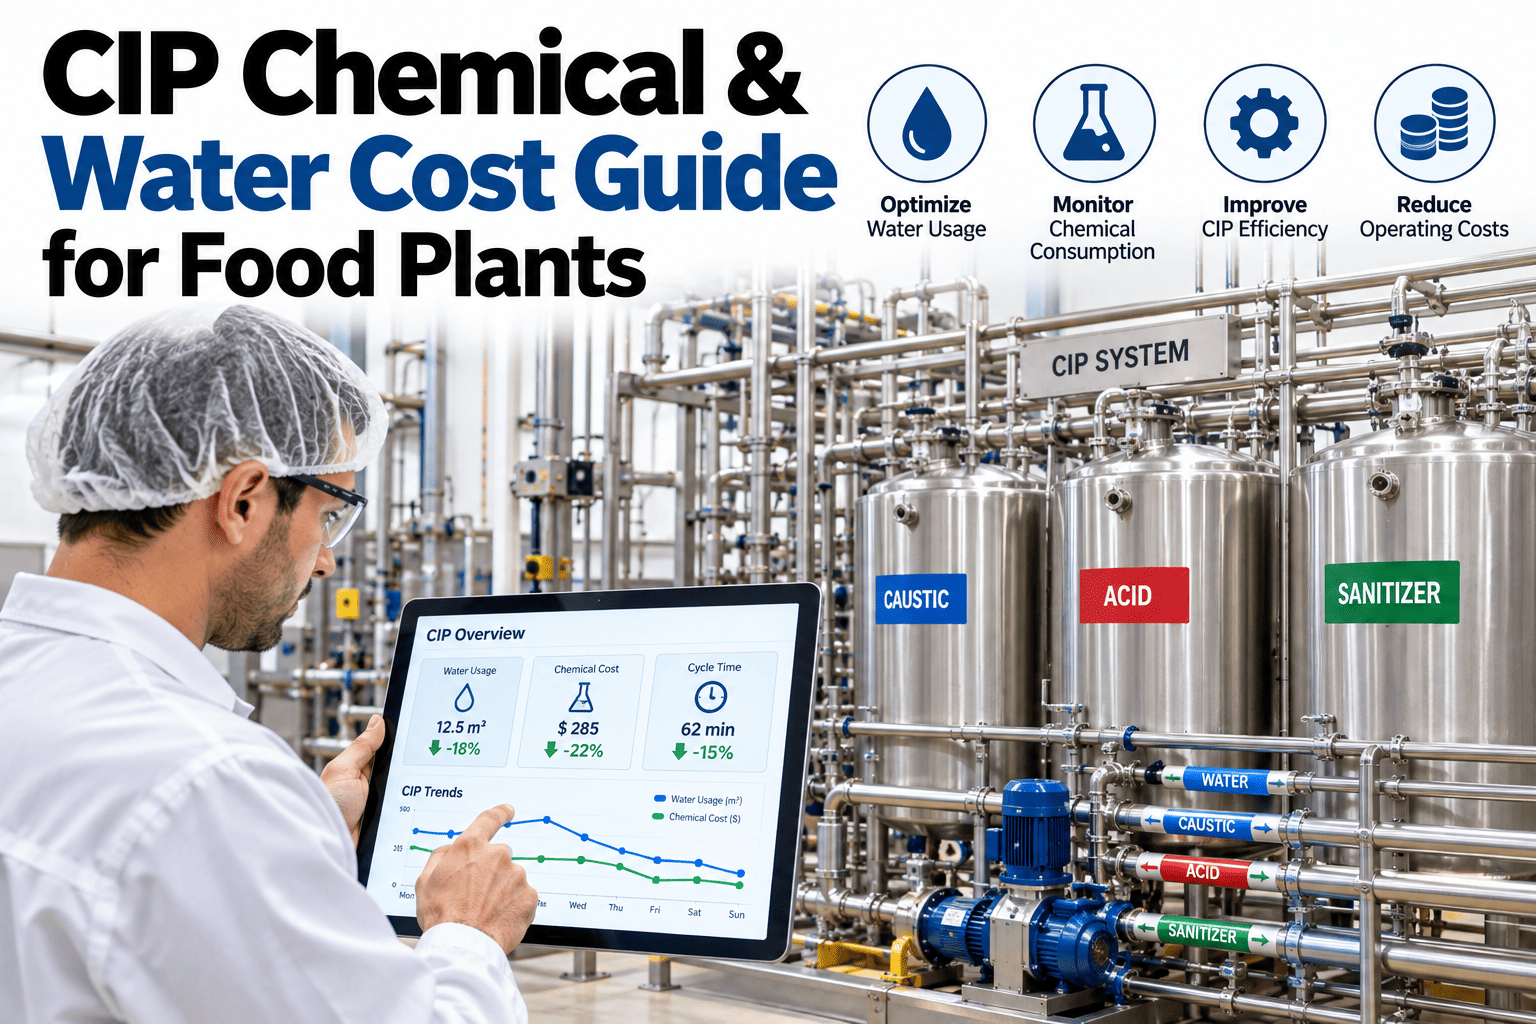
A food plant running two filling lines through fourteen CIP cycles a week can burn through 42,000 litres of water and thousands of dollars in chemicals without a single person on staff being able to say, with confidence, which specific line, shift, or SKU change-over is driving that spend. CIP is treated as background utility cost — invisible until the water bill lands — even though it can account for a meaningful share of daily production time and a significant slice of total plant energy use in categories like dairy processing. The plants that find real, safe savings are not the ones that clean less; they are the ones that finally get per-cycle, per-line, and per-SKU visibility into where the water, chemicals, and time are actually going. If your CIP spend still shows up as one undifferentiated utility line item, book a demo to see cycle-level cost breakdowns on your own lines.
Your CIP Bill Is One Number. It Should Be Fifty.
iFactory breaks CIP chemical, water, and time spend down by cycle, by line, and by SKU change-over, turning an invisible utility cost into a dataset you can actually act on — without changing a single validated sanitation parameter.
Why CIP Spend Stays Invisible Even in Well-Run Plants
Most plants can tell you their total water bill and their total chemical spend for the month. Very few can tell you how much of that spend belongs to Line 3's evening cycle versus Line 1's changeover between two different allergen profiles. CIP costs hide inside utility totals for a specific structural reason: the systems that run CIP — the skid controller, the water meter, the chemical dosing pump — were never built to report cost, only to execute a validated cycle.
Cycles set to worst-case soil conditions keep running long after the line is actually clean, and every extra minute compounds water, chemical, energy, and downtime cost across every cycle, every line, every shift.
A skid controller logs that a cycle ran and passed — it does not attribute the litres of water or grams of chemical consumed back to a specific line, product, or shift for cost analysis.
Water and chemical invoices arrive as monthly totals across the entire site, making it nearly impossible to isolate which specific line or SKU changeover is disproportionately expensive to clean.
Plants uncertain of their actual CIP performance often add safety margin on top of safety margin, consuming more resources than validated cleaning actually requires out of an abundance of caution.
Where CIP Spend Actually Goes, Cycle by Cycle
A single CIP cycle is rarely one step — it typically includes an initial rinse, an alkaline wash, an intermediate rinse, an acid wash, a final rinse, and sometimes a sterilization step. Each stage draws water, chemical, and energy at different rates, and knowing the split matters because the highest-cost stage is not always the one operators assume.
| CIP Stage | Typical Water Share | Typical Chemical Share | Typical Energy Share |
|---|---|---|---|
| Initial rinse | 25% to 30% | Minimal | Low |
| Alkaline wash | 15% to 20% | 40% to 50% | High — heated circulation |
| Intermediate rinse | 15% to 20% | Minimal | Low |
| Acid wash | 10% to 15% | 30% to 40% | Moderate |
| Final rinse and sanitize | 15% to 20% | 5% to 10% | Moderate to high |
The alkaline wash stage is disproportionately expensive on both chemical and energy dimensions in most dairy and beverage applications, which is exactly why cycle-level visibility matters more than a single blended cost-per-cycle number — two lines with identical total cycle costs can have very different optimization opportunities hiding inside that total.
See Your Own CIP Spend Broken Down by Line and SKU
Bring your current utility bills and cycle logs — we'll show you what cycle-level, line-level, and SKU-level attribution actually reveals about where your savings are hiding.
Three Levels of Visibility Most Plants Are Missing
Cost visibility is not a single dashboard — it is three connected layers, each answering a different operational question, and most plants have built none of them.
Per-Cycle Visibility
Water volume, chemical dose, energy draw, and elapsed time for every single CIP cycle, timestamped and tied to the actual sensor data from that run rather than the programmed setpoint.
Per-Line Visibility
Aggregated cost trends across every cycle on a specific line over time, surfacing whether a particular line is chronically running longer or hotter than its peers for the same soil type.
Per-SKU Visibility
Cost attribution tied to the specific product changeover driving the cycle, revealing which SKU transitions — often allergen or protein-to-dairy switches — are the most expensive to clean between.
Where Safe, Validated Savings Actually Come From
None of the opportunities below require weakening a validated sanitation standard. They require knowing, with data, where a cycle is running longer or hotter than the microbial kill requirement actually demands.
Ending a rinse or wash stage based on real-time conductivity or turbidity sensor confirmation of clean, rather than a fixed worst-case timer, recovers minutes on every cycle that is already clean sooner than the timer assumes.
A partially blocked spray ball delivering 60% coverage forces longer cycles or higher chemical concentration to compensate — fixing the blockage restores efficiency without changing the cycle recipe at all.
A leaking divert valve allowing wash solution to bypass the circuit reduces flow velocity below the turbulent threshold needed for effective cleaning, quietly forcing longer cycles to compensate for lost effectiveness.
A sensor reading even a few degrees off validated setpoint either wastes energy overheating or silently runs a non-compliant cycle — catching this through data review protects both cost and compliance.
Recovering and reusing final rinse water as the next cycle's initial rinse, where product and hygiene requirements allow it, reduces fresh water draw without touching the core cleaning chemistry.
What Cycle-Level Visibility Found on One Dairy Line
A dairy processor running two filling lines through fourteen CIP cycles weekly was consuming 42,000 litres of water and roughly $2,800 in chemical cost every week, with 38 hours of production time tied up in cleaning. None of the individual numbers looked obviously wrong in isolation — the plant had always run this way, and every cycle passed its validation checks.
Once cycle-level data was captured and compared across both lines, a clear pattern emerged: Line 2 was consistently running 22% longer wash stages than Line 1 for the identical soil type and product changeover, despite both lines using the same validated recipe. The root cause traced to a partially blocked spray ball on Line 2 that had gone unnoticed because the cycle still passed its microbial kill validation — it simply took longer and used more chemical to get there. After the fix, the plant recovered 14 hours of production time weekly, cut water consumption by 35%, and reduced chemical cost by 28%, all while achieving identical microbial kill results. The chemicals never changed. The recipe never changed. Only the visibility did.
Building the Business Case Finance Will Actually Approve
CIP cost visibility projects often stall not because the savings aren't real, but because they're presented as a sanitation initiative rather than a finance one. The framing that gets budget approved treats CIP the same way a plant would treat any other significant recurring operating cost — with a baseline, a target, and a payback calculation finance already knows how to evaluate.
Capture 60 to 90 days of current cycle-level water, chemical, and time data before proposing any changes, so the "before" picture is defensible and specific rather than an estimate.
Convert litres and chemical volume into actual dollar figures using current utility and chemical supplier pricing, broken out by line so the highest-opportunity lines are visible first.
Most cycle-level visibility and optimization projects pay back within one to two quarters purely on recovered production time and reduced utility spend, before counting compliance risk reduction.
A byproduct of better CIP visibility is a stronger, more defensible sanitation audit trail — a benefit finance may not weight heavily but auditors and customers absolutely do.
A Realistic Path From Zero Visibility to Optimized CIP
Plants that try to optimize every line at once before establishing reliable data tend to stall. A phased approach produces a defensible early win that justifies expanding to the rest of the site.
Connect existing flow meters, conductivity sensors, and temperature probes on one or two priority lines into a cost-attributed data model, without changing any cycle parameters yet.
Review cycle-level and line-level patterns against each other to identify outliers — chronically longer cycles, higher chemical draw, or unusual SKU changeover costs.
Investigate and correct the physical root causes behind flagged outliers — spray ball inspection, valve integrity checks, sensor calibration — then revalidate the affected cycles.
Expand the same visibility model plant-wide, using the first phase's documented savings to build the case for broader rollout and any condition-based cycle logic upgrades.
Frequently Asked Questions
Does improving CIP cost visibility require replacing our existing CIP skid or sensors?
Generally no — most cost visibility work starts with the sensor data your CIP skid is already generating, such as flow meters, conductivity sensors, and temperature probes, aggregating that existing data into cost-attributed reporting rather than requiring new hardware. In cases where a specific measurement point is missing, such as no flow meter on an individual line, a targeted sensor addition may be recommended, but this is the exception rather than the starting requirement. Most plants are surprised how much visibility is achievable just from data their systems are already capturing but never connecting to cost. For a review of what your current CIP instrumentation can already tell you, contact our support team.
Will reducing CIP cycle time compromise our sanitation validation or HACCP compliance?
Not when the reduction is based on real-time condition confirmation rather than an arbitrary shortening of a fixed timer. The savings opportunities that matter — condition-based cycle ending, spray ball repair, divert valve sealing, and sensor calibration — all restore or confirm cleaning effectiveness rather than reducing it, meaning the microbial kill outcome stays validated while the time and resource waste around achieving it is eliminated. Any cycle time change should still go through your normal validation and change control process, but the data typically shows the plant was cleaning well past the point of actual clean, not stopping short of it. To review how this fits your specific HACCP documentation requirements, book a demo with our team.
How is per-SKU CIP cost actually calculated when multiple products run through the same line?
Per-SKU attribution ties each CIP cycle to the specific product changeover that triggered it, using production schedule data to identify which SKU was running before the cycle and which SKU is starting after it. This reveals patterns such as allergen-to-non-allergen transitions or dairy-to-non-dairy changeovers requiring meaningfully longer or more chemical-intensive cycles than same-product transitions, giving production planners real cost data to consider when sequencing the daily schedule. Over time, this can inform smarter SKU sequencing that reduces the frequency of the most expensive changeover types. For a walkthrough of how this attribution model works with your specific product mix, reach out to support.
How quickly can a plant expect to see savings after implementing CIP cost visibility?
Most plants identify at least one clear, actionable finding — a blocked spray ball, a leaking valve, a chronically over-running line — within the first two to four weeks of cycle-level data collection, since these issues tend to show up clearly once cycles are compared against each other rather than reviewed individually. Full savings realization, including any physical repairs and revalidation, typically plays out over one to two production quarters. The dairy line example above recovered 14 hours of weekly production time and cut chemical cost by 28% within roughly two months of identifying the root cause. To scope a realistic timeline for your specific lines, schedule a session with our team.
Does CIP cost data integrate with our existing HACCP and sanitation compliance records?
Yes — cycle-level cost data and sanitation compliance validation are drawn from the same underlying sensor readings, so the same timestamped record that supports a HACCP or SQF audit trail also feeds the cost attribution model. This means quality and finance teams are working from one consistent dataset rather than reconciling separate systems, and a cycle flagged as a cost outlier can be cross-referenced directly against its compliance record to confirm it still passed validation. For details on how this integrates with your current compliance documentation platform, contact our support team.
Stop Guessing Where Your CIP Budget Goes
The savings in your CIP program are almost never in the chemistry — they're in the visibility. See what cycle-level, line-level, and SKU-level cost data reveals about your plant.