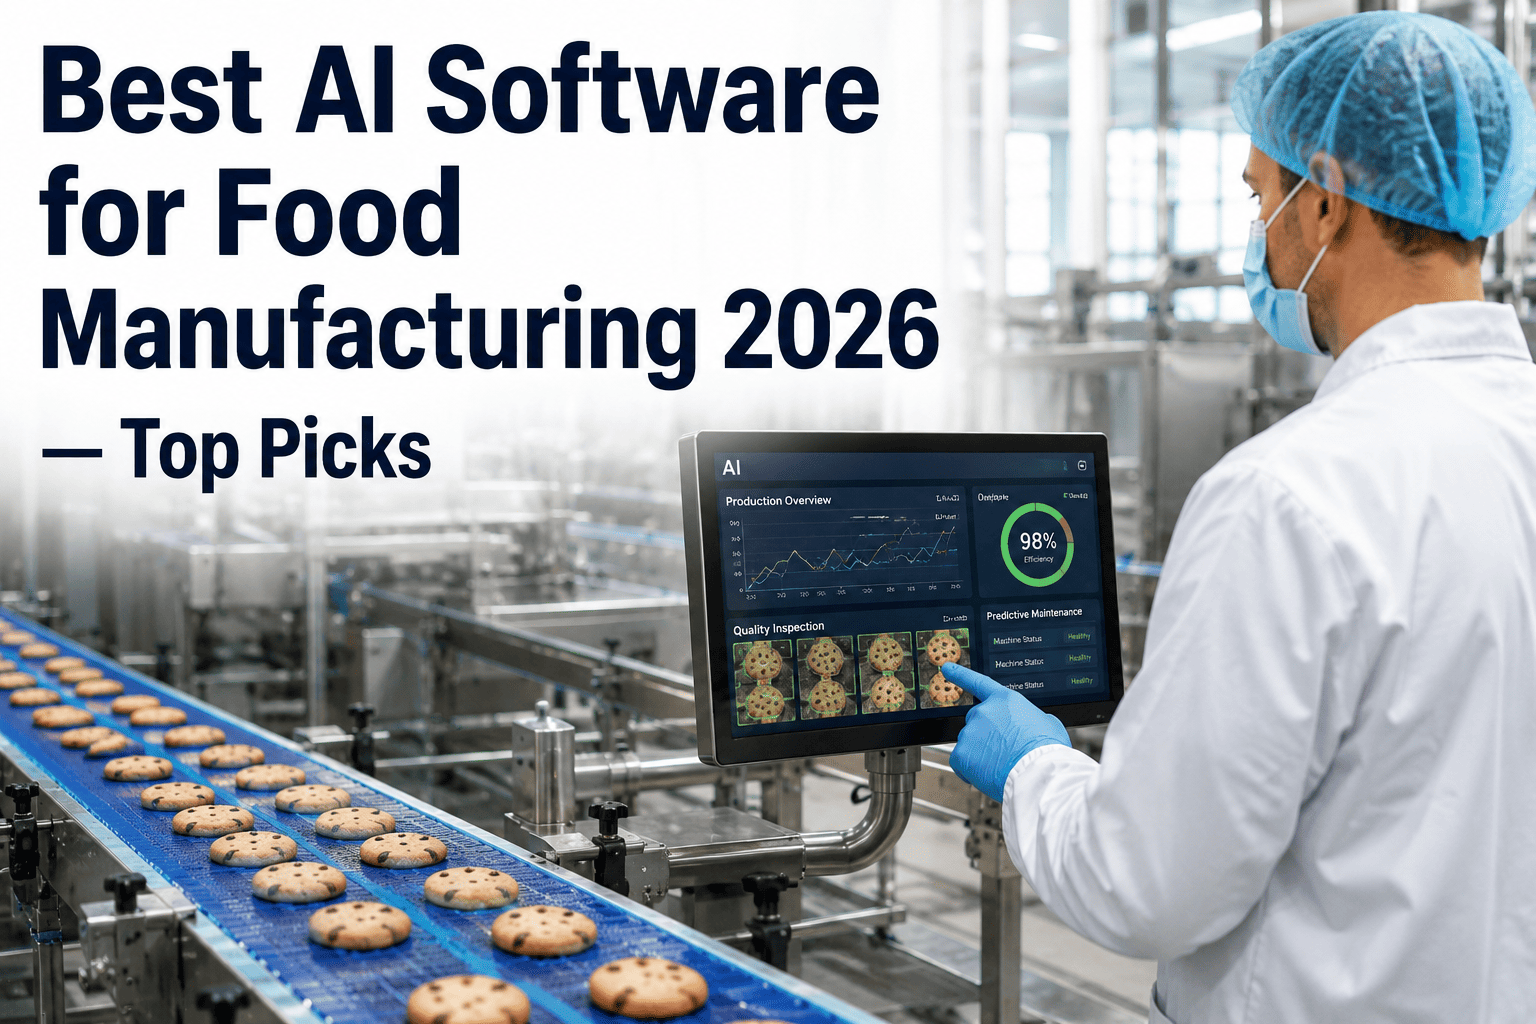
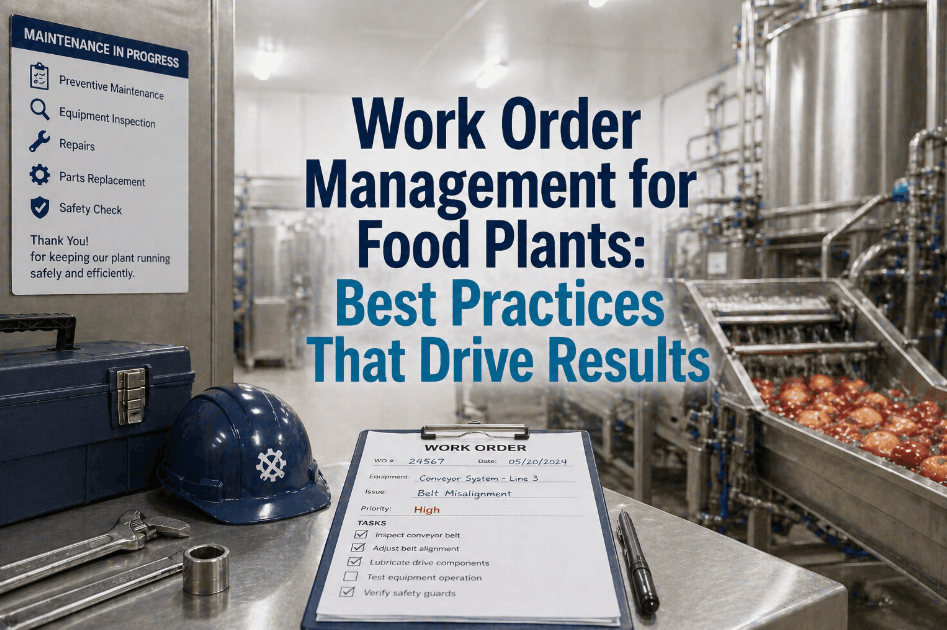
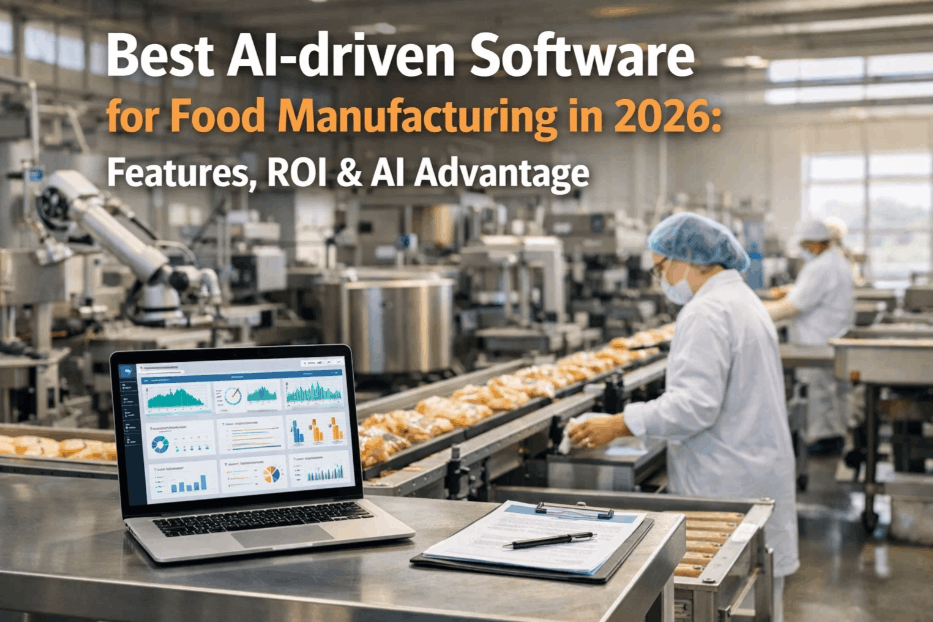
Food and beverage plant analytics has become the single most critical capability separating high-performing manufacturers from those losing ground to rising costs, regulatory pressure, and supply chain complexity in 2026. Whether you operate a dairy facility in Ontario, a beverage bottling plant in Bavaria, or a snack food factory in the UAE, the ability to convert raw production data into actionable intelligence determines your facility's throughput, compliance posture, and profitability. iFactory's cloud AI-driven platform delivers F&B plant analytics that turn every sensor reading, batch record, and quality log into decisions your operations team can act on — today. Book a demo to see what modern food manufacturing analytics looks like in practice.
Turn Your Plant Data Into a Competitive Advantage
iFactory's cloud AI-driven analytics platform unifies HACCP records, sanitation schedules, cold chain telemetry, OEE dashboards, and regulatory compliance into one intelligent system built for food and beverage manufacturing.
Why F&B Plant Analytics Is No Longer Optional
Food and beverage manufacturers face a convergence of pressures that manual reporting and disconnected spreadsheets simply cannot absorb. Understanding the forces driving analytics adoption is the first step to building a strategy that holds.
Regulatory Documentation Intensity
FSMA 204, EU Food Safety Regulation 178/2002, Canada's Safe Food for Canadians Act, and Germany's LFGB all require traceable, retrievable records that paper-based systems cannot reliably produce on demand. Non-compliance fines in the EU now exceed €10 million for systemic failures.
Rising Input Cost Volatility
Energy, packaging, and raw ingredient costs remain unpredictable across North American, European, and Middle Eastern supply chains. Without granular consumption analytics at the line and batch level, cost control is guesswork rather than engineered efficiency.
Retailer & Foodservice Demands
Major retailers in the UK, Germany, Canada, and UAE now require digital quality records, supplier traceability documentation, and sustainability reporting as standard supplier qualifications — not optional value-adds.
Labor and Skill Gaps
Experienced food plant operators are retiring faster than replacements are trained. Analytics platforms that encode institutional knowledge into monitoring systems, automated alerts, and guided workflows protect operational continuity during workforce transitions.
The 6 Pillars of F&B Plant Analytics Management
Comprehensive food and beverage plant analytics spans six interconnected domains. High-performing facilities build capability across all six rather than optimizing one at the expense of others.
OEE measurement at the line and machine level — tracking availability, performance rate, and quality yield simultaneously. Real-time micro-stop detection and shift-by-shift throughput comparison close the gap between theoretical and actual capacity.
iFactory: Live OEE dashboards with shift benchmarkingDigital CCP monitoring logs, automated limit-breach escalations, and real-time corrective action workflows that eliminate retroactive entries and satisfy FDA, CFIA, and EU competent authority inspection requirements without paper.
iFactory: HACCP records with 24-hour FDA retrievalMaster sanitation schedules digitized with photo-verified completion, environmental monitoring result integration, and allergen changeover validation workflows — replacing paper-based hygiene records that create audit vulnerability.
iFactory: Digital sanitation logs with photo verificationContinuous temperature and humidity monitoring across storage, processing, and distribution with deviation alerts, excursion reports, and automated hold workflows — critical for dairy, seafood, meat, and fresh produce operations in any climate.
iFactory: Cold chain excursion detection and CAPAEnd-to-end lot genealogy linking raw material COAs, in-process quality checks, finished goods release records, and customer delivery confirmation — enabling precision recalls limited to affected batches rather than full product lines.
iFactory: Full lot genealogy with FSMA 204 traceabilityGranular energy consumption tracking by line, shift, and product SKU — supporting carbon footprint reporting, Scope 1 and 2 emissions disclosure, and cost-per-unit benchmarking that satisfies EU Taxonomy and UK SECR reporting requirements.
iFactory: Energy analytics with ESG reporting exportsHow to Build a Food Plant Analytics Strategy That Scales
A analytics strategy that delivers measurable ROI within the first 90 days requires sequenced implementation — starting with high-impact, high-visibility capabilities before expanding to the full analytics architecture.
Data Foundation & Connectivity
Connect equipment, sensors, and ERP to a unified data layer. Establish baseline OEE, energy, and quality metrics. iFactory covers PLC, SCADA, MES, and ERP protocols — no production downtime needed. Book a demo to confirm equipment compatibility.
Food Safety & Compliance Digitization
Move HACCP plans, sanitation schedules, and corrective action workflows from paper to digital. Deploy mobile CCP logging for operators. UK and EU facilities should integrate environmental monitoring at this stage for BRC/SQF alignment.
Predictive Maintenance & Quality Optimization
Layer AI models over live equipment and quality data. Get early alerts for fill drift, micro-stops, or CCP trends before a breach occurs. This phase typically delivers the highest ROI. Book a demo to see it live.
Continuous Improvement & Analytics Maturity
Activate root cause analytics, cross-facility benchmarking, and sustainability reporting. Export supplier scorecards and ESG data to meet retailer and regulatory requirements across North American and European markets.
How AI Vision Enhances Food and Beverage Plant Operations
AI vision — the application of computer vision and machine learning to camera feeds across your facility — represents the most transformative capability shift in food manufacturing operations since the introduction of automated filling lines. Here is how it works in practical, non-technical terms, and why F&B plants in the UK, Germany, Canada, and UAE are deploying it at scale.
Automated Visual Quality Inspection
Cameras at packaging stations inspect every unit for fill level, seal integrity, label placement, and date code — at speeds no human can match. Defect detection accuracy exceeds 99.5%, eliminating consumer complaints from visually defective products.
Hygienic Zone Compliance Monitoring
AI cameras monitor high-care zones for GMP breaches — missing PPE, contamination entry points, and sanitation gaps — in real time. For UK, EU, and Canada RTE producers, this adds a continuous compliance layer without extra headcount. Book a demo to see it configured for your layout.
Filling Accuracy & Weight Verification
Computer vision detects underfill and overfill at the nozzle level, identifying which fillers and shifts generate the most giveaway. Overfill reduction typically delivers 0.8–1.5% improvement in product cost-per-unit.
Allergen Changeover Verification
AI vision confirms lines are clear of allergen residue after changeover — capturing timestamped image evidence linked to your allergen control plan. Essential for UK and German retailers with strict allergen labeling requirements.
Pallet & Warehouse Inspection
Vision cameras at wrapping stations inspect pallet build, label facing, and load stability — rejecting issues before they reach the warehouse. UAE exporters supplying GCC and EU markets reduce destination port rejections significantly. Book a demo to explore deployment options.
Predictive Equipment Health Monitoring
Thermal and optical cameras detect wear, misalignment, and lubrication failures on fillers, sealers, and conveyors — before failure occurs. iFactory automatically generates maintenance work orders when deterioration is detected.
F&B Plant Analytics Platforms: What to Evaluate in 2026
Not all food manufacturing analytics platforms are built for the compliance, traceability, and operational complexity of F&B environments. This comparison maps the capabilities that matter against platform categories available to manufacturers today.
| Capability | Generic MES / ERP | Standalone QMS | iFactory AI-Driven Platform |
|---|---|---|---|
| Real-Time OEE Analytics | Module add-on; limited depth | Not included | Native; line-level and shift-level |
| HACCP CCP Monitoring | Manual entry only | Basic digital forms | Real-time mobile capture; auto-escalation |
| Cold Chain Deviation Alerts | Not included | Not included | Continuous monitoring with CAPA trigger |
| Allergen Control Documentation | Basic labeling module | Allergen register only | Changeover workflows + AI vision integration |
| FSMA 204 Traceability | Partial lot tracking | Not included | Full CTE/KDE recordkeeping |
| Sanitation Schedule Digitization | Not included | Static checklists only | Photo-verified with environmental monitoring |
| Predictive Maintenance AI | Not included | Not included | AI models on equipment sensor data |
| Energy & ESG Reporting | Financial totals only | Not included | Line-level with Scope 1/2 export |
| Supplier Verification Records | PO-level only | COA storage; no risk scoring | Centralized portal with dynamic risk scoring |
| FDA 24-Hour Record Retrieval | Manual assembly required | Partial records exportable | Instant electronic export; all record types |
| Multi-Facility Consolidation | Requires custom integration | Single-site architecture | Native multi-site with cross-plant benchmarking |
| Deployment Timeline | 12–24 months | 3–6 months | 4–8 weeks; modular rollout |
Measurable Business Value from F&B Plant Analytics
Food and beverage manufacturers who deploy integrated plant analytics platforms consistently report measurable returns across four categories within the first year of full operation.
OEE Improvement
Real-time visibility into availability, speed, and quality losses enables targeted fixes — translating to millions of additional units annually with no capital investment.
Audit Prep Time Eliminated
Electronic records maintained continuously mean zero scramble before FDA, CFIA, BRCGS, or SQF audits — freeing your PCQI for proactive work.
Less Unplanned Downtime
AI predictive models flag equipment degradation 3–14 days before failure — enabling planned repairs at a fraction of emergency breakdown cost.
Average Giveaway Reduction
Granular fill analytics and AI vision recover 1–1.5% product giveaway — a direct margin gain that flows straight to EBITDA without volume changes.
Common F&B Plant Analytics Barriers — and How to Overcome Them
Even well-managed food facilities encounter predictable implementation challenges. Knowing these in advance allows leadership teams to plan for them rather than react to them.
Legacy Equipment with No Digital Output
Many UK and German F&B facilities run equipment from the 1990s–2000s with no data output. Analytics does not require replacement. iFactory retrofits analog equipment with non-invasive sensors — bringing legacy fillers and conveyors online without production disruption. Book a demo to confirm compatibility.
Operator Adoption Resistance
Long-tenured operators resist digital tools that slow them down during demanding shifts. iFactory's mobile interface uses large touch targets, one-tap CCP logging, and shift changeover workflows under 60 seconds. Adoption exceeds 90% within four weeks of go-live.
Data Silos Between Departments
Quality, maintenance, production, and supply chain teams use separate systems — creating blind spots where failures share root causes no one can see. iFactory's unified data model connects all four in one platform with role-specific dashboards, eliminating silos that let chronic issues persist.
Multi-Regulation Complexity
Manufacturers exporting from Canada or the UAE to EU, UK, and US markets must satisfy overlapping regulations with different record formats. iFactory's pre-mapped templates for 21 CFR 117, FSMA 204, EU 852/2004, and LFGB generate market-specific exports from the same data — no duplicate record-keeping.
Analytics Management Best Practices for Food & Beverage Plants in 2026
The highest-performing F&B analytics programs share a consistent set of operating principles that transcend facility size, product category, or geography.
Start with Food Safety, Not Efficiency
HACCP digitization in Phase 1 builds stakeholder trust and regulatory confidence — making efficiency analytics adoption faster in later phases.
Set Shift-Level Baselines First
Collect 4–6 weeks of clean shift-level data before benchmarking against industry standards. Rushing to comparisons without a stable baseline produces misleading targets.
Link KPIs to Financial Outcomes
Translate OEE points into capacity units, giveaway reduction into margin dollars, and audit hours saved into labor cost equivalents to maintain leadership support.
Treat Supplier Analytics as Core
Ingredient quality deviations and allergen mislabeling originate upstream. Supplier performance analytics — defect rates, COA compliance, on-time delivery — are as critical as line-level OEE. Book a demo to see the supplier module.
Build Regular Review Rhythms
Daily shift handovers, weekly quality reviews, and monthly leadership sessions ensure data drives decisions. iFactory's automated digest scheduler supports all three without manual reporting.
Plan for Regulatory Evolution
FSMA 204, EU CSRD, and UK SECR requirements are tightening. Choose a platform with a clear regulatory roadmap — not just compliance with today's standards.
Ready to Build an Analytics-Driven Food Plant in 2026?
iFactory's cloud AI-driven platform is purpose-built for food and beverage manufacturing — covering HACCP compliance, cold chain monitoring, OEE analytics, and AI vision in a single system deployable in 4–8 weeks.
F&B Plant Analytics: Questions Answered
Your Food Plant's Data Is Already There. iFactory Makes It Work for You.
From HACCP compliance and cold chain monitoring to AI vision quality inspection and OEE optimization — iFactory's cloud AI-driven platform turns your F&B plant's operational data into a continuous competitive and compliance advantage.