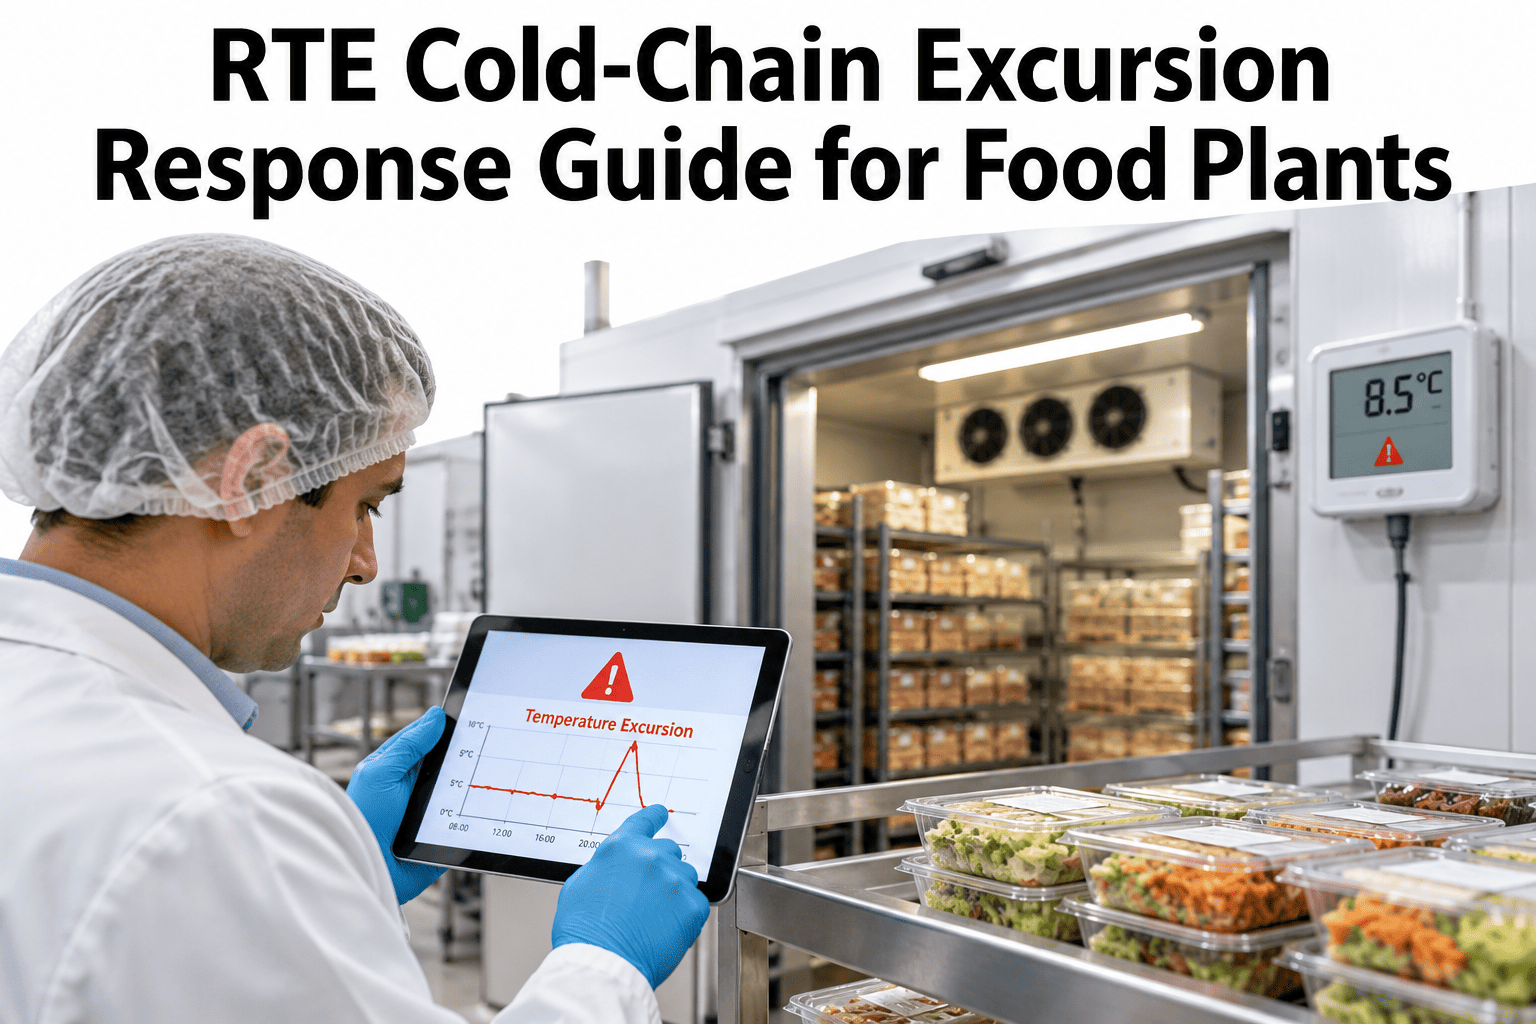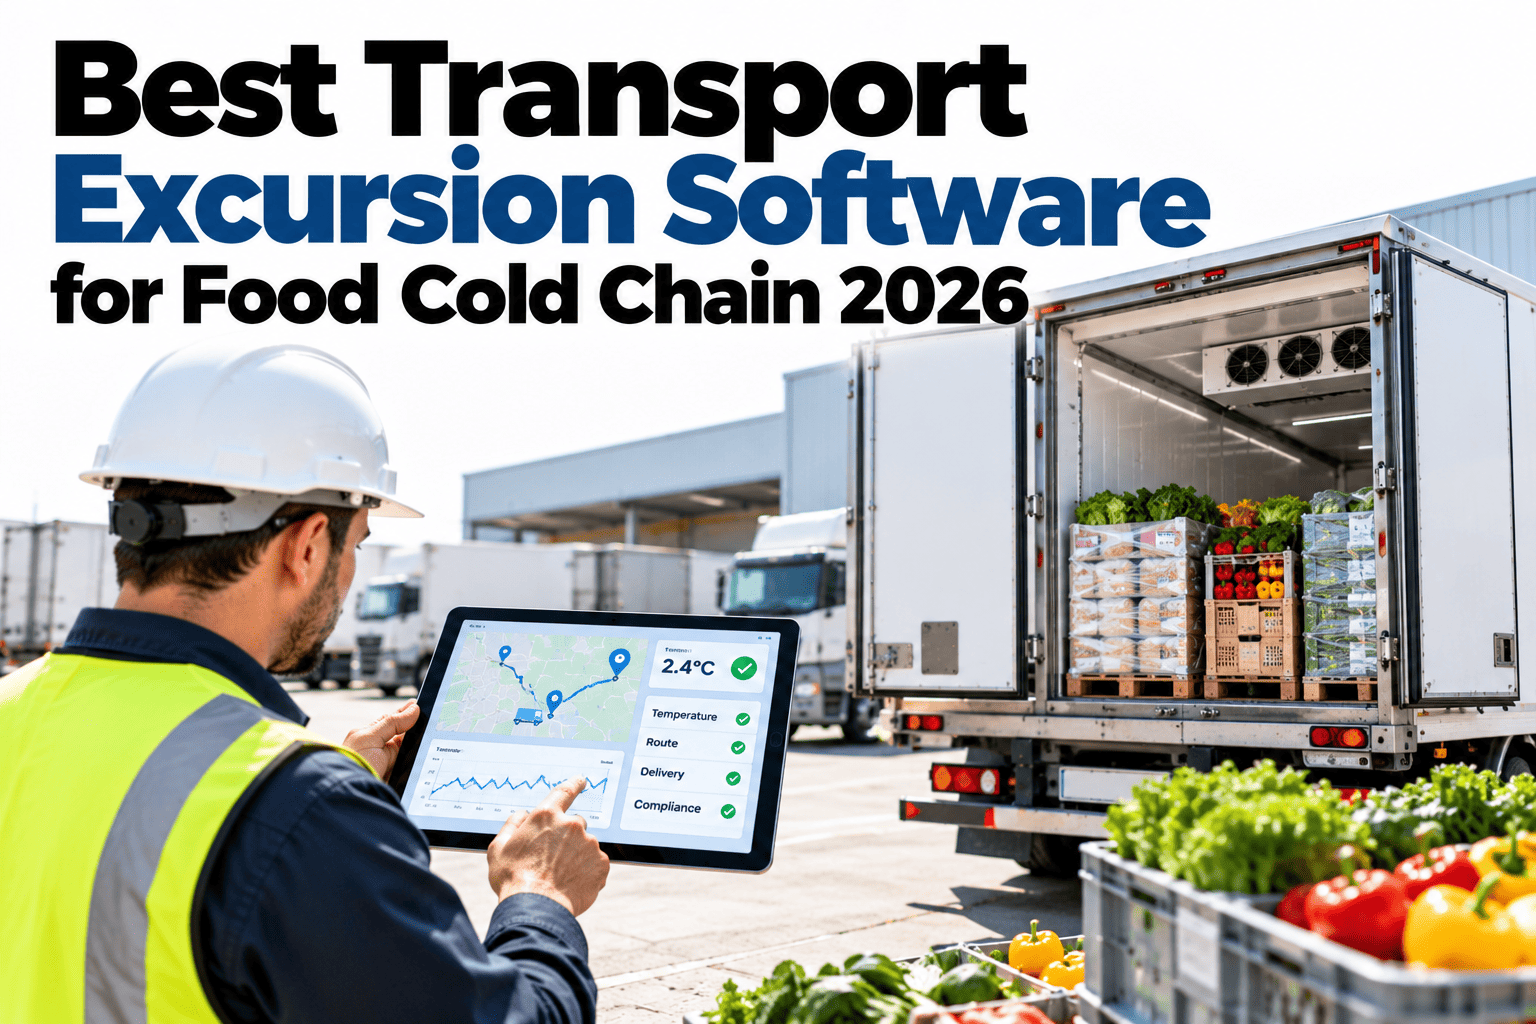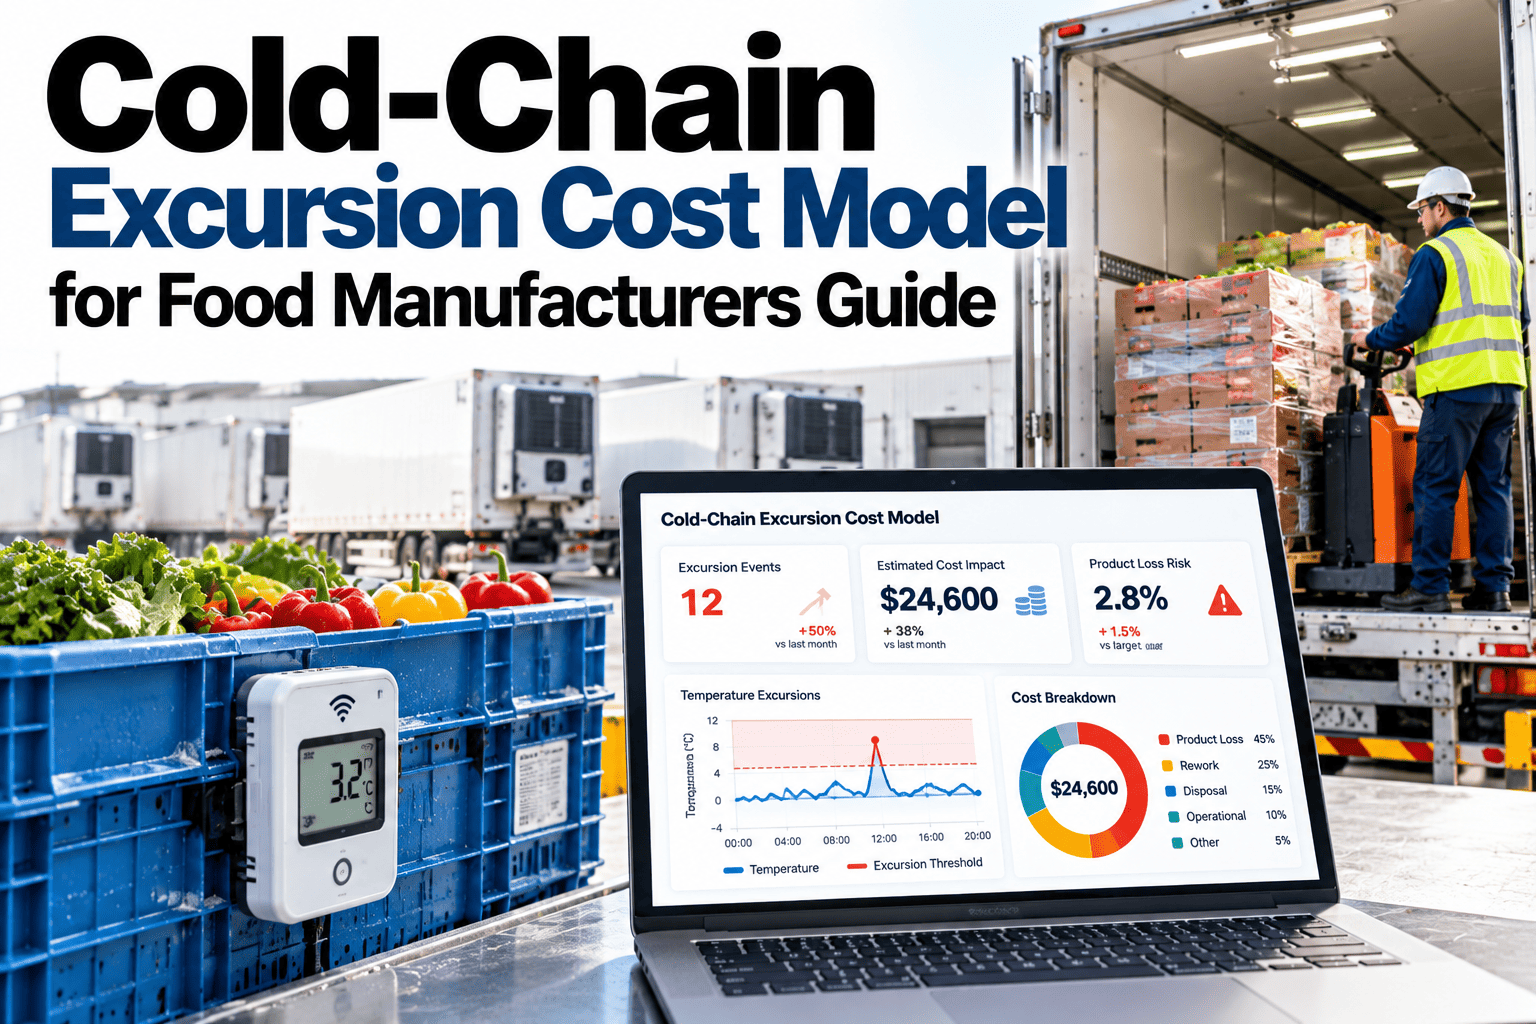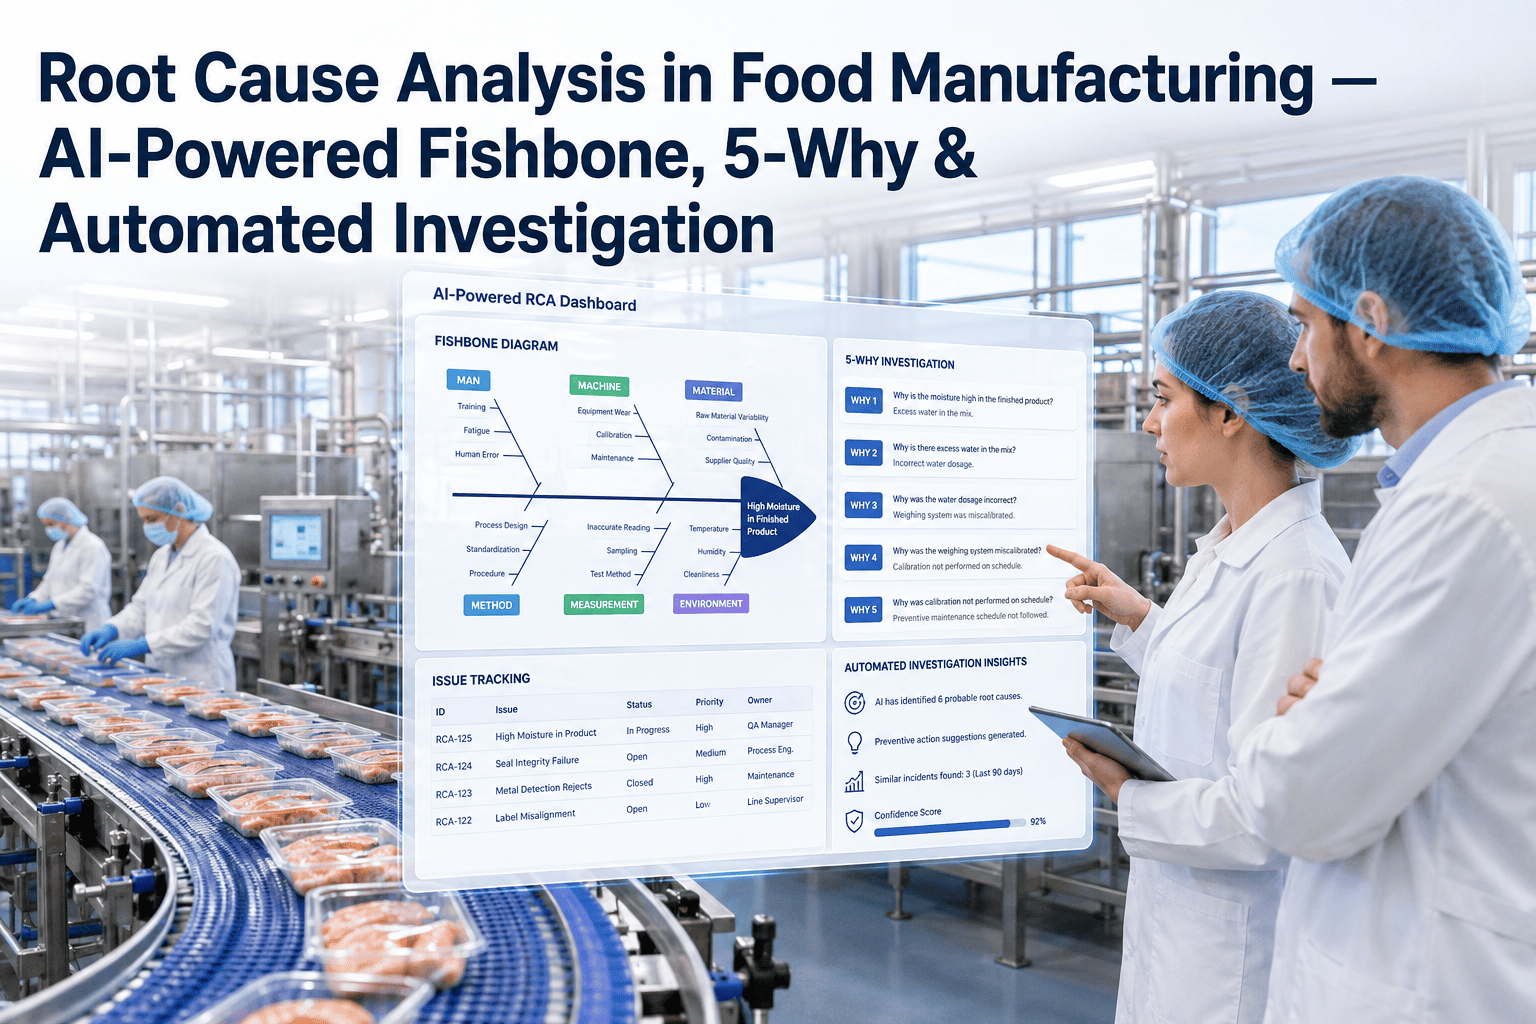
An alarm fires at 2 a.m. showing a reefer trailer spent ninety minutes above 8°C somewhere between a distribution center and a retail dock, and by the time anyone reviews it the next morning, the trailer has already been unloaded, the driver has moved on to another route, and nobody can say with confidence whether the door was left open at a stop, the unit's compressor cycled poorly, or the load was simply packed too tight for airflow. This is the exact moment where most cold chain break investigations quietly fail, not because teams lack the will to investigate, but because the data needed to reconstruct what actually happened was never captured in a form anyone could act on before the trail went cold. iFactory's cold chain analytics platform is built to preserve that trail automatically, so root cause analysis starts with evidence instead of guesswork.
Know exactly why a cold chain break happened, not just that it did
iFactory reconstructs the full timeline around every temperature excursion, so your team investigates causes instead of reconstructing timestamps from memory.
Why "it went above temperature" isn't a root cause
A temperature excursion alarm tells a team that something went wrong, but it almost never tells them why, and the why is what determines whether the corrective action actually prevents a repeat. Teams that stop at "the reading exceeded the limit" end up applying generic fixes, retraining staff on procedures that were never the problem, or replacing equipment that was functioning normally, while the actual cause, whether it's a specific dock door habitually left open or a particular route with a compressor that struggles on long highway stretches, keeps recurring under a different alarm number next month.
Equipment Cause
Compressor cycling failure, door seal degradation, thermostat drift, or defrost timer malfunction.
Process Cause
Door left open during loading, product staged too long on an unrefrigerated dock, overpacked trailer blocking airflow.
Environmental Cause
Ambient heat spike during a multi-stop route, prolonged idle time in direct sun, extended traffic delay.
What a real investigation record needs to include
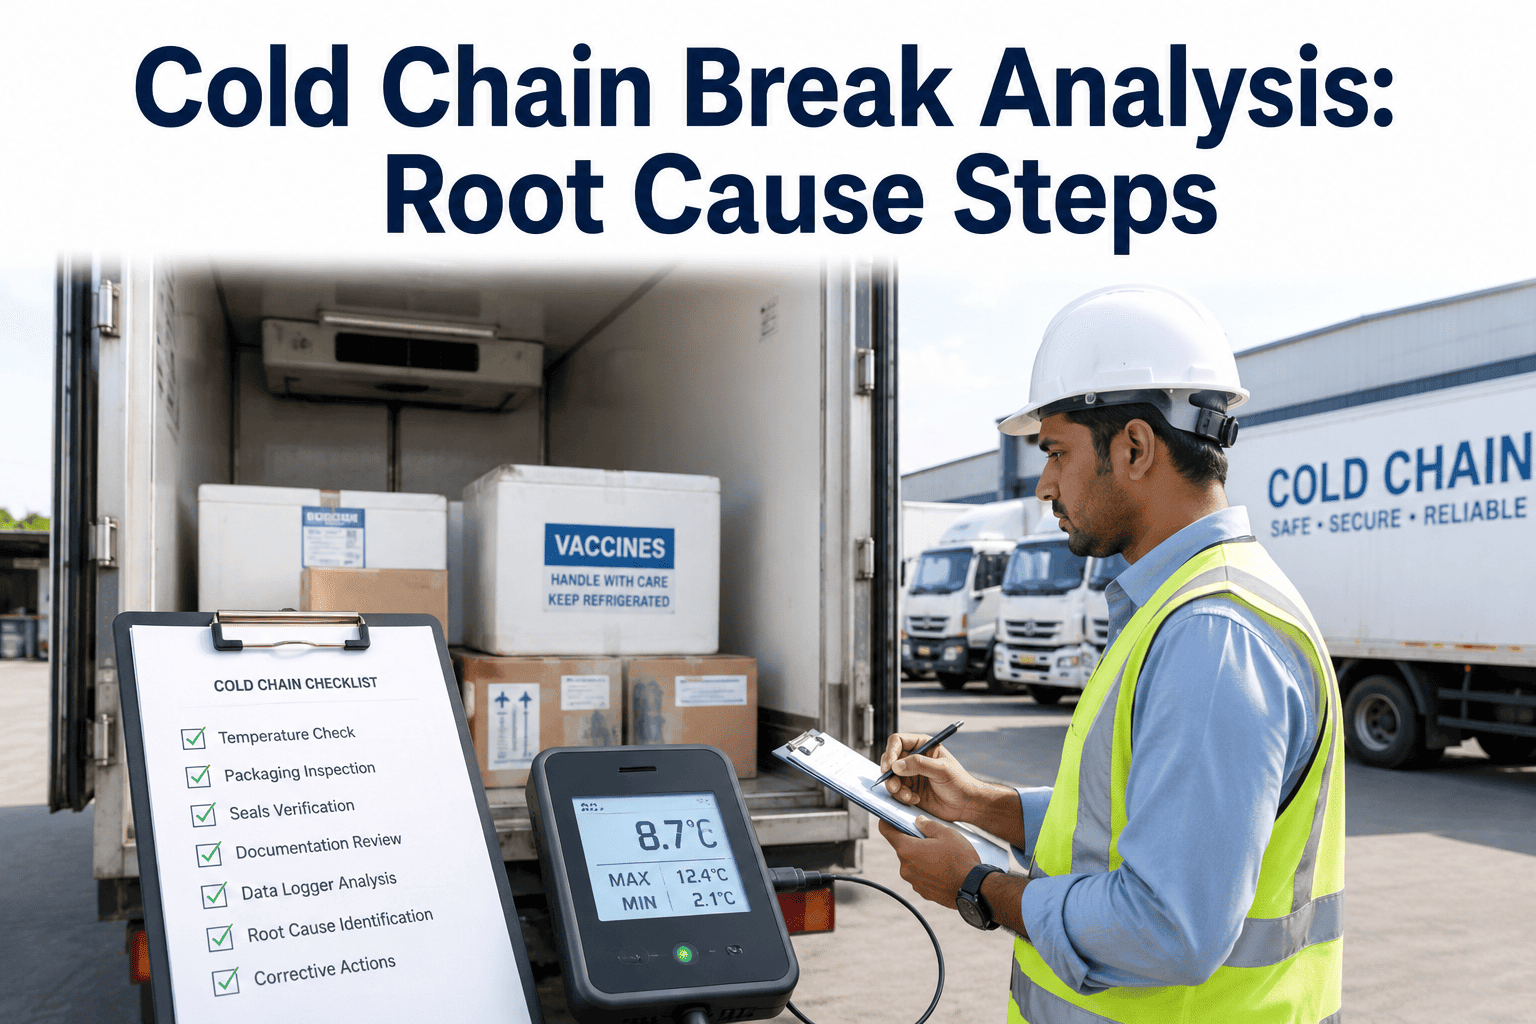
A defensible root cause finding depends on being able to line up several independent data streams against the same timestamp: the temperature curve itself, door-open sensor events if the asset has them, GPS and stop data for in-transit excursions, and any relevant ambient weather conditions. Most teams have access to some of this data already, scattered across a telematics portal, a door sensor log, and a weather service, but reconstructing it by hand for a single incident can take longer than the investigation itself should, which is exactly why so many corrective action reports end up citing "operator error" as a catch-all when the real cause was never actually isolated.
| Time | Temp | Door State | Location | Ambient Temp |
|---|---|---|---|---|
| 14:02 | 3.1°C | Closed | En route Stop 3 | 29°C |
| 14:18 | 3.4°C | Closed | Arrived Stop 4 | 31°C |
| 14:19 | 4.0°C | Open | Stop 4 Loading | 31°C |
| 14:41 | 8.7°C | Open | Stop 4 Loading | 32°C |
| 14:52 | 9.1°C | Closed | Departed Stop 4 | 32°C |
| 15:30 | 3.9°C | Closed | En route Stop 5 | 30°C |
In this reconstructed sequence, the excursion clearly correlates with an extended door-open period during loading at Stop 4, not with a compressor problem, which points the corrective action directly at loading dock procedure rather than at equipment maintenance that would have addressed the wrong root cause entirely.
Most excursion reports never get this level of correlated detail because pulling it together manually takes hours nobody has. Book a demo to see automatic timeline reconstruction on a real excursion from your own fleet.
Determining whether the product is still usable
Root cause analysis and product disposition are related but separate decisions, and rushing either one carries real risk in both directions. Disposing of product that experienced only a brief, shallow excursion within a still-safe cumulative time-temperature exposure wastes inventory unnecessarily, while releasing product that experienced a longer or deeper excursion than the disposition team realized creates a genuine food safety risk that a corrective action report won't undo after the fact.
Time-Temperature Integration
Calculates cumulative exposure across the full excursion rather than judging only the peak temperature reached.
Product-Specific Thresholds
Applies the correct tolerance for the specific product category, since a two-hour margin for hard cheese differs sharply from soft dairy.
Documented Justification
Produces a defensible record showing exactly why product was released or held, ready if a retailer or auditor asks.
From alarm to closed corrective action
Excursion detected
Continuous monitoring flags the deviation the moment it crosses threshold, not at end-of-shift review.
Timeline auto-assembled
Temperature, door, location, and ambient data are correlated automatically into one incident record.
Cause pattern surfaced
The record highlights the most likely contributing factor based on correlated timing, not just the alarm itself.
Disposition supported
Time-temperature integration gives the quality team a defensible basis for the release or hold decision.
Corrective action tracked
The specific fix, whether procedural or mechanical, is logged and checked against recurrence over time.
Catching recurring causes before they become a trend
A single excursion is an incident, but the same root cause appearing across multiple incidents is a systemic problem, and this distinction is easy to miss when every investigation lives in its own isolated report. iFactory keeps a running record of every excursion's identified cause, so if three separate incidents over two months all trace back to the same dock door or the same delivery route, that pattern surfaces on its own instead of requiring someone to manually notice a coincidence across unrelated reports filed weeks apart.
Root cause analysis, explained plainly
Turn your next excursion into a real answer, not a guess
See how automatic timeline reconstruction changes what a cold chain investigation actually looks like.