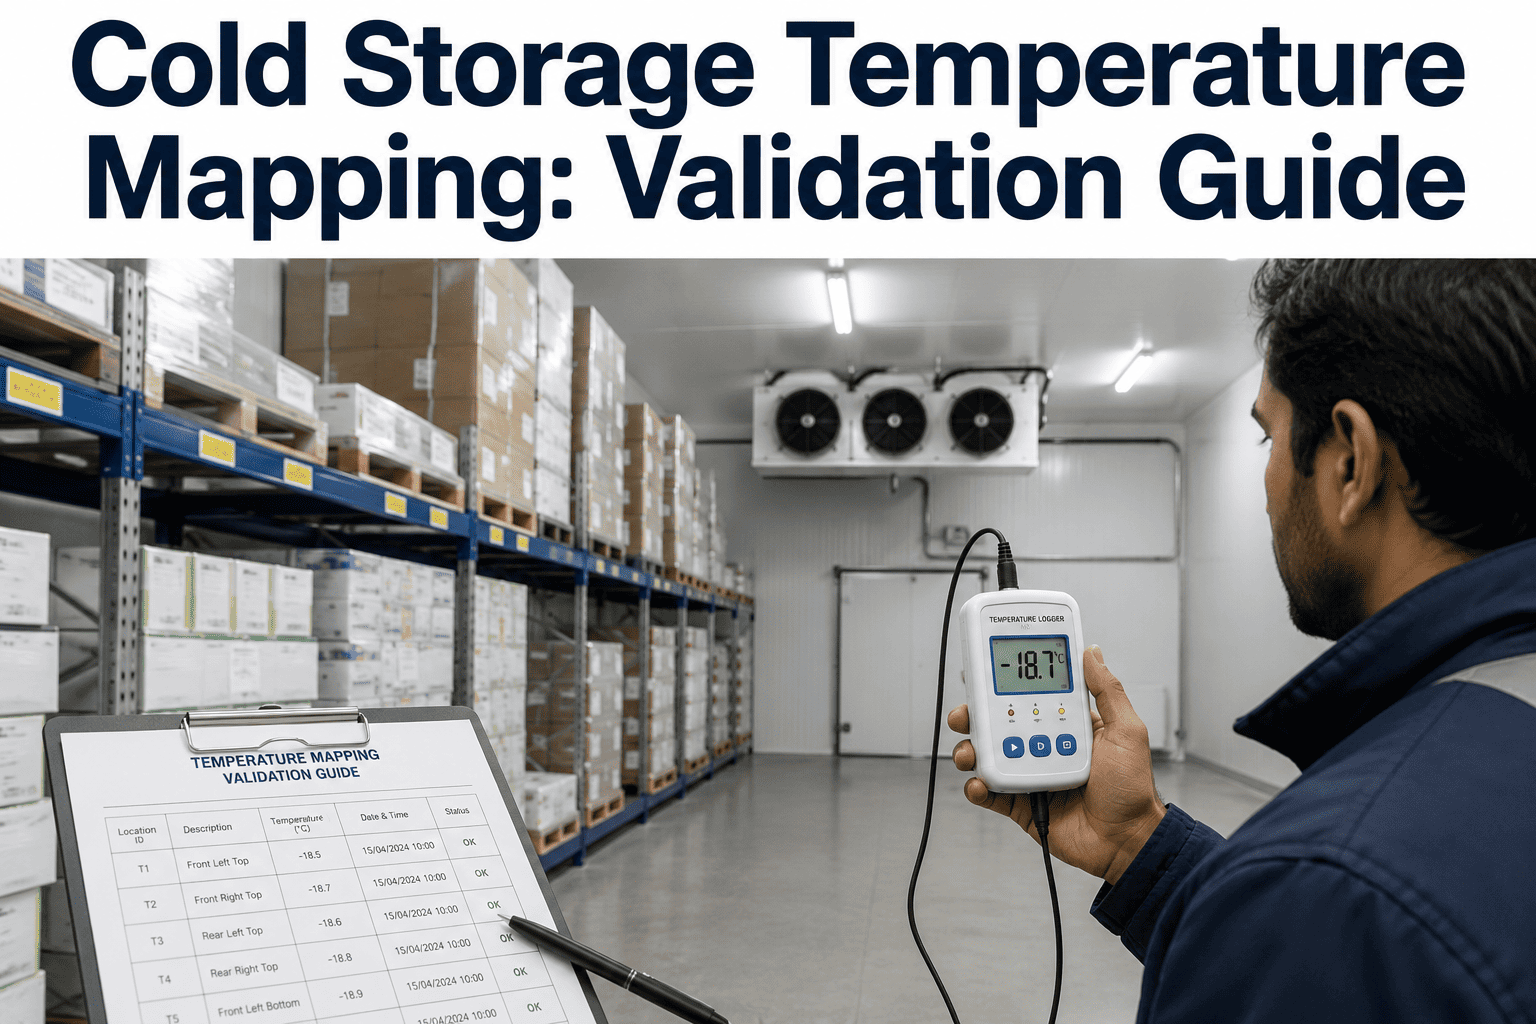
A cold storage warehouse that reads within range at its control sensor can still have pockets of product sitting several degrees outside acceptable limits, and most facility operators only discover this the hard way, through a customer complaint about product condition or a failed audit finding that the single point of temperature control never revealed. Temperature mapping studies exist precisely because a single sensor near the thermostat tells you almost nothing about actual conditions throughout a warehouse footprint, where airflow patterns, door traffic, rack density, and proximity to evaporator coils all create temperature variation that a facility's basic control system was never designed to detect. A proper mapping and validation protocol is what turns an assumption of uniform temperature into documented, defensible proof.
Cold Storage Temperature Mapping: A Validation Guide
Sensor placement strategy, loaded versus empty mapping comparisons, and qualification protocols for validating temperature uniformity across cold storage warehouse footprints.
Why One Sensor Per Room Is Not Validation
Most cold storage rooms operate with a single control sensor positioned near the thermostat or evaporator unit, which is sufficient for basic operational control but tells an operator nothing about temperature conditions at the far corners of the room, near loading dock doors, or inside dense pallet racking where airflow is restricted. A mapping study addresses this gap by placing a temporary grid of calibrated data loggers throughout the space, capturing a complete temperature profile that reveals hot spots, cold spots, and airflow dead zones that a single control sensor would never surface. Regulatory bodies and third-party auditors increasingly expect documented mapping studies as evidence of temperature uniformity, not just a control sensor log showing the room stayed within range at one point.
Sensor Placement Strategy Across the Warehouse Footprint
Sensor density and placement in a mapping study follow guidelines that scale with room size and complexity, generally targeting locations known to be most susceptible to temperature variation rather than a simple uniform grid. Corners farthest from air handling units, areas near frequently used doors, positions within dense rack storage, and locations near evaporator coil discharge all warrant dedicated logger placement, since these are the points most likely to reveal a variance that a generic grid layout might miss entirely.
Room Corners and Perimeter
Farthest points from air handling units typically show the greatest temperature drift and are prioritized in every mapping study regardless of room size.
Door and Dock Areas
Locations near frequently opened doors experience the most temperature fluctuation from ambient air infiltration during loading activity.
Dense Rack Storage Zones
Interior positions within tightly packed pallet racking often show restricted airflow, creating localized warm pockets even in a well-controlled room.
Evaporator Discharge Zones
Areas directly in the discharge path of evaporator coils can show colder-than-average readings that risk product freeze damage for temperature-sensitive items.
Loaded vs Empty Mapping: Why Both Studies Matter
A mapping study conducted only in an empty room misses the airflow restriction and thermal mass effects that fully loaded product racking introduces, while a study conducted only under loaded conditions cannot isolate whether a variance point is caused by the room's fundamental design or by the specific loading pattern in place at the time. Book a Demo to review a mapping protocol comparing loaded and empty configuration for your specific warehouse layout.
| Study Condition | Purpose | What It Reveals |
|---|---|---|
| Empty room mapping | Establishes baseline HVAC and airflow performance | Fundamental design-related hot and cold spots |
| Fully loaded mapping | Validates real-world operating conditions | Rack-induced airflow restriction and thermal mass effects |
| Seasonal comparison mapping | Confirms performance across ambient temperature extremes | Seasonal variance in door traffic and ambient load impact |
| Power-loss recovery mapping | Documents recovery time after simulated power interruption | Worst-case excursion duration and recovery curve |
Get a Documented, Defensible Temperature Mapping Study
iFactory helps cold storage operators design, execute, and document mapping and validation studies that hold up to customer audits and regulatory review.
A Practical Qualification Protocol Checklist
A complete mapping and qualification protocol documents more than just the raw temperature readings collected during the study. Auditors and customers reviewing this documentation typically expect to see the full methodology alongside the results, since the credibility of a mapping study depends as much on how it was conducted as on what it found.
Calibrated data logger placement plan documenting the specific location and rationale for every sensor point in the study.
Study duration sufficient to capture at least one full operational cycle including door traffic, defrost cycles, and shift changes.
Both loaded and empty room configurations tested, or a documented rationale for testing only one condition.
Statistical summary of minimum, maximum, and mean temperature at every logger point compared against the room's acceptable range.
Corrective action plan for any point identified outside acceptable range, along with a re-mapping schedule to confirm the fix.
Cold Storage Temperature Mapping — Frequently Asked Questions
Logger count scales with room volume and complexity rather than following a single fixed number, but a common starting guideline is roughly one logger per 1,000 to 2,000 cubic feet of storage space, with additional loggers added at known risk points such as corners, doors, and dense rack zones regardless of overall room size. A small single-door cooler might require as few as eight to twelve loggers, while a large multi-zone distribution warehouse could require several hundred points across its full footprint. The right count is determined by working through the room's specific layout and airflow design rather than applying a generic ratio.
A mapping study needs to run long enough to capture at least one complete operational cycle, which typically means a minimum of 24 to 72 hours depending on the facility's shift pattern, defrost cycle frequency, and door traffic rhythm. Studies conducted over a shorter window risk missing a variance that only appears during a specific recurring event, such as an overnight defrost cycle or a high-traffic loading period, and would produce a mapping record that looks compliant while missing the actual worst-case condition the room experiences during normal operation.
Most quality and regulatory frameworks expect periodic re-validation rather than a single one-time study, particularly after any significant change to the facility such as HVAC equipment replacement, racking reconfiguration, or a change in typical product loading pattern. Many operators schedule a full re-mapping on an annual basis as a standard practice, with an additional re-mapping triggered immediately following any physical change to the room that could plausibly affect airflow or temperature distribution, rather than waiting for the next scheduled cycle.
A documented corrective action plan follows, which might involve relocating product away from the identified variance point, adjusting airflow through baffle or fan modification, or in some cases accepting the variance for non-temperature-sensitive product categories while restricting that zone from sensitive items. The mapping protocol should include a defined process for addressing findings rather than treating the study as complete once data collection ends, since an unresolved variance point identified but not acted upon can become a liability during a later audit or investigation.
Continuous monitoring and periodic mapping studies serve complementary rather than interchangeable purposes, since continuous monitoring with fixed sensors confirms ongoing operational performance at established points, while a mapping study specifically tests whether those established points and the room's overall temperature uniformity assumptions remain valid. A facility with strong continuous monitoring at a handful of fixed sensors can still have undetected variance elsewhere in the room, which is exactly what a periodic mapping study is designed to catch. Book a demo to see how continuous monitoring and mapping studies work together in a complete validation program.
Prove Your Cold Storage Uniformity With a Documented Mapping Study
iFactory designs and documents temperature mapping studies that meet audit and regulatory expectations for cold storage warehouse validation.