A corporate maintenance review at a multi-plant food enterprise usually starts the same way: someone spends most of a week pulling numbers from six different spreadsheets, one per plant, each formatted slightly differently, each a few weeks stale by the time it reaches the boardroom. By the time leadership sees which facility is overspending on reactive repairs or which line is quietly dragging down uptime across the network, the quarter is nearly over and the decision window has mostly closed. An executive scorecard fixes this by putting plant ranking, spend efficiency, uptime, and reliability on one page, refreshed continuously rather than reassembled by hand every month, and the fastest way to see what that actually looks like across your own network is to book a demo.
FOOD & BEVERAGE · CORPORATE MAINTENANCE VISIBILITY
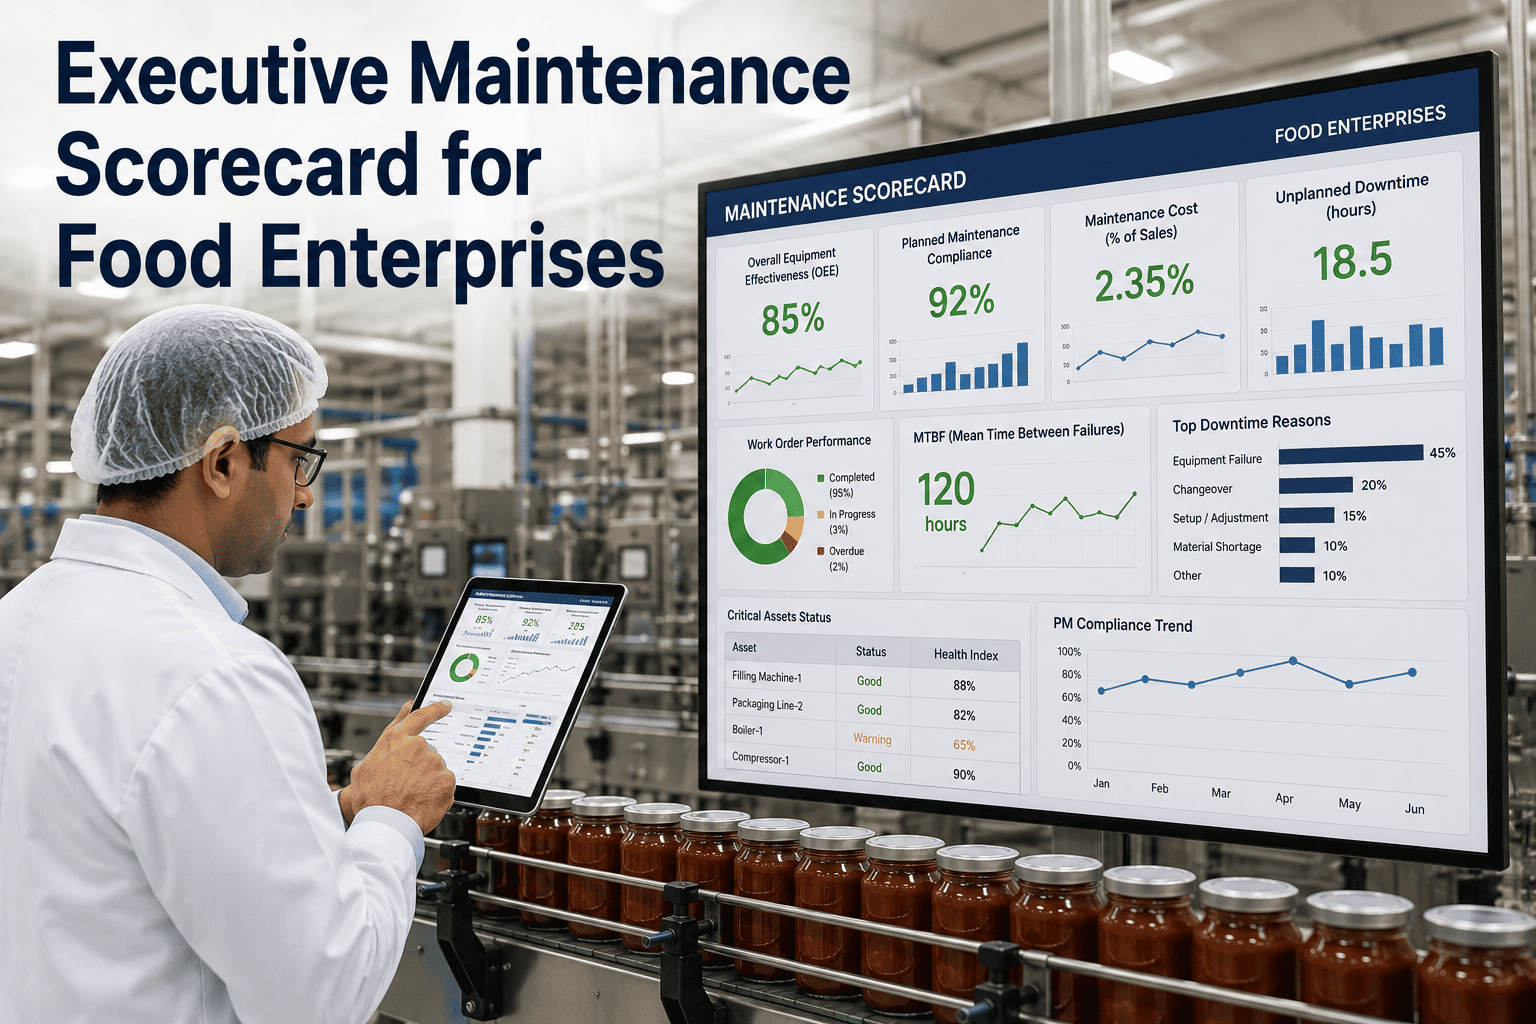
One Page, Every Plant, No Spreadsheet Assembly
iFactory's executive scorecard gives food enterprise leadership a live view of plant ranking, maintenance spend efficiency, uptime, and reliability across the entire network, replacing the monthly report that's already stale before it reaches the boardroom.
THE FOUR NUMBERS THAT MATTER
What Leadership Actually Needs on One Screen
Plant floors track dozens of maintenance metrics, and almost none of them belong in front of a corporate leadership team. An executive scorecard has to compress that noise down to the handful of numbers that actually drive capital allocation, staffing, and portfolio decisions.
Lowest-Ranked Plant This Month
Preventive Maintenance Compliance
Every number on this view rolls up from the same live CMMS data every plant is already generating, which means leadership is looking at the current state of the network rather than a snapshot that was already a few weeks old the moment it was compiled.
SEEING EVERY PLANT AT ONCE
What a Multi-Plant Ranking View Actually Shows
The single biggest advantage of a scorecard over a spreadsheet report is comparability. A number in isolation tells you almost nothing about whether a plant is performing well; a number ranked against five sister facilities running the same equipment tells you exactly where to look first.
| Facility |
Uptime |
PM Compliance |
Spend vs Budget |
Network Rank |
| Plant A — Midwest |
96% |
97% |
Under budget |
1 |
| Plant B — Southeast |
93% |
95% |
On budget |
2 |
| Plant C — Northeast |
89% |
88% |
Slightly over |
4 |
| Plant D — West |
84% |
79% |
Over budget |
5 |
A ranking view like this turns a quarterly "how are we doing" conversation into a specific, actionable one: Plant D isn't just underperforming in the abstract, it's the facility with the lowest PM compliance and the highest overspend on the entire network, and that's exactly where a corporate maintenance review should start.
See your own network ranked this way
iFactory can build a scorecard against your existing CMMS data and show your current plant ranking in a working session.
DEFINING THE METRICS
What Each Scorecard Number Actually Measures
A scorecard is only useful if every executive looking at it understands what's actually behind each number, because a metric that requires a maintenance engineering background to interpret defeats the entire purpose of putting it in front of leadership.
Uptime
The share of scheduled production time each line was actually running, rolled up to a plant and then a network level, so a single failing line doesn't get buried inside a plant-wide average.
Spend Efficiency
The ratio of planned maintenance spend to reactive repair spend, since a plant that's constantly firefighting is spending more overall than one running a disciplined preventive program.
PM Compliance
The percentage of scheduled preventive maintenance tasks actually completed on time, the single strongest leading indicator of whether next quarter's uptime will hold or slide.
Network Rank
Every facility measured against every other facility running comparable equipment, so underperformance shows up as a comparison rather than getting explained away as "normal for that plant."
BEFORE AND AFTER CENTRALIZATION
What Changes When Every Plant Reports the Same Way
Food enterprises running plants independently almost always discover the same pattern once they centralize reporting: best practices developed at one facility were never shared, underperformance at another facility was invisible until it became a crisis, and every audit required weeks of prep because the documentation lived in a different format at every site.
DECENTRALIZED
Cross-plant visibilityNone
Audit readinessWeeks of prep
Best practice sharingAd hoc, verbal
Reporting formatDifferent per plant
CENTRALIZED SCORECARD
Cross-plant visibilityReal-time, one dashboard
Audit readinessInstant reports
Best practice sharingBuilt into workflows
Reporting formatStandardized network-wide
TURNKEY DEPLOYMENT
How iFactory Builds Your Executive Scorecard
What Gets Built
A single scorecard pulling live data from every plant's existing CMMS
Standardized metric definitions applied consistently across every facility
Automated network ranking updated continuously, not monthly
Drill-down access from the network view into any individual plant
Audit-ready export for regulatory and board reporting
Rollout Timeline
Weeks 1-2: Data audit across every plant's existing CMMS and reporting
Weeks 3-5: Metric standardization and scorecard build
Weeks 6-7: Leadership rollout, training, and first live board review
FREQUENTLY ASKED QUESTIONS
What Food Enterprise Leaders Ask Before Rolling This Out
Do all our plants need to be on the same CMMS for this to work?
No, and this is one of the most common misconceptions that stops food enterprises from centralizing sooner. A scorecard is built to pull data from whatever systems each plant is already running, standardizing the metric definitions at the reporting layer rather than requiring every facility to migrate onto identical underlying software first. That said, plants running very different or highly manual systems will take longer to connect than those already on a modern CMMS, so the data audit phase exists specifically to map out what each site actually has before committing to a timeline.
Book a demo to see how this maps against your current plant systems.
How is a plant's rank actually calculated when facilities run different equipment?
Ranking accounts for the type and age of equipment at each facility rather than comparing a plant running a new automated line directly against one running older, more manual equipment on the same scale. The methodology groups comparable asset classes and production profiles so the ranking reflects how well each plant is managing what it actually has, not simply which plant happens to have newer machinery. This is also why the scorecard supports drilling down into any individual plant's detail, since a network rank is meant to direct attention, not serve as the final word on a facility's performance.
Contact our support team to review the ranking methodology in detail.
How current is the data on the scorecard, really?
The scorecard is built to reflect current plant conditions rather than a monthly snapshot, pulling directly from each facility's live maintenance data instead of waiting for someone to manually compile and submit a report. That's the entire point of moving off spreadsheet-based reporting: a plant's uptime or spend efficiency number reflects what's actually happening on the floor right now, so a facility that starts drifting shows up on the network view days into the trend rather than at the end of the next quarter.
Book a demo to see how frequently your specific metrics would refresh.
Will plant managers see this as corporate surveillance rather than a useful tool?
That perception risk is real if a scorecard is introduced purely as a top-down monitoring tool, which is why the most successful rollouts frame it as a shared view rather than a one-way reporting mechanism. Plant managers get the same drill-down access corporate leadership has, which means a facility that's leading the network on PM compliance can actually show that performance clearly, and a facility working through a hard quarter has full context available rather than a single number standing alone. Framing the rollout around comparability and shared visibility, not just oversight, is a conversation worth having directly with your plant leadership before launch.
Contact our support team to talk through a rollout approach for your teams.
What happens if one plant's data quality is worse than the others?
This is exactly what the initial data audit is designed to surface before the scorecard goes live, rather than discovering it after leadership starts making decisions off a number that's quietly built on incomplete data. A facility with weaker CMMS discipline typically needs a short remediation period, standardizing how work orders and PM tasks are logged, before its numbers are fully comparable to sister plants with more mature data practices. Rather than hiding this gap, the scorecard can flag data confidence at the facility level so leadership knows which numbers to trust fully and which are still stabilizing.
Book a demo to discuss how data quality is handled across an uneven network.
EVERY PLANT, ONE SCREEN, NO SPREADSHEETS
Stop Running Your Network on a Report That's Already Out of Date
iFactory's executive scorecard gives food enterprise leadership live plant ranking, spend efficiency, uptime, and reliability on one page, refreshed continuously from the data your plants are already generating.