A corporate reliability report that shows Plant A running at 92 percent uptime and Plant B at 81 percent looks like a clear performance gap, until someone checks how each plant logs downtime. One site counts changeovers as planned stops, the other counts them as unplanned. One rounds short stops under five minutes, the other logs every one. The 11-point gap may be real, or it may be two different counting methods compared as if they were the same thing. Food enterprises comparing plants for 2026 can see how iFactory AI normalizes downtime data across sites before trusting the next corporate scorecard.
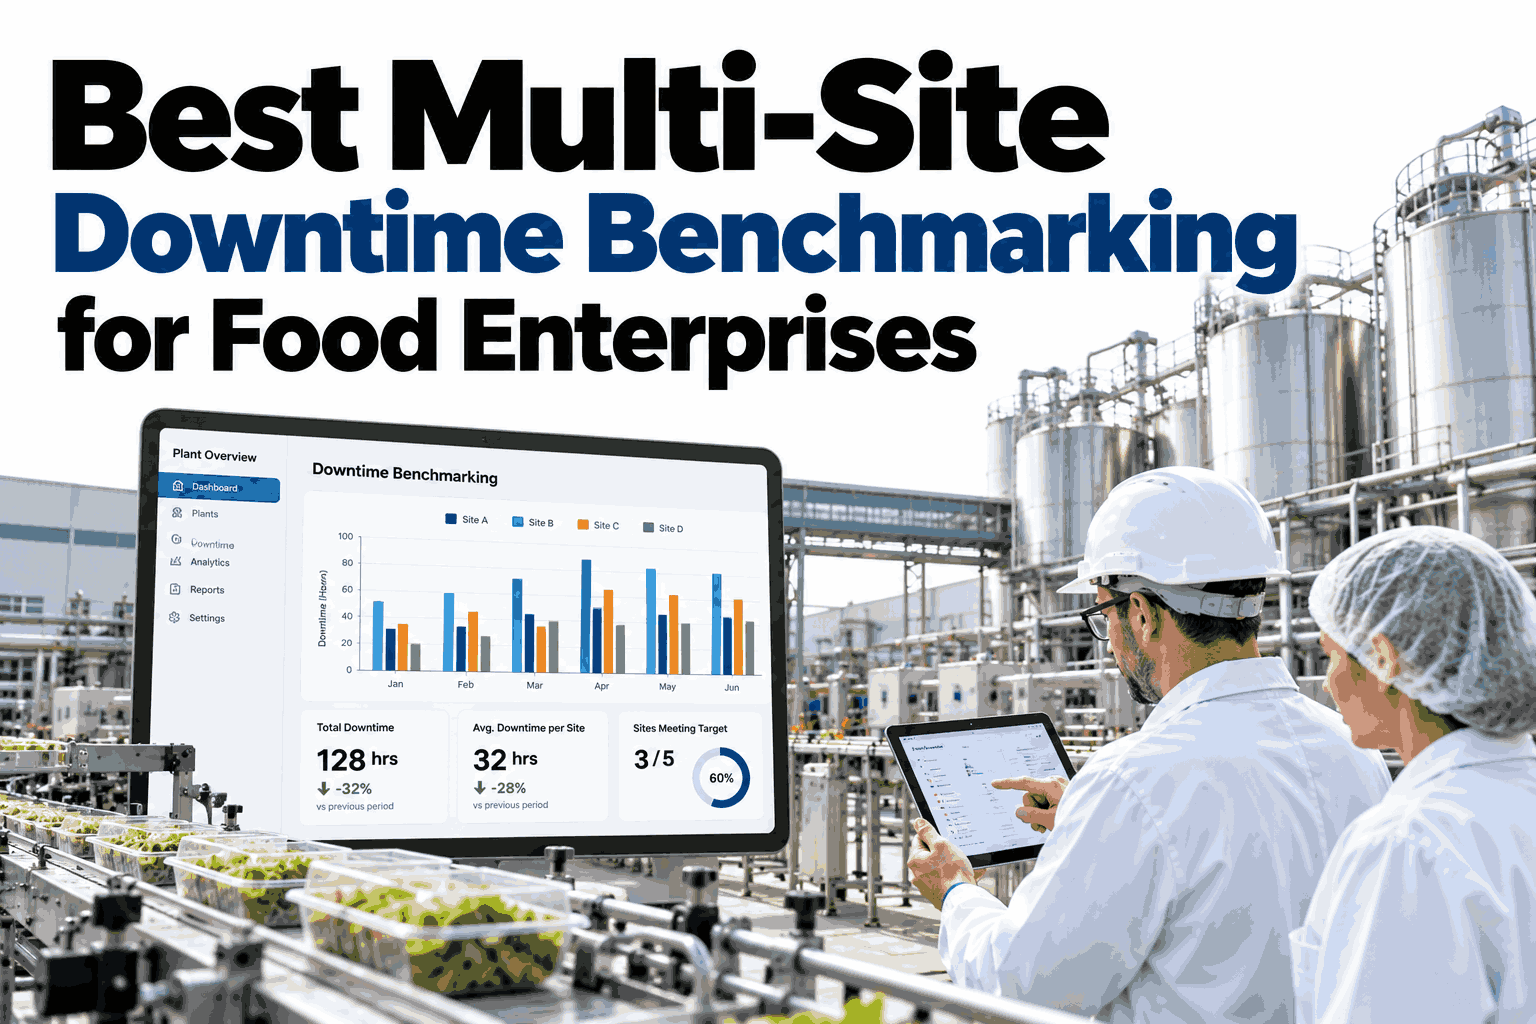
Best Multi-Site Downtime Benchmarking for Food Enterprises
How shared reason codes, calendars and event grouping turn plant-to-plant comparisons from a guess into a defensible number.
Why Site Comparisons Break Down
Most multi-plant downtime reports fail quietly. The numbers look fine until someone asks what is actually being measured.
One plant has forty custom codes, another has twelve, and neither maps cleanly onto a shared category for corporate review.
Planned maintenance windows, holidays and shift patterns differ by site, so uptime percentages are not built on the same clock.
A short stop under a few minutes may be ignored at one plant and logged in full at another, skewing frequency counts.
None of this means the plants are lying with data. It means the data was never built to be compared in the first place.
Four Layers of a Defensible Benchmark
A benchmark earns trust when it can be traced from a single corporate number down to the line and reason behind it.
See Your Plants on One Shared Scorecard
Book a 30-minute session and iFactory AI will show how downtime from your own sites maps onto one enterprise taxonomy and calendar.
From Raw Events to a Fair Comparison
Normalizing downtime data across plants follows a consistent sequence, whether a site has five lines or fifty.
Capture events
Stops, reasons and durations are pulled from line controls and operator logs at every plant, as they already exist locally.
Map to one taxonomy
Local reason codes are matched to a shared enterprise list, so a changeover means the same thing everywhere.
Apply one calendar
Planned stops, shift patterns and holidays are applied using shared rules instead of each site's own definition.
Group related events
Short, repeated stops tied to one cause are grouped, so frequency counts reflect the real problem, not the logging habit.
Publish the comparison
Corporate, plant and line views are built from the same normalized data, so every level of the report agrees.
Same Label, Different Meaning
An illustrative example shows how two plants can report the identical reason code and mean two different things by it.
Logged only when a full product changeover exceeds fifteen minutes on the packaging line.
Short format adjustments under that threshold are absorbed into run time and never recorded.
Reported changeover downtime looks low compared to other sites running the same product mix.
Logged for any stop tied to a product or format switch, with no minimum duration applied.
Short adjustments and full changeovers are recorded under the same single code.
Reported changeover downtime looks high, even though the underlying process may be just as efficient.
Neither plant is wrong on its own terms. A shared taxonomy and a minimum-duration rule applied to both is what makes the comparison fair.
How to Evaluate Benchmarking Software in 2026
Use this table as a shortlist filter, then bring finalists to a live test against two of your own plants.
| Criterion | What Good Looks Like | Warning Sign |
|---|---|---|
| Reason code model | Maps local codes to one enterprise taxonomy automatically | Relies on each plant renaming codes by hand |
| Calendar handling | Applies shared rules for shifts, holidays and planned stops | Each site defines its own uptime calculation |
| Event grouping | Groups repeated short stops into one root cause | Counts every micro-stop as a separate unrelated event |
| Drill-down | Traces a corporate number down to plant, line and reason | Corporate figures cannot be traced back to source data |
| Rollout fit | Works across plants with different machines and control systems | Tied to one equipment brand or one plant's existing setup |
Where iFactory AI Fits
iFactory AI connects to each plant's existing systems and builds the shared taxonomy and calendar layer on top, without asking sites to change how they already log data.
One enterprise taxonomy
Local reason codes are mapped to a shared list once, then applied automatically as new events arrive.
Shared calendar rules
Shift patterns, holidays and planned-stop definitions are applied the same way at every plant.
Traceable scorecards
Any corporate figure can be drilled down to the plant, line and reason code behind it in one click.
Ask in plain language
Leaders can ask why Plant B trails the group this month and receive the ranked root causes.
iFactory AI arrives pre-configured on an NVIDIA server that ships racked and ready with software pre-loaded. Scope covers plant connections, taxonomy mapping, corporate dashboard build and 24x7 remote monitoring.
Frequently Asked Questions
Do all our plants need to use the same CMMS first?
No. Benchmarking software is built to read from whatever systems each plant already runs and map the data afterward. Waiting for every site to standardize on one CMMS before benchmarking usually delays the project by years. A short session on connecting mixed systems shows how this works in practice.
How many reason codes should the enterprise taxonomy have?
Most food enterprises land between twenty and forty shared categories, enough to separate major causes without forcing every local nuance into one bucket. Too few codes hides real differences, and too many recreates the same comparison problem at a smaller scale. Ask support for a sample taxonomy built for food and beverage lines.
What counts as a short stop that should be grouped?
There is no universal number, but most plants set a threshold between one and five minutes, below which repeated stops tied to the same cause are grouped into one event. The right threshold depends on line speed and the kind of micro-stops that are common on your equipment. See grouping rules applied to your own event data in a guided session.
Can we still see each plant's own local reason codes?
Yes. Local codes stay visible to plant teams for day-to-day troubleshooting, while the enterprise view shows the mapped, shared category for corporate comparison. Neither view replaces the other, since each serves a different audience. Support can explain how the two views stay linked.
How often is the corporate scorecard updated?
Most enterprises refresh plant comparisons daily, with drill-down available down to the shift and line level at any time. A monthly or quarterly cadence is usually reserved for leadership summaries rather than the working dashboard itself. Schedule a walkthrough of the refresh cycle to see both views in action.
Compare Plants on the Same Terms
iFactory AI normalizes reason codes, calendars and event rules across every plant, so your corporate scorecard holds up to scrutiny. Book a walkthrough to see it on your own site data.