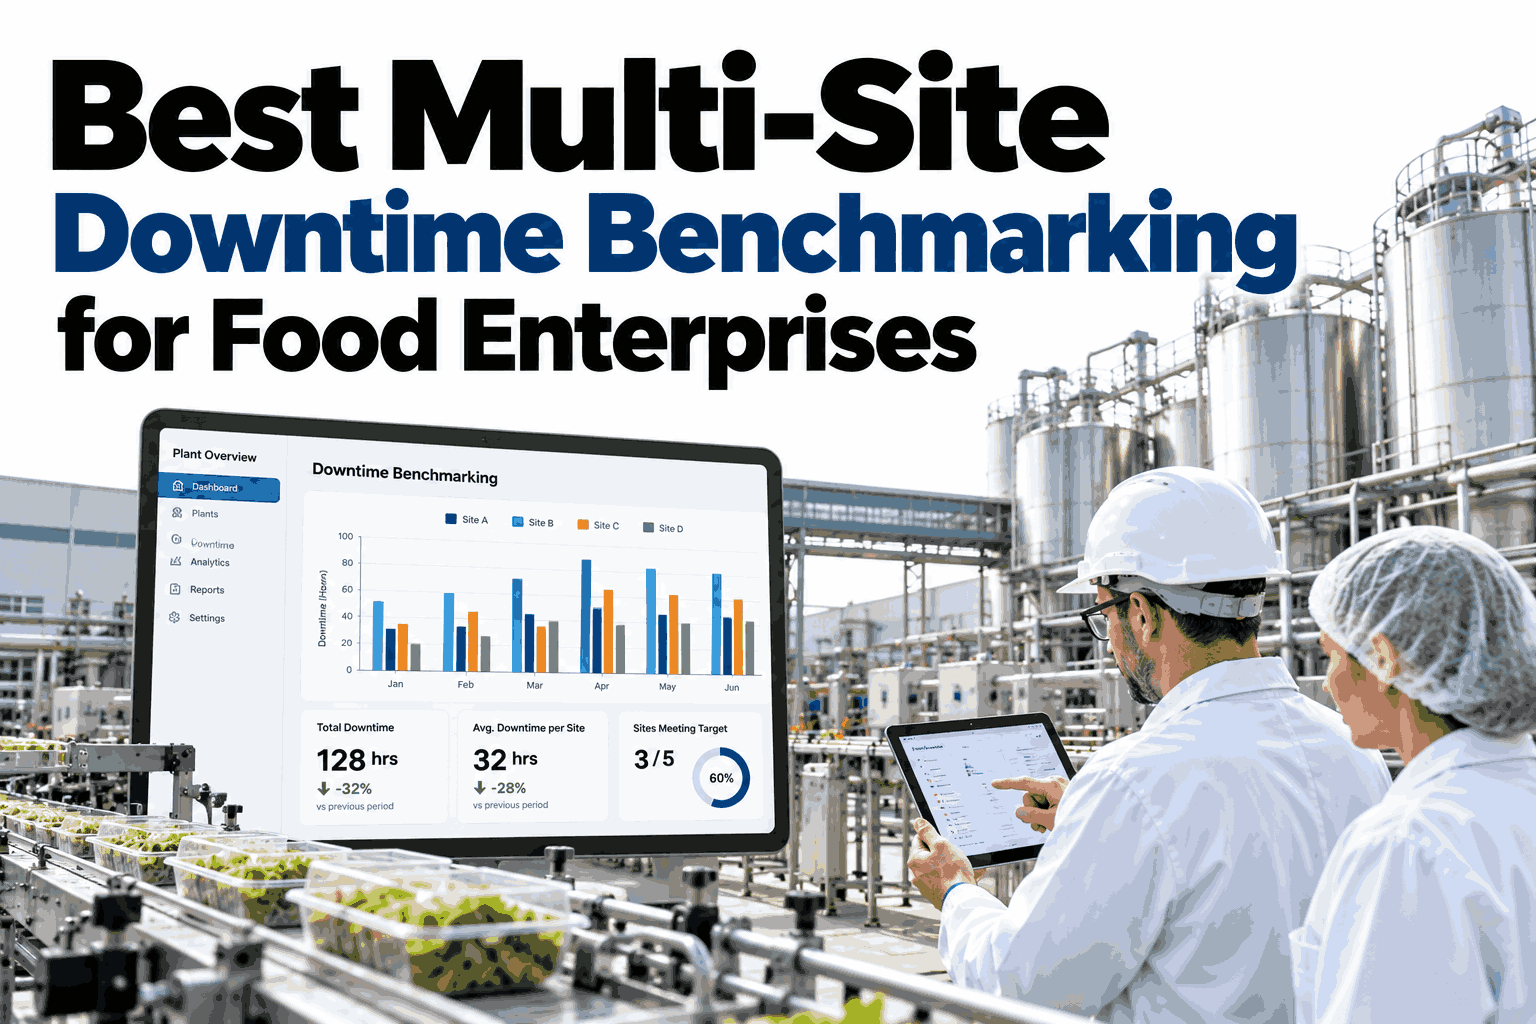
An enterprise food group running six plants on six different legacy systems usually discovers that "compare plant performance" is a multi-week spreadsheet project before anyone can even start the comparison, because each plant logs downtime reasons in its own vocabulary, runs its own fiscal calendar quirks, and groups events differently enough that the raw data isn't actually comparable yet. Enterprise reason codes, one shared calendar and consistent event grouping fix the data before the benchmarking even starts, and they're what let a multi-plant rollout finish in weeks instead of months. iFactory AI's enterprise team can map your own plants' reason codes onto one shared taxonomy before your next benchmarking cycle.
You Can't Benchmark Plants Whose Data Doesn't Speak the Same Language
Enterprise reason codes, one shared calendar and consistent event grouping make six plants' data genuinely comparable, which is the actual prerequisite for benchmarking — and it's what gets this live in weeks, not months.
Why Benchmarking Projects Stall Before They Start
A plant in one region logs a changeover delay as "setup," while a sister plant two states away logs the identical event as "changeover" or even splits it across two separate codes, and a benchmarking project that tries to compare the two without reconciling that vocabulary first ends up comparing noise, not performance. The reconciliation work — building one enterprise taxonomy and mapping every plant's historical data onto it — is the actual bottleneck in most multi-plant rollouts, not the benchmarking math itself.
The same event type logged under different names at different plants.
Different fiscal period definitions make period-over-period comparison unreliable.
One plant counts a cluster of micro-stops as one event, another as several.
Six plants, six different systems, none designed to talk to each other.
Fixing the Data Before the Comparison
Reconciliation has to happen before any cross-plant number means anything. Our team can review how your plants' current reason codes map onto a shared taxonomy.
A shared set of categories every plant's historical data gets mapped onto.
One shared period definition so period-over-period comparisons are real.
The same logic for what counts as one event, everywhere.
Only now does a cross-plant ranking actually reflect performance, not vocabulary.
A Typical Rollout Timeline
| Phase | Typical Duration | Focus |
|---|---|---|
| Taxonomy and calendar design | 1–2 weeks | Define the shared reason codes and fiscal periods |
| Historical data mapping | 2–4 weeks | Map each plant's existing data onto the shared taxonomy |
| Pilot benchmarking | 1–2 weeks | Validate comparisons on a subset of plants before full rollout |
| Full enterprise rollout | Ongoing | All plants reporting on the same reconciled structure |
See How Your Plants' Data Reconciles
Share reason-code lists and calendar definitions from a few of your plants, and see what a shared taxonomy mapping would actually look like.
A Composite Scenario: The Ranking That Was Measuring Vocabulary
Picture an F&B group's first attempt at cross-plant benchmarking, which ranked one plant as the clear underperformer on downtime, triggering a review of its maintenance practices.
Once reason codes were reconciled onto a shared taxonomy, it became clear the "underperforming" plant had simply been logging events more granularly than its sister sites, splitting what others counted as one event into several — its actual downtime performance was comparable to the group average all along. The maintenance review that followed the original ranking had been investigating a data artifact, not a real problem. The scenario illustrates why reconciliation has to come first; actual findings vary by group.
Where iFactory AI Fits
iFactory AI builds one enterprise reason-code taxonomy, standardizes the fiscal calendar and applies consistent event-grouping rules across every plant, so benchmarking reflects actual performance instead of each site's own historical vocabulary.
Every plant's historical data mapped onto one reason-code structure.
Period-over-period comparisons that actually align across sites.
A structured reconciliation process designed to deploy quickly across a group.
Frequently Asked Questions
For a mid-sized group, taxonomy design and historical data mapping typically take a few weeks total, depending on how many distinct reason-code systems are currently in use and how much historical data needs remapping. Scope a reconciliation timeline for your group's plant count.
Ideally plants adopt the shared taxonomy going forward for new events, while historical data gets mapped retroactively, so the change to daily logging is usually smaller than reconciling years of past records. Discuss the transition approach for your plants' current processes.
Historical data is remapped onto the new taxonomy rather than discarded, preserving trend continuity so a plant's past performance can still be compared against its own history under the new, consistent structure. Review historical data handling for your rollout.
Yes, reconciliation typically works at the data layer, mapping output from each plant's existing systems onto the shared taxonomy rather than requiring every plant to replace its underlying software. Ask about legacy system compatibility for your group.
A pilot phase comparing a subset of plants against known operational realities — checking whether the reconciled ranking matches what plant leaders already know about relative performance — is the practical way to validate the mapping before trusting it at full scale. Discuss a pilot validation approach for your group.
Make Your Plants' Data Comparable Before You Compare It
iFactory AI builds one reason-code taxonomy, one calendar and consistent event grouping across your plants, so benchmarking reflects real performance.