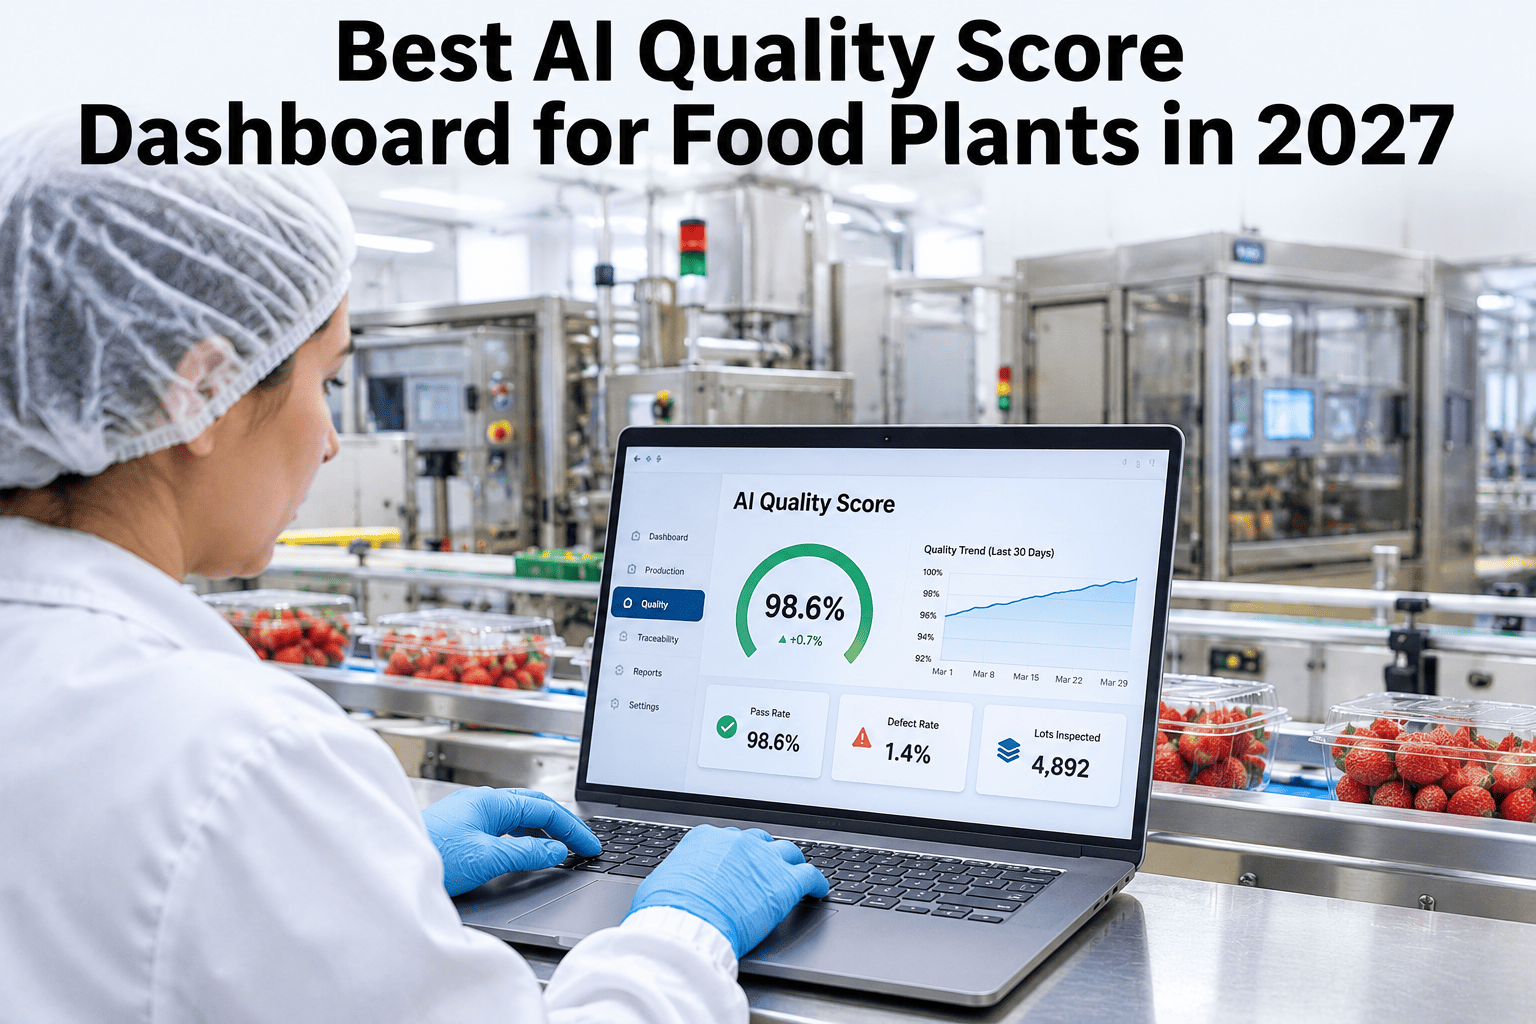
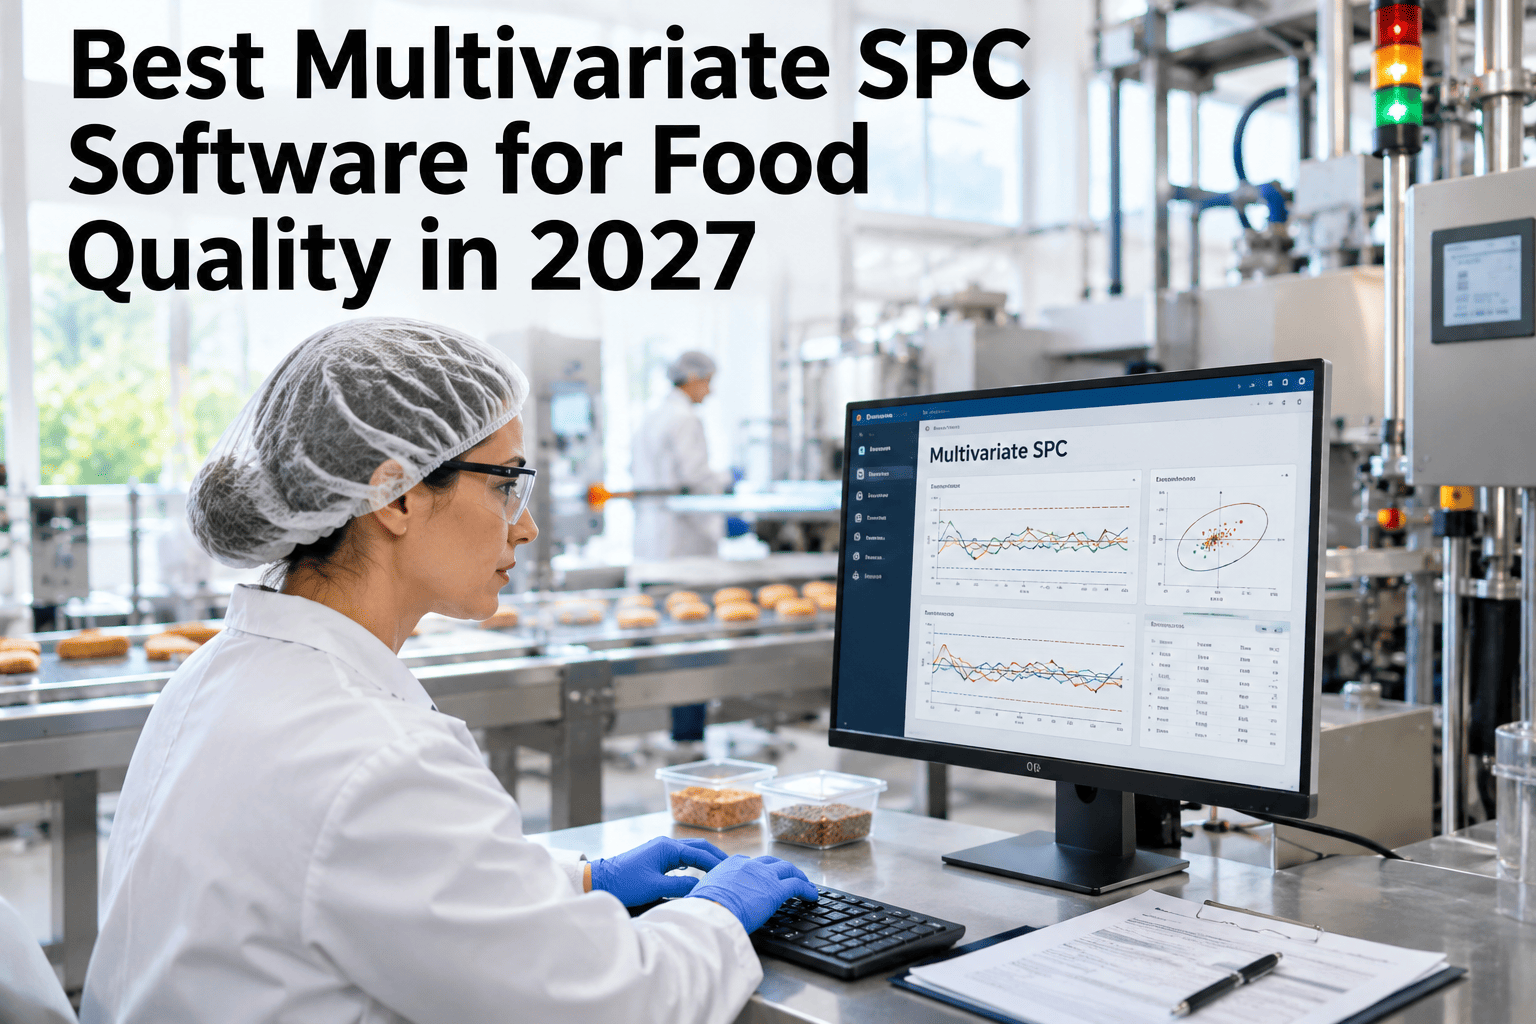
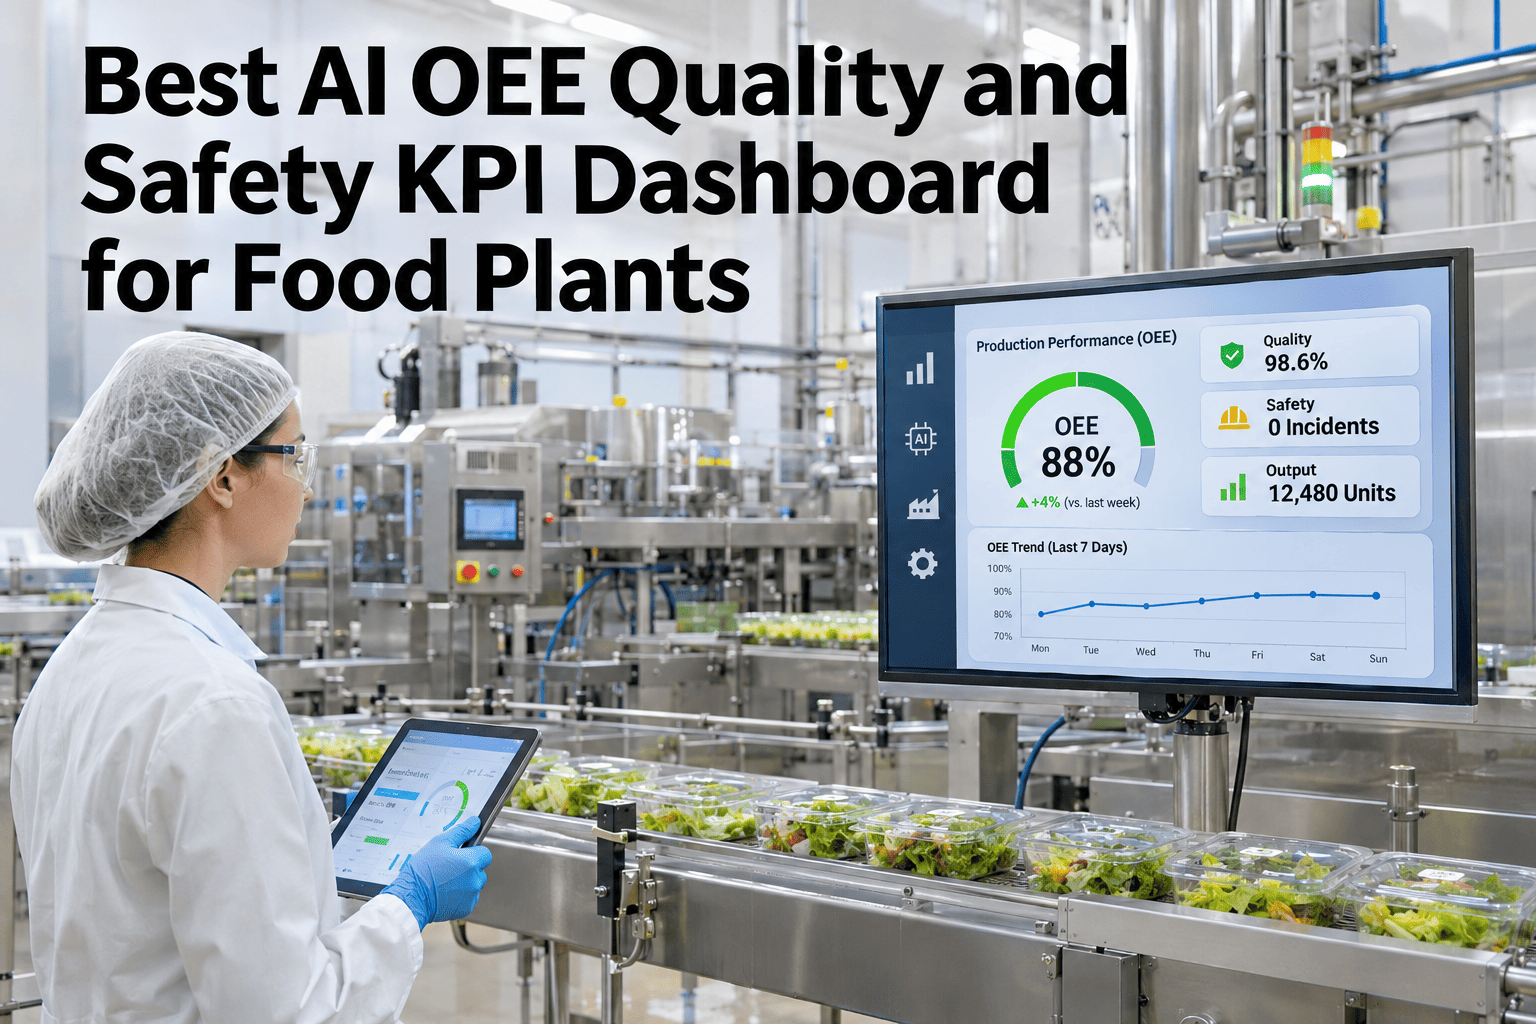
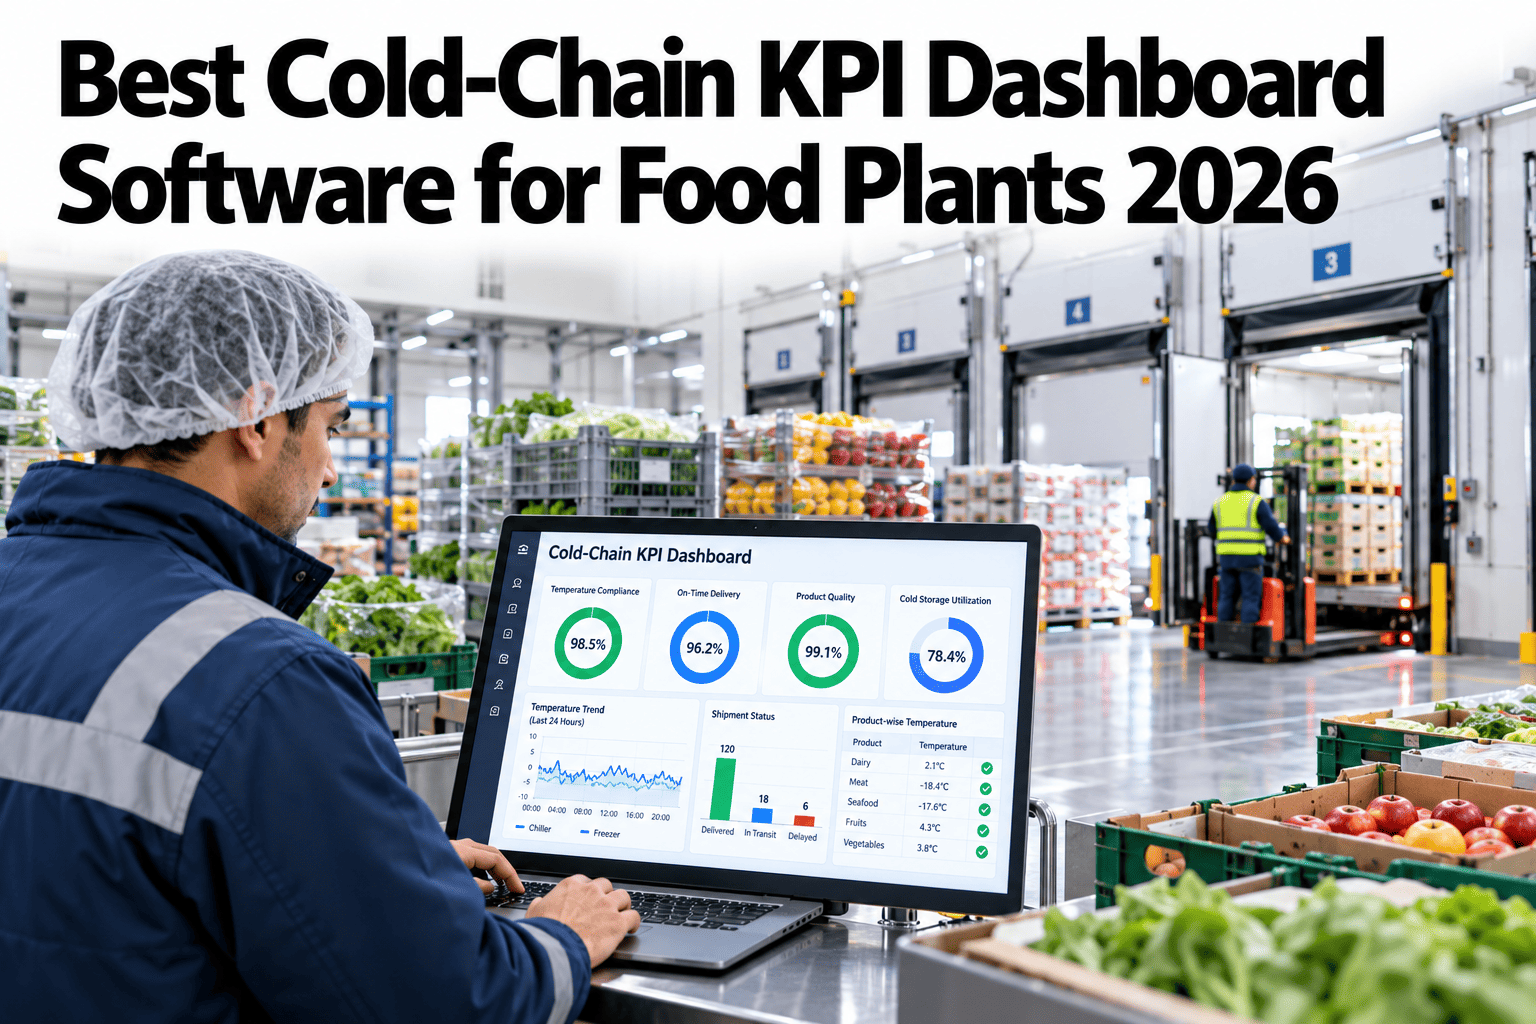
A QA team pulling a random batch for a lab check is making an educated guess about where risk actually sits. iFactory, an on-premise AI platform with automated analytics reporting built in, scores every batch live against twelve quality indicators, so a QA team can see exactly which batch needs attention without guessing. Food plant quality teams who want this on their own production can request a demo with our team.
AI Quality Score Dashboard · Food Plants, 2026
Twelve Indicators, One Live Score, No Guessing Which Batch to Pull
iFactory AI scores every batch continuously across twelve quality indicators, so the batch most worth a closer look is always visible, not buried in a random sampling plan.
TemppHFill wtColorMoistureViscosity
Why random sampling misses batches
A Sampling Plan Pulls Batches on a Schedule, Not on Risk
Standard lot-acceptance sampling pulls a fixed number of units on a fixed interval, regardless of whether a particular batch actually showed any unusual process behavior. A live quality score inverts that logic — instead of sampling on a schedule, attention goes to the batch the data itself says is most worth checking.
What goes into the score
Twelve Indicators Behind One Number
Process parameters
Temperature, pressure, speed, and other in-process variables measured continuously.
Physical measurements
Fill weight, dimension, and other direct product measurements taken on the line.
Chemical and sensory
pH, Brix, viscosity, color, and moisture content where measured in-line or at-line.
Vision inspection results
Defect rates and appearance scoring from any AI vision inspection already running on the line.
How indicators combine into a score
Not a Simple Average
| Approach | What it does | Limitation |
|---|
| Simple average | Treats every indicator as equally important | A critical indicator can be masked by several minor ones looking fine |
| Weighted average | Gives more weight to indicators most tied to known quality outcomes | Fixed weights may not reflect which indicator matters most for a given SKU |
| Correlation-aware scoring | Accounts for how indicators relate to each other, not just their individual values | Requires enough historical data to learn the real relationships |
See What a Live Score Would Show on Your Recent Batches
Share your available process and quality data, and iFactory AI will show what a twelve-indicator score would have flagged across your recent production.
From score to action
Four Steps From a Low Score to a Decision
1
Score drops on a batch
A batch's live score falls below the threshold that typically warrants attention.
2
Driving indicators surface
The dashboard shows which of the twelve indicators pulled the score down.
3
QA pulls that specific batch
A targeted lab check replaces a scheduled random pull, focused on the actual risk.
4
Result closes the loop
The lab result confirms or adjusts how much weight that indicator should carry going forward.
Does this replace lab testing?
The Score Directs Testing, It Doesn't Replace It
A live quality score is a prioritization tool, not a substitute for confirmatory lab testing where that testing is required by specification or regulation. What changes is which batch gets the limited lab testing capacity a plant actually has — directed at genuine risk instead of spread evenly across every batch regardless of how it performed.
Expert review
What a QA Director Checks First
A quality score dashboard earns trust when a low score reliably correlates with a real lab-confirmed issue, not just a process parameter that wandered without actually affecting the product.
Verdict
Strong when the twelve indicators are specific to what actually drives quality outcomes on this plant's own products, not a generic template.
Watch for
A score that moves without a clear, traceable reason — opacity undermines trust faster than almost anything else in a quality tool.
Do next
List the data sources already available on your line and check how many of them are currently reviewed together versus scattered across separate reports.
Frequently asked questions
What QA Teams Ask About the Quality Score Dashboard
Why twelve indicators specifically?
Twelve is a common starting point that covers process, physical, chemical, and vision-derived indicators without becoming unmanageable — the exact number and which indicators are included is tailored to what's actually measured on a given line.
Discuss the right indicator set for your plant.
Can this replace our lot-acceptance sampling plan entirely?
What score threshold should trigger a closer look?
The threshold is typically calibrated against historical lab results, so it reflects the score level that has actually correlated with real quality issues on this specific line rather than an arbitrary cutoff.
Discuss threshold calibration for your products.
Does every indicator need an automated sensor, or can some be manual entries?
Both work — automated sensor data feeds the score continuously, while manually entered lab or inspection results can still be incorporated, though with less frequent update timing than a continuous sensor feed.
Ask support about mixed data source setup.
How does this connect to our existing QA reporting for audits?
The underlying indicator data and score history for every batch is retained and retrievable, giving an auditor a documented, batch-level quality record rather than just a pass or fail summary.
Talk through audit-readiness for your plant.
Know which batch to check, not just how many to sample
Score Every Batch Live Across Twelve Quality Indicators
Book a demo to see how iFactory AI turns scattered quality data into one live score per batch for your plant.