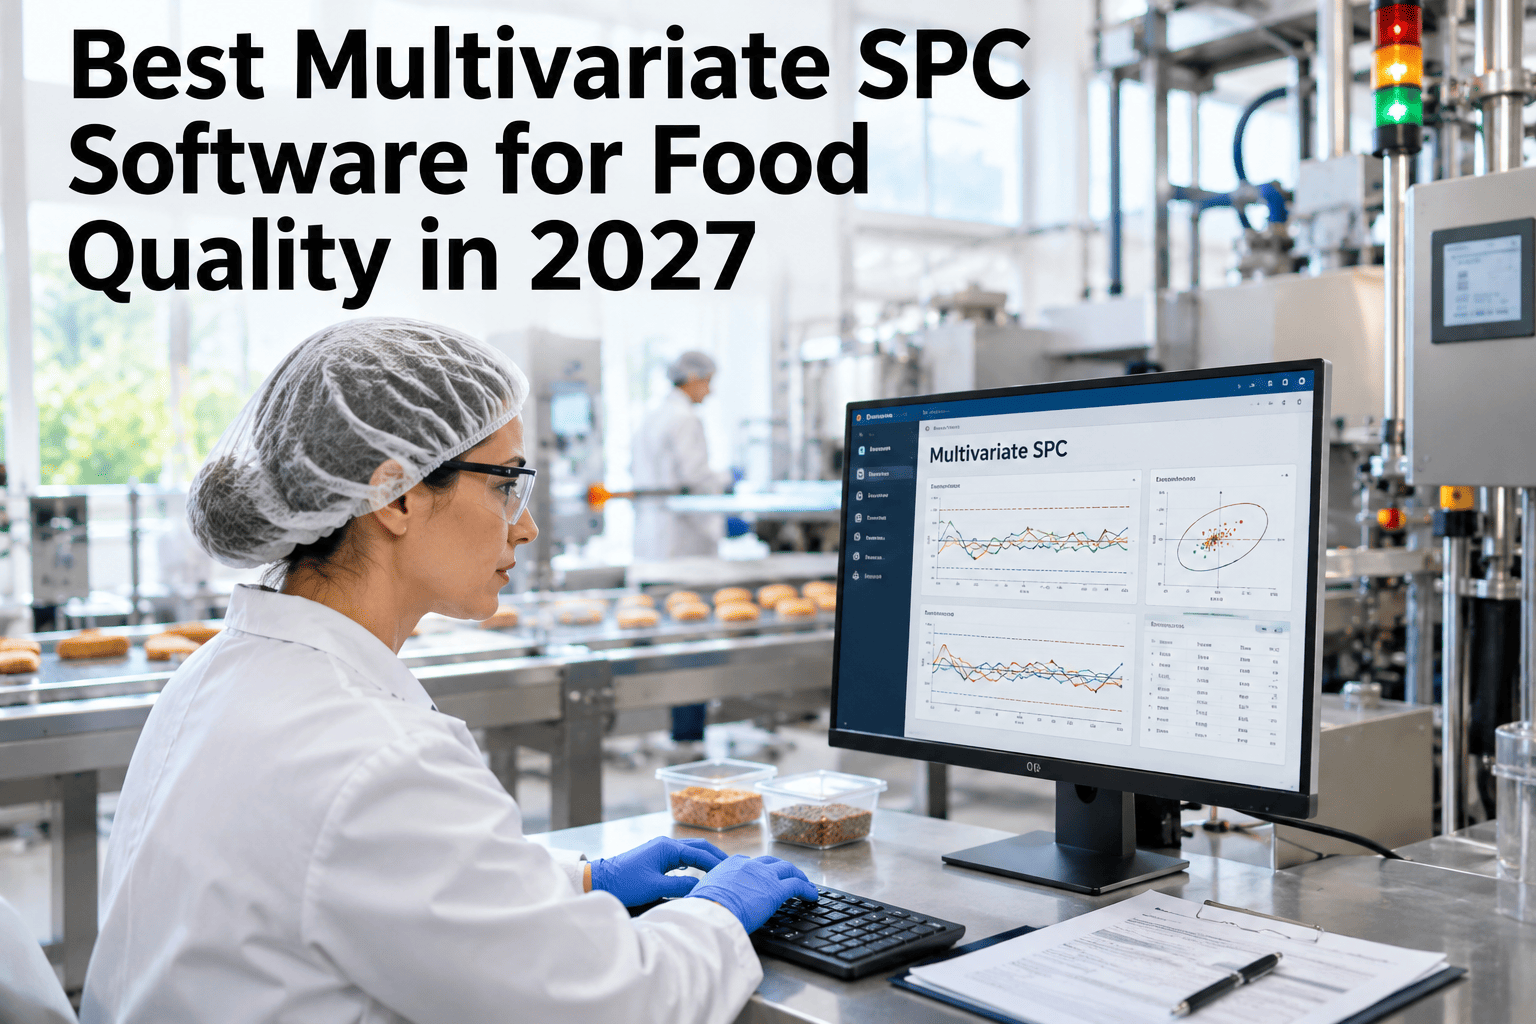
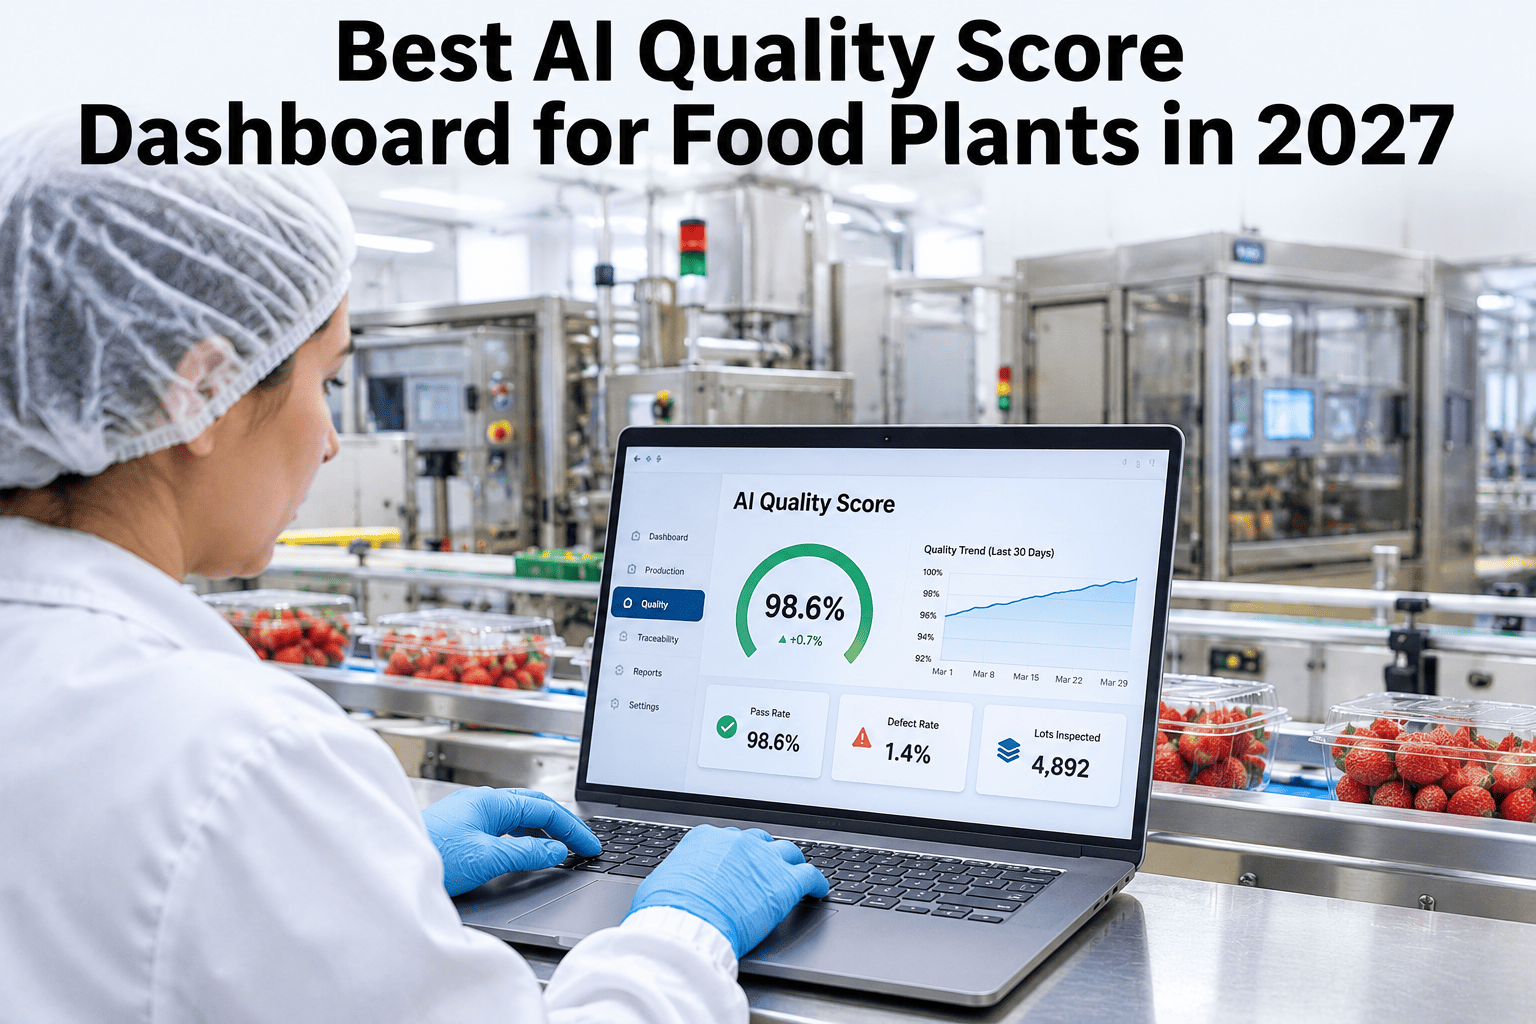
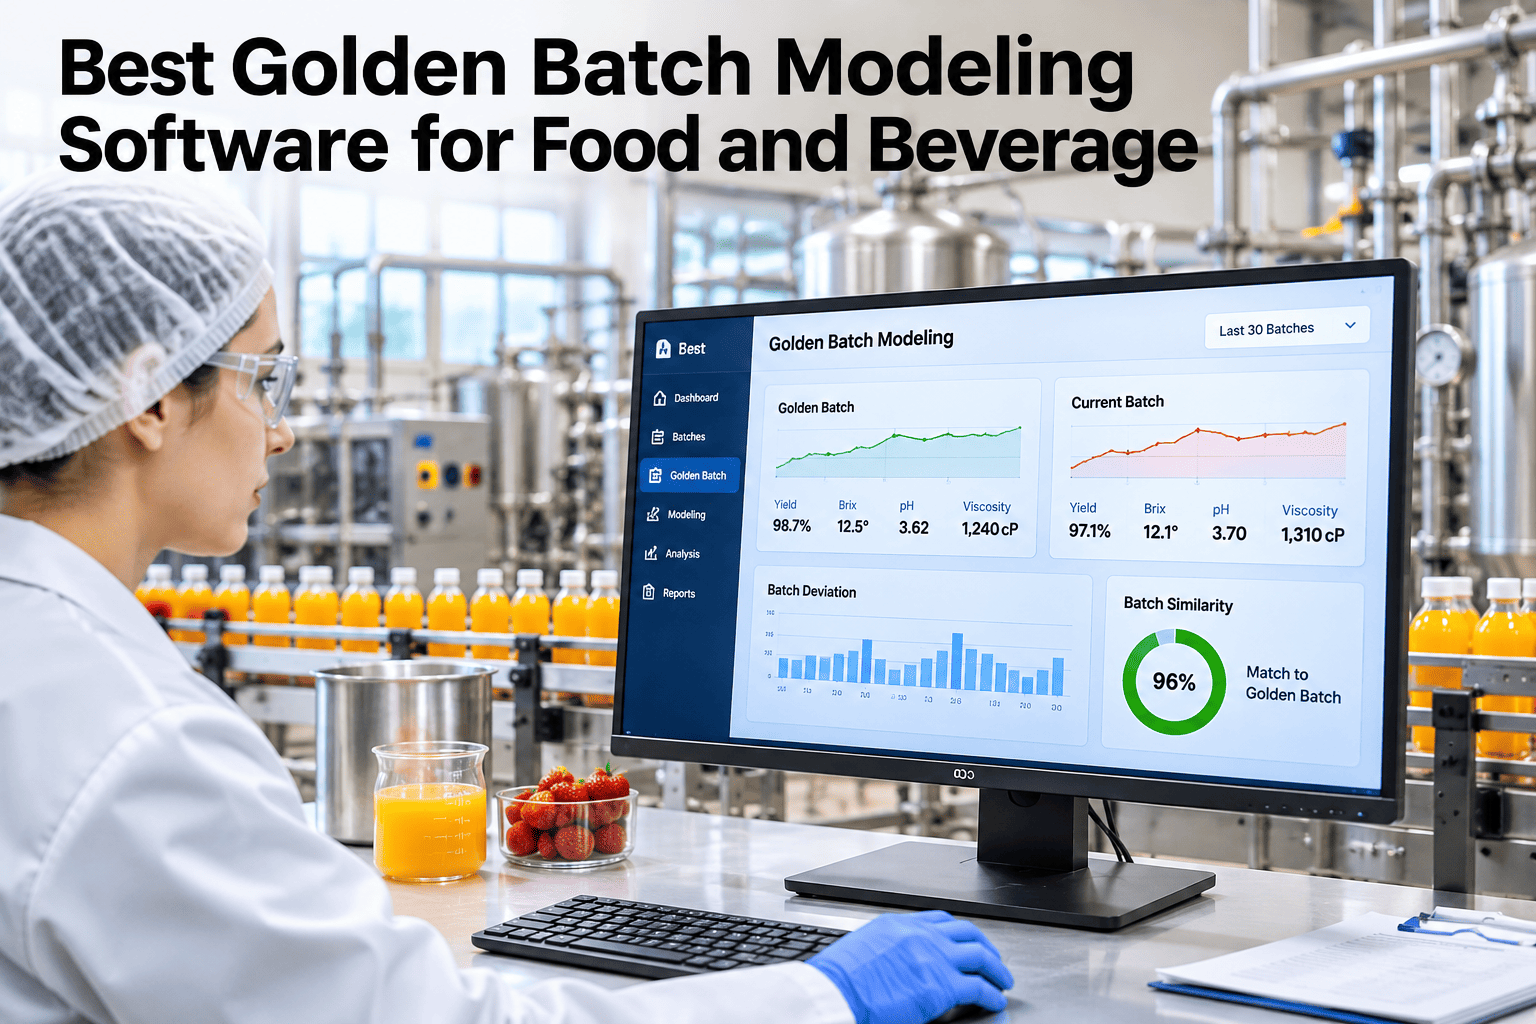
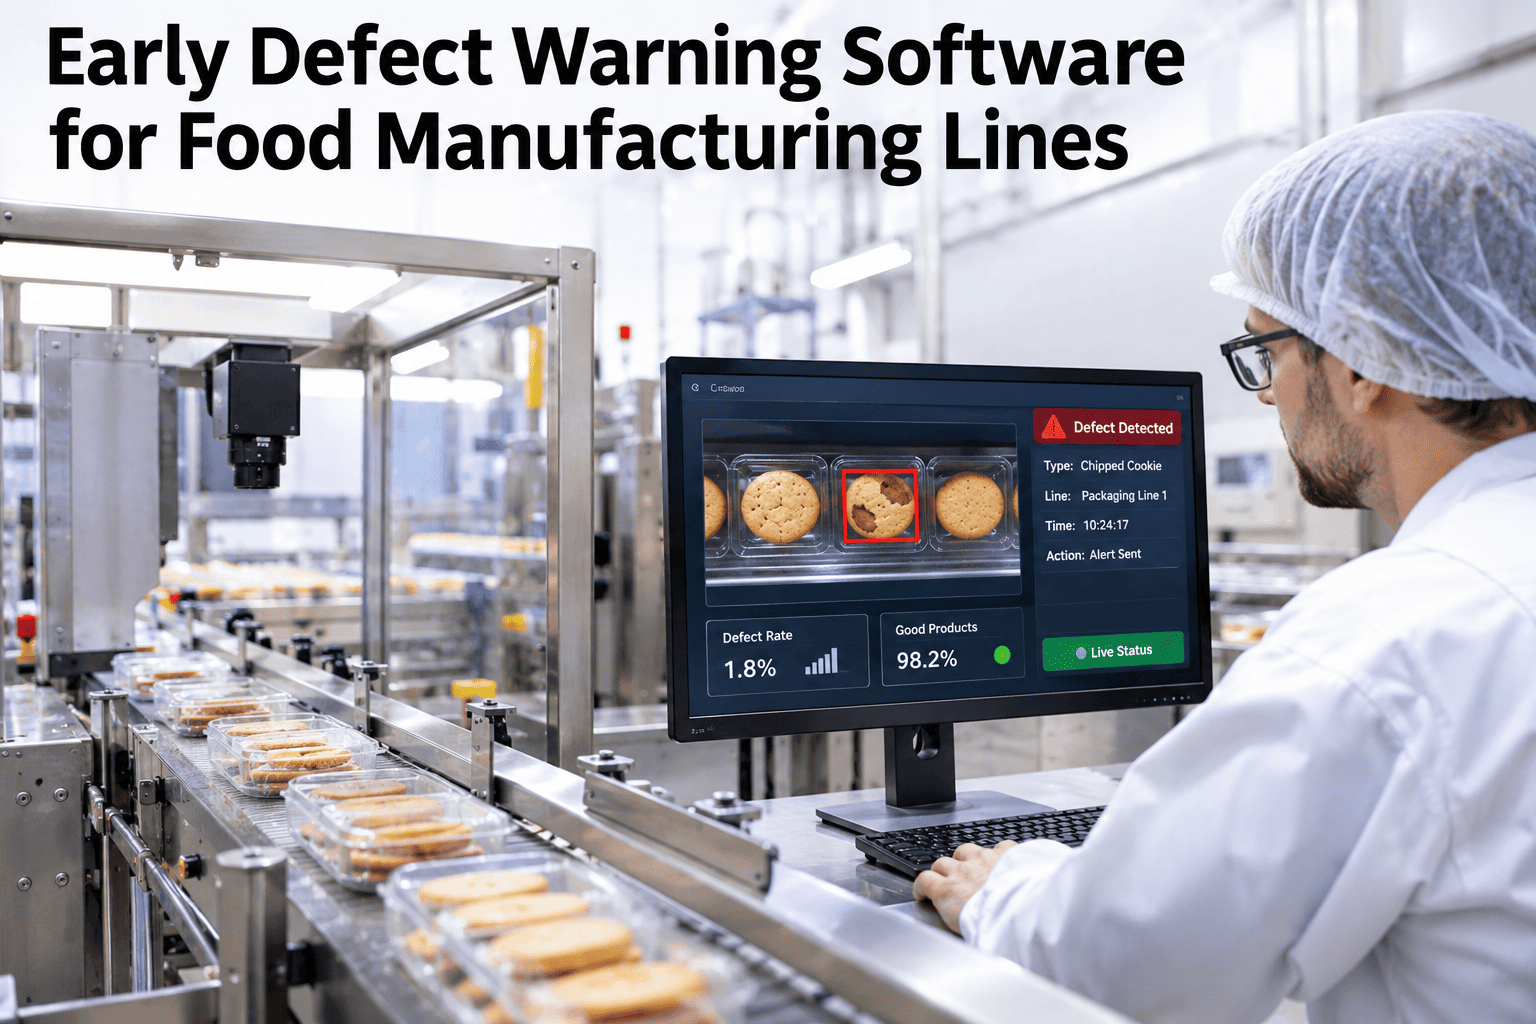
Hotelling's T-squared, developed in 1931 and still the standard tool for multivariate process monitoring, reads a process's correlated variables as one statistic instead of a wall of separate charts. iFactory, an on-premise AI platform with automated analytics reporting built in, applies T-squared and PCA-based monitoring across your correlated food quality parameters. Food quality teams who want this on their own process data can request a demo with our team.
Multivariate SPC for Food Quality · 2026
One Combined Statistic Instead of a Wall of Separate Charts
iFactory AI applies Hotelling T-squared and PCA-based monitoring to read correlated quality parameters as a single process state, catching what a chart-by-chart review misses.
pH
Brix
Visc.
Temp
Color
Fill wt
Pressure
Moist.
↓ collapses to ↓
One T² Statistic
The method behind it
What Hotelling T² and PCA Actually Do
Hotelling's T-squared is the multivariate extension of a standard x-bar chart — instead of tracking one variable against its own mean, it measures how far a full set of readings sits from the normal combined pattern, accounting for how the variables correlate with each other. Principal component analysis adds a second layer: it reduces many correlated parameters into a smaller set of components, then monitors both the T² statistic within that reduced space and a separate residual statistic, often called SPE or Q-residuals, that catches patterns the model itself didn't expect.
Two statistics, two questions
T² and SPE Answer Different Questions
| Statistic | What it answers | What it misses on its own |
|---|
| Hotelling T² | Is the process mean within its normal correlated pattern? | A process that stays centered but becomes erratic |
| SPE / Q-residual | Does the current reading fit the model's known correlation structure at all? | A shift that stays within the known structure but moves off-center |
Where this applies in food quality
Four Parameter Groups Where Correlation Matters Most
Fill and weight control
Fill weight, line speed, and pressure often move together under a single root cause.
Chemical consistency
pH, Brix, and viscosity are frequently correlated through the same formulation or process step.
Thermal processing
Temperature, time, and pressure together determine whether a thermal process target was actually met.
Sensory and visual
Color, texture, and moisture often shift together when an upstream ingredient or process condition changes.
See What a Combined Statistic Reveals in Your Own Parameter Data
Share a sample of your correlated quality parameters and iFactory AI will show what T² and SPE monitoring reveals that individual charts do not.
Interpreting a flag
Four Steps From a T² Alert to a Root Cause
1
T² or SPE exceeds its limit
The combined statistic crosses its calculated control limit on a new reading.
2
Contribution plot generated
A breakdown shows which individual variables contributed most to the flagged deviation.
3
Investigation narrows
Engineering focuses on the specific process area tied to the top-contributing variables.
4
Correction confirmed
The statistic returning inside its control limit confirms the fix addressed the right cause.
Setting up the model
What a Phase I Baseline Requires
Like any SPC approach, multivariate monitoring needs a Phase I baseline — a period of confirmed in-control production used to establish the normal correlation structure and calculate control limits. The quality of that baseline period directly determines how reliable every future T² and SPE reading will be, which is why most deployments spend real time validating the baseline before going live.
Expert review
What a Process Quality Engineer Checks First
Multivariate SPC earns trust when a flagged alert comes with a clear contribution breakdown, not just a single abstract statistic with no path back to a specific cause.
Verdict
Strong when both T² and SPE are monitored together, since they catch genuinely different kinds of process shifts.
Watch for
A Phase I baseline built on a shorter or less representative period than the process's real operating variation.
Do next
List your correlated quality parameters and check whether they're currently reviewed together on one chart or still scattered across separate single-variable reports.
Frequently asked questions
What Food Quality Teams Ask About Multivariate SPC
How is this different from just watching several SPC charts side by side?
Watching separate charts still treats each variable independently — Hotelling T² explicitly accounts for how variables correlate, so it can flag a combined shift that stays within every individual chart's own control limits.
See this applied to your own correlated parameters.
How many parameters can realistically be monitored together?
PCA-based approaches are specifically designed to handle dozens of correlated parameters by reducing them to a smaller set of components, so the practical limit is usually about data quality and process relevance rather than parameter count.
Discuss your current parameter set.
What does a contribution plot actually show when an alert fires?
It breaks down how much each individual variable contributed to the combined statistic exceeding its limit, which is what narrows a multivariate alert down to a specific, investigable cause.
Ask about contribution analysis for your process.
Does a recipe or SKU change require rebuilding the model?
A genuine change in correlation structure between parameters, which often follows a recipe or significant process change, generally warrants revisiting the Phase I baseline rather than continuing to use an outdated correlation model.
Ask support about model maintenance after a change.
Is this only useful for continuous processes or does it work for batch too?
Both — the batch variant, often called unfold-PCA, extends the same T² and SPE logic to full batch trajectories, which is the same underlying approach behind golden batch modeling.
Talk through batch versus continuous setup.
See the process as one statistic, not a wall of charts
Apply Hotelling T² and PCA to Your Correlated Quality Data
Book a demo to see how iFactory AI reads your correlated food quality parameters as a single combined signal.