Food & beverage operators carry a peculiar burden in modern manufacturing — they're expected to deliver pharmaceutical-grade quality consistency on consumer-product economics, with sanitation and allergen requirements that no other industry shares, batch-to-batch variability that traditional SPC can't model cleanly, and customer scorecards from major retailers that punish any slip in OEE. The legacy quality-intelligence stack — SAP MII / xMII reports, threshold-based control charts, manual root-cause investigation, weekly OEE reviews — was built for a different operational era. Today's F&B operators need something fundamentally different: predictive OEE that anticipates the next 4–24 hours of operation, self-learning quality systems that continuously refine their understanding of what "good" looks like for the current product/shift/material lot combination, and quality intelligence that's reimagined around how operators actually work rather than how legacy MES platforms organize data. iFactory AI delivers this on a pre-configured NVIDIA appliance running on-premise inside the plant — replacing SAP MII, SAP xMII, and SAP DMC with an AI-native platform purpose-built for the demands of modern food & beverage operations, live in 6–12 weeks. This page is the F&B operator's guide to reimagining quality intelligence with predictive OEE, what self-learning quality systems actually do for daily operations, and how the on-prem alternative to cloud-locked MES delivers better operational outcomes for less total cost.
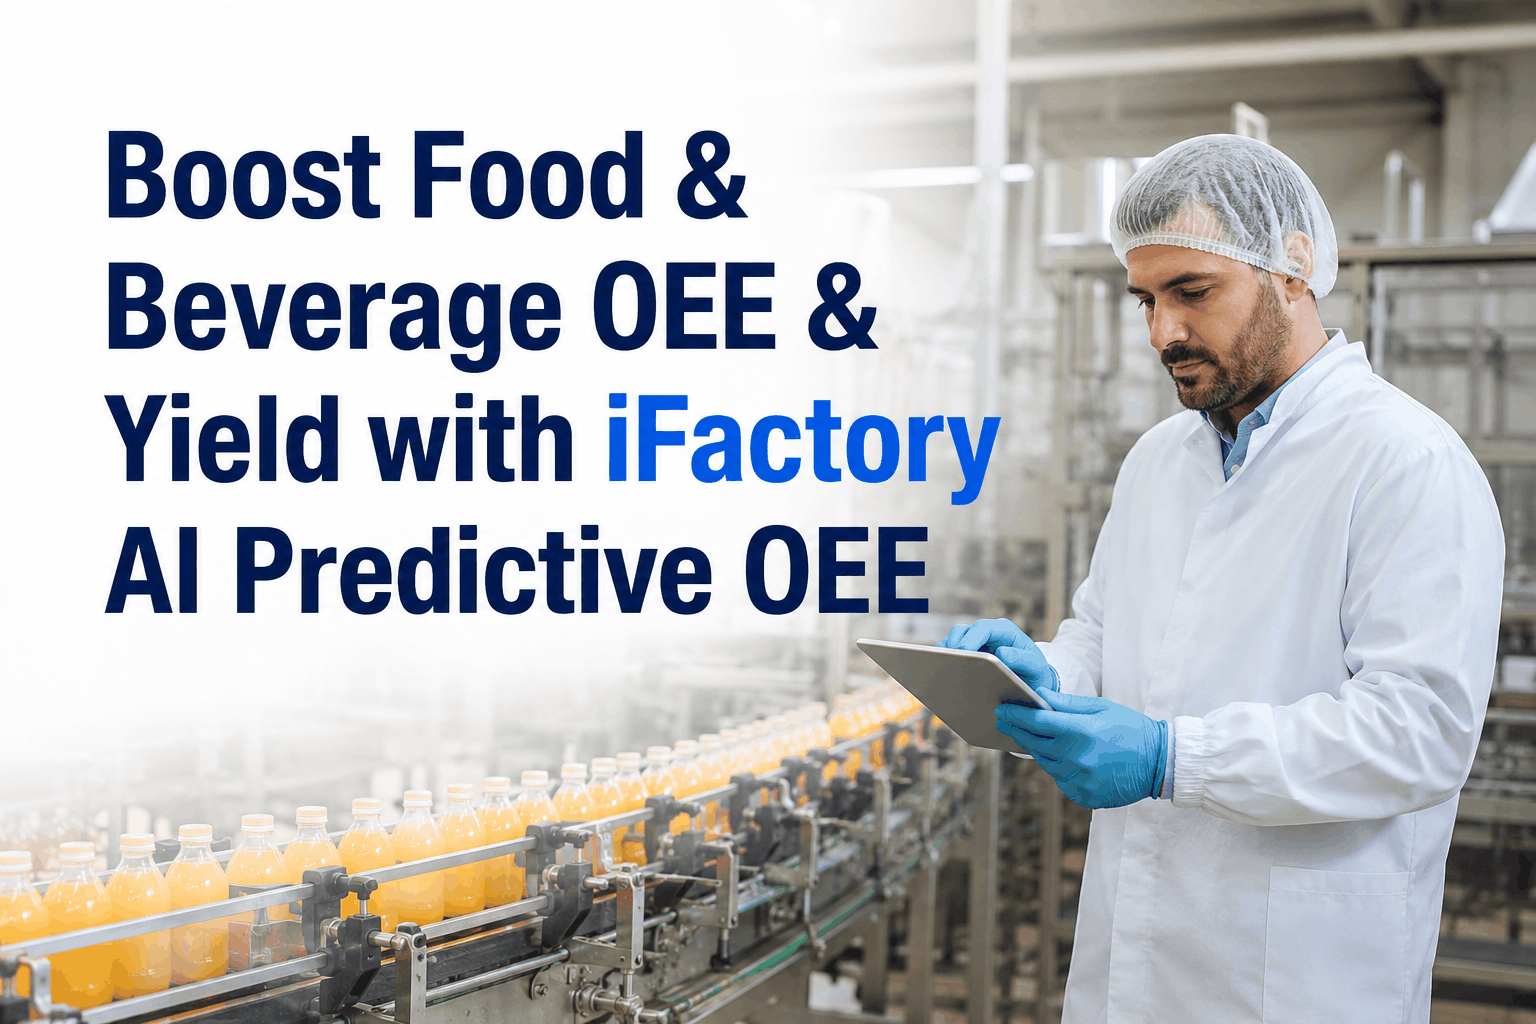
Boost Food & Beverage OEE & Yield with iFactory AI Predictive OEE
The F&B operator's guide to predictive OEE and self-learning quality systems — anticipating downtime 4–24 hours ahead · adaptive limits per product, shift, and material lot · live OEE dashboard with proactive recommendations. AI-native platform that beats SAP MII on speed, cost, and accuracy. Pre-configured NVIDIA appliance, live in 6–12 weeks.
OEE in Food & Beverage — Why the Three Factors Behave Differently
OEE breaks into the same three factors across every manufacturing industry — Availability, Performance, and Quality — but the underlying behavior of those factors differs significantly in F&B operations. Sanitation cycles dominate Availability in ways that don't exist in other industries. Performance is constrained by product changeovers and allergen segregation. Quality has uniquely tight tolerances on visual appearance, label accuracy, and code legibility that demand visual AI rather than parameter-only SPC. The breakdown below shows what's actually driving F&B OEE — and which AI capability addresses each component.
The combined OEE gain across all three factors typically lands in the +12–22% range within 12 months for F&B operations migrating from legacy SAP MII / xMII / DMC to iFactory's AI-native platform. For a typical mid-size F&B plant running 4–8 lines with 70% baseline OEE, that translates to recovering 1,800–3,200 production hours annually — at typical line value rates, $4M–$9M in throughput recovery before counting reduced quality cost and reduced overtime.
Want a sized OEE-gain projection for your specific F&B operation? Schedule the AI Manufacturing Transformation Workshop — iFactory's F&B team will assess your current OEE baseline, three-factor breakdown, and projected gains across Availability, Performance, and Quality. Sessions available this week.
Self-Learning Quality Systems — What "Reimagined" Actually Means
"Self-learning quality systems" sounds like a marketing phrase, and used carelessly it would be. In iFactory's platform it refers to a specific technical architecture — multivariate models that continuously refine their understanding of process behavior using current operational data, without requiring manual tuning, threshold updates, or limit recalibration by quality engineering. The system gets better at distinguishing real drift from normal variation as it accumulates more operational experience. The architecture diagram below shows what this actually looks like.
Three feedback loops drive continuous improvement. Loop 1 compares each prediction to the actual outcome — did the predicted excursion materialize, did the recommended intervention work, did the AI Vision classification match what the operator saw. Loop 2 captures domain expertise — when operators override or correct AI recommendations, that judgment becomes training signal. Loop 3 is internal model retraining on accumulated operational data. Together they produce the "self-learning" property that legacy rule-based SQC fundamentally cannot replicate.
Want to see self-learning quality systems running on representative F&B scenarios? Schedule the AI Manufacturing Transformation Workshop — sessions include live demonstration of the three feedback loops in action on your representative dairy, bakery, snack, beverage, or frozen processes. Sessions available this week.
Three Migration Paths from SAP MII / DMC for F&B
Stay on MII / xMII
Extended maintenance with legacy paradigm continuing. No predictive OEE, no self-learning. Operator workflow unchanged from current state.
SAP DMC (Cloud-Only)
Cloud migration with descriptive analytics improvement but no genuine self-learning or predictive OEE capability. Cloud lock-in concern for F&B operations.
iFactory AI On-Prem
Self-learning quality systems with predictive OEE. Adaptive limits, AI Vision, autonomous RCA. No cloud lock-in. HACCP/FSMA aligned.
Live Predictive OEE — What F&B Operators Actually See
The operator's view after migration
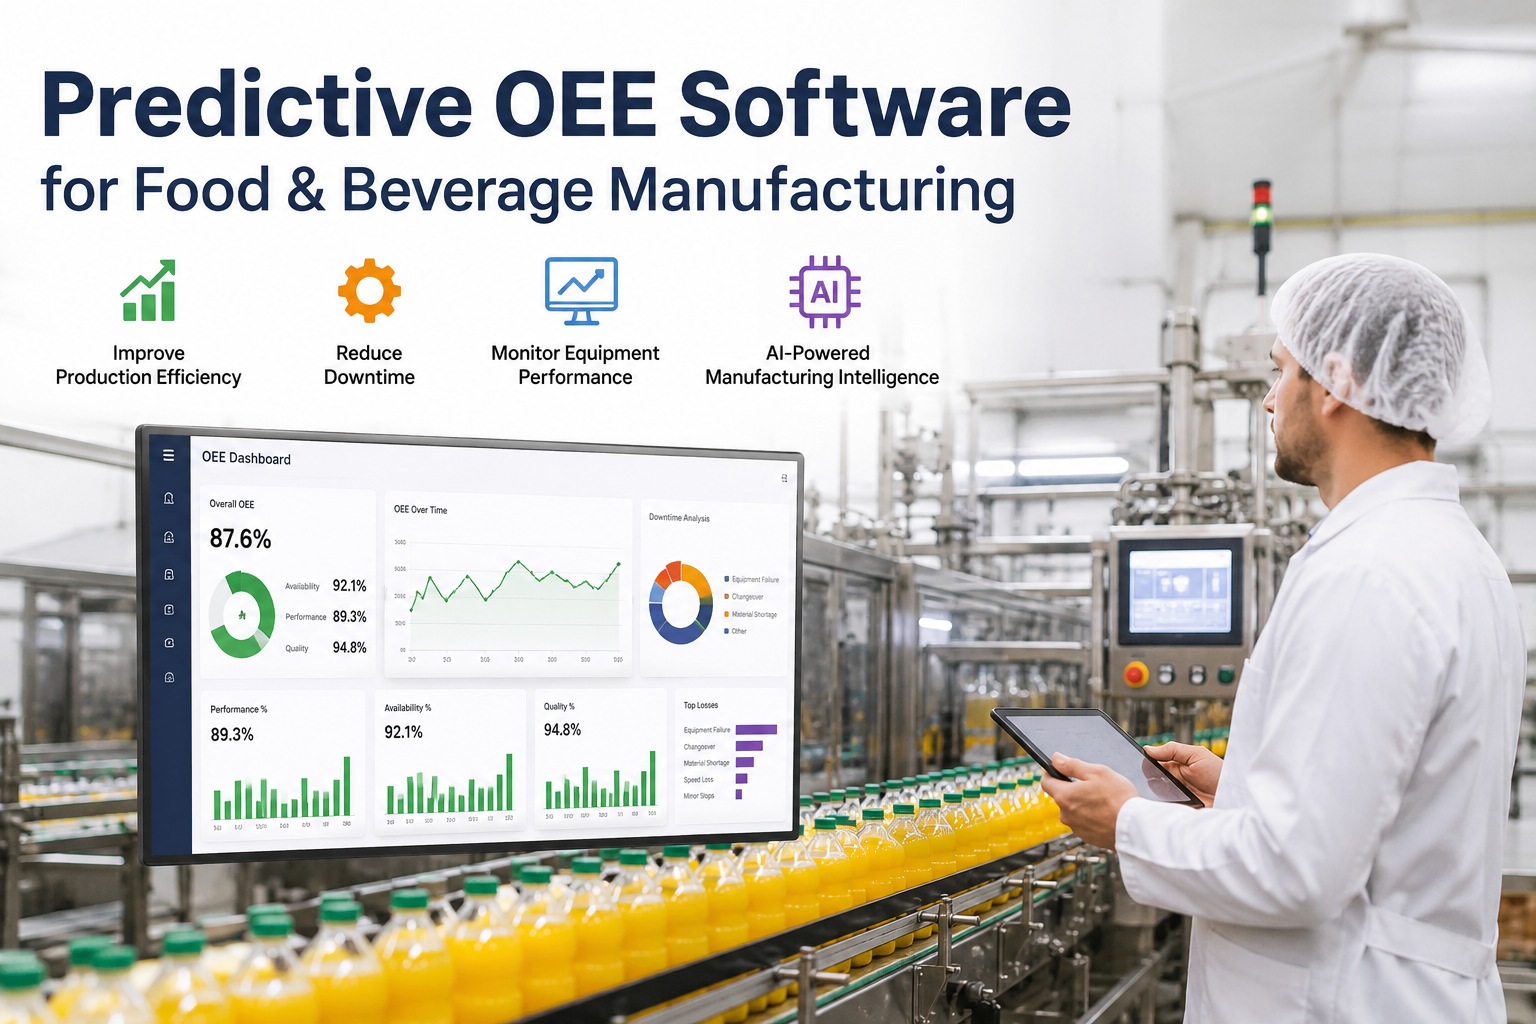
The operator workstation displays live OEE with predictive alerts, self-learning model status, and recommended actions for the upcoming shift. The interface is reimagined around how operators actually work — clear current state, focused predictions, actionable recommendations — rather than around how legacy MES platforms organize data.
Six F&B Operations Where Predictive OEE Pays Back Fastest
High-Speed Beverage Filling
Predictive OEE on filler heads, capping, labeling, and case packing. AI Vision verifies fill levels, cap presence, and label accuracy at line speed.
Dairy Processing
Adaptive limits on temperature profiles, pH, microbial signatures. CIP optimization reduces sanitation cycles by 15–25%. Allergen segregation predictive.
Snack & CPG Manufacturing
AI Vision catches cosmetic defects, color variation, broken pieces. Predictive OEE on extrusion, baking, packaging. Multi-SKU OEE optimization.
Frozen Foods
Predictive OEE across IQF tunnel performance, packaging speed, and freezer condition. Energy optimization. Self-learning quality on visual standards.
Bakery Operations
Predictive OEE on mixing, proofing, baking, cooling. AI Vision verifies finished product appearance, size, color. Recipe-aware self-learning models.
Meat & Poultry Processing
Predictive OEE on cutting lines, weighing, packaging. AI Vision catches product appearance, packaging integrity. Cold chain compliance monitoring.
Want application-specific OEE projections for your F&B operation? Send your F&B segment, line configurations, and current OEE baseline to iFactory support and the F&B team will return a customised OEE projection with 12-month roadmap — typically within 3 business days, no obligation.
HACCP, FSMA, SQF & Allergen Compliance — Built In
Pre-built workflows for food & beverage regulatory frameworks
- HACCP — Hazard Analysis and Critical Control Points
- FSMA — Food Safety Modernization Act (FDA)
- SQF — Safe Quality Food certification
- BRC / GFSI — global food safety standards
- Allergen management — segregation and verification
- USDA — meat & poultry inspection support
- FDA 21 CFR Part 117 — preventive controls
- Lot traceability — full forward and backward chain
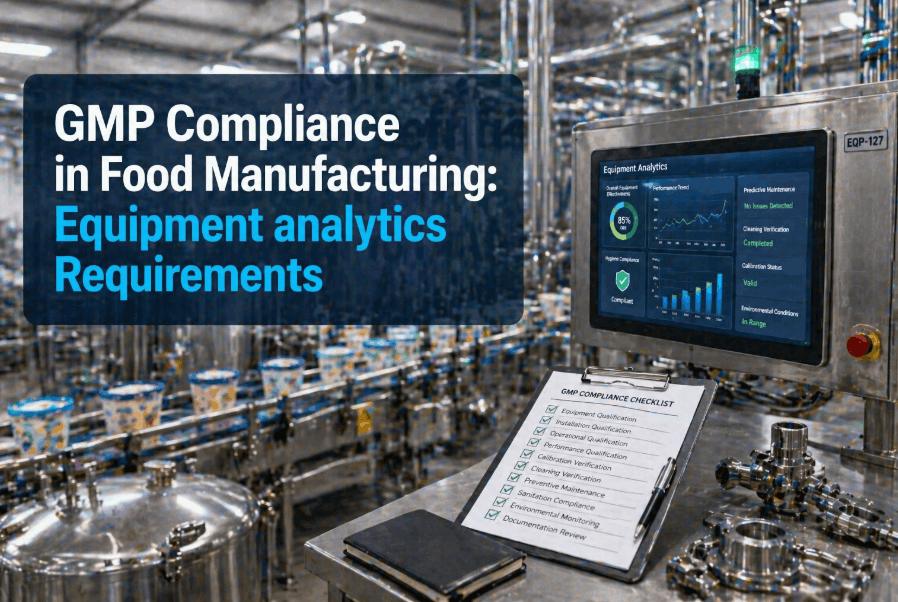
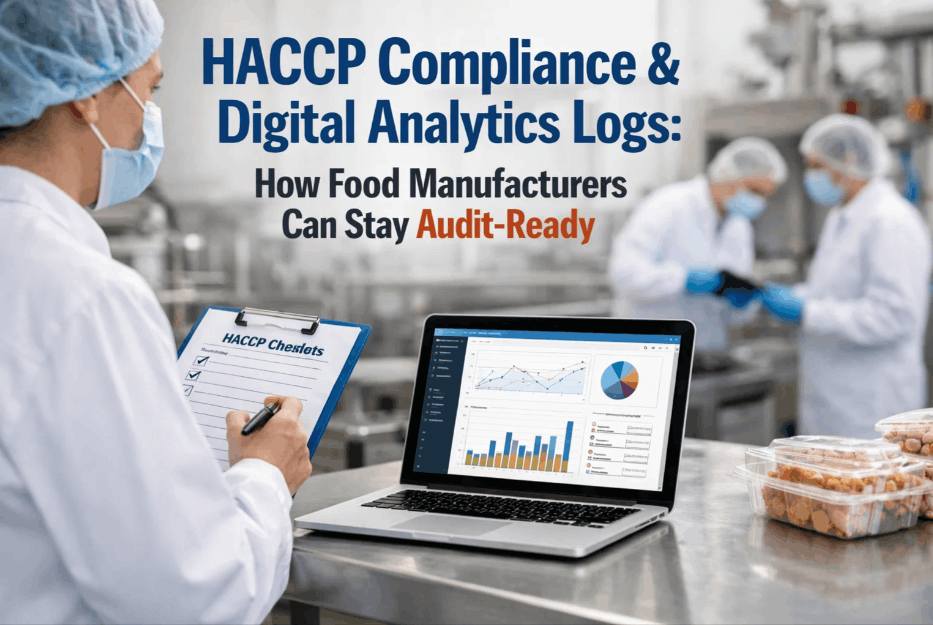
The Compliance Layer assembles HACCP records, FSMA preventive control evidence, and allergen verification data continuously as production runs. Customer audit prep (Walmart, Target, Costco, major chains) typically drops from 1–2 weeks of manual preparation to 2–4 hours of review. Lot traceability is automatic — forward to delivery, backward to raw materials, with sub-second query response across years of production data.
Two Real F&B Operator Outcomes
Mid-size dairy processor with 6 lines covering yogurt, milk, cream, and cheese categories
A mid-size dairy plant running 6 lines across yogurt, fluid milk, cream, and specialty cheese categories. OEE averaged 64% — well below 85% target. Changeovers between SKUs averaged 4.5 hours; CIP cycles consumed 28% of available time; quality holds occurred 8–12 per shift. SAP MII captured operational data but couldn't predict OEE drag events or optimize CIP timing.
Frozen foods manufacturer with 4 high-volume IQF lines and chronic OEE drag from speed losses
A frozen prepared-meals manufacturer operating 4 IQF (individually quick frozen) tunnel lines plus secondary packaging. OEE averaged 71% with speed losses (minor stops, jam events, conveyor issues) being the largest contributor. Customer scorecards from major retail accounts were trending down due to inconsistent fill rates. SAP xMII reported the operational data but couldn't predict or prevent the speed-loss patterns.
Neither scenario matches your operation? Send your F&B segment, line configurations, and current OEE baseline to iFactory support and the F&B team will return a customised migration analysis with 12-month roadmap — typically within 3 business days, no obligation.
iFactory's F&B Deployment — On-Premise or Cloud
Same AI-native platform on either deployment model. Same predictive OEE, self-learning quality systems, AI Vision, and autonomous RCA. For F&B operations specifically, on-prem is strongly recommended due to high-speed line latency requirements and customer data sovereignty needs.
iFactory On-Premise Appliance Strong default for F&B plants · no cloud lock-in
- Pre-configured NVIDIA AI server — racked, software-loaded, ready to plug in.
- <50ms edge inference — keeps up with high-speed F&B lines.
- No cloud lock-in — recipes, vision models, predictions stay in plant.
- Works during WAN outages — production continues uninterrupted.
iFactory Cloud For multi-plant F&B operations with established cloud governance
- Fully managed — no rack, no facility requirements.
- Same self-learning stack — predictive OEE, AI Vision, autonomous RCA.
- Cross-plant OEE benchmarking across F&B operations.
- Fastest deployment — first plant live in 2–4 weeks.
Quality intelligence reimagined isn't a slogan. It's a measurable operational difference.
Predictive OEE with self-learning quality systems running on a pre-configured NVIDIA appliance turns F&B operations from reactive to proactive — 12–22% OEE improvement, 4–24 hour predictive warning windows, customer scorecards moving from yellow to green. The AI Manufacturing Transformation Workshop sizes the migration concretely for your specific F&B operation.
Frequently Asked Questions
How is "predictive OEE" different from descriptive OEE dashboards in legacy MES?
Descriptive OEE shows what already happened — yesterday's number, this morning's trend, last shift's losses. Predictive OEE shows what's about to happen — model output for the next 4–24 hours including specific anticipated events, projected impact on OEE, and recommended interventions. The shift from descriptive to predictive is the single most important capability difference between legacy MES OEE and AI-native OEE.
What exactly makes a quality system "self-learning"?
Three feedback paths working continuously — comparing predictions to actual outcomes (loop 1), capturing operator overrides and corrections as training signal (loop 2), and internal model retraining on accumulated operational data (loop 3). The system improves accuracy over time without quality engineering tuning, threshold updates, or limit recalibration. After 8–14 weeks of operation, accuracy typically reaches steady state and continues incremental improvement thereafter.
Does iFactory work with HACCP and FSMA already in place?
Yes — iFactory's Compliance Layer captures HACCP critical control point monitoring, FSMA preventive control evidence, allergen segregation verification, and lot traceability automatically as production runs. The existing HACCP plan and FSMA framework remain unchanged; iFactory provides the continuous evidence assembly and audit-trail layer. Customer audit prep (Walmart, Target, major retailers) typically drops dramatically.
How does the platform handle multi-SKU F&B operations with frequent changeovers?
Self-learning quality systems automatically adapt to each SKU's characteristics — adaptive control limits, vision models, RCA patterns. The platform learns each new SKU during initial production and continuously refines as more data accumulates. Changeover automation reduces manual setup time. Multi-SKU OEE benchmarking compares performance across product families to surface optimization opportunities.
Do I have to buy NVIDIA servers separately?
No. iFactory's on-premise appliance ships fully loaded — pre-configured NVIDIA AI server, software pre-installed, network gear, cabling, industrial cameras for line inspection, edge devices for line-side inference. You provide rack space, line power, Ethernet, and PLC integration points. The deployment team handles installation and configuration. For cloud, no hardware investment at all.
Can we deploy on one F&B line first before plant-wide?
Yes — and it's the recommended approach. Start with the line where OEE drag is highest or where downtime cost is most acute. Validate the predictive OEE accuracy and self-learning quality system performance on a single line. Then expand line-by-line in 2–4 week waves. Full plant deployment for a typical 4–8 line F&B operation completes in 3–5 months end-to-end.
What does the AI Manufacturing Transformation Workshop actually cover?
The half-day workshop covers — current-state SAP MII / xMII / DMC assessment, F&B OEE three-factor breakdown analysis specific to your operation, predictive OEE and self-learning quality systems demonstration on your representative products, three-path migration comparison with cost/timeline projections, deployment roadmap with milestone dates, ROI analysis on OEE gain. Outcome is a concrete migration plan. Suitable for operators, plant leadership, quality, IT, and finance representatives.
OEE is the F&B operator's daily metric. Predictive OEE makes it controllable.
Self-learning quality systems plus predictive OEE running on a pre-configured NVIDIA appliance — that's what "reimagining quality intelligence" actually means in operational terms. 12–22% OEE improvement typical within 12 months. No cloud lock-in. Live in 6–12 weeks. The AI Manufacturing Transformation Workshop is the fastest way to size the migration for your specific F&B operation — sessions available this week.