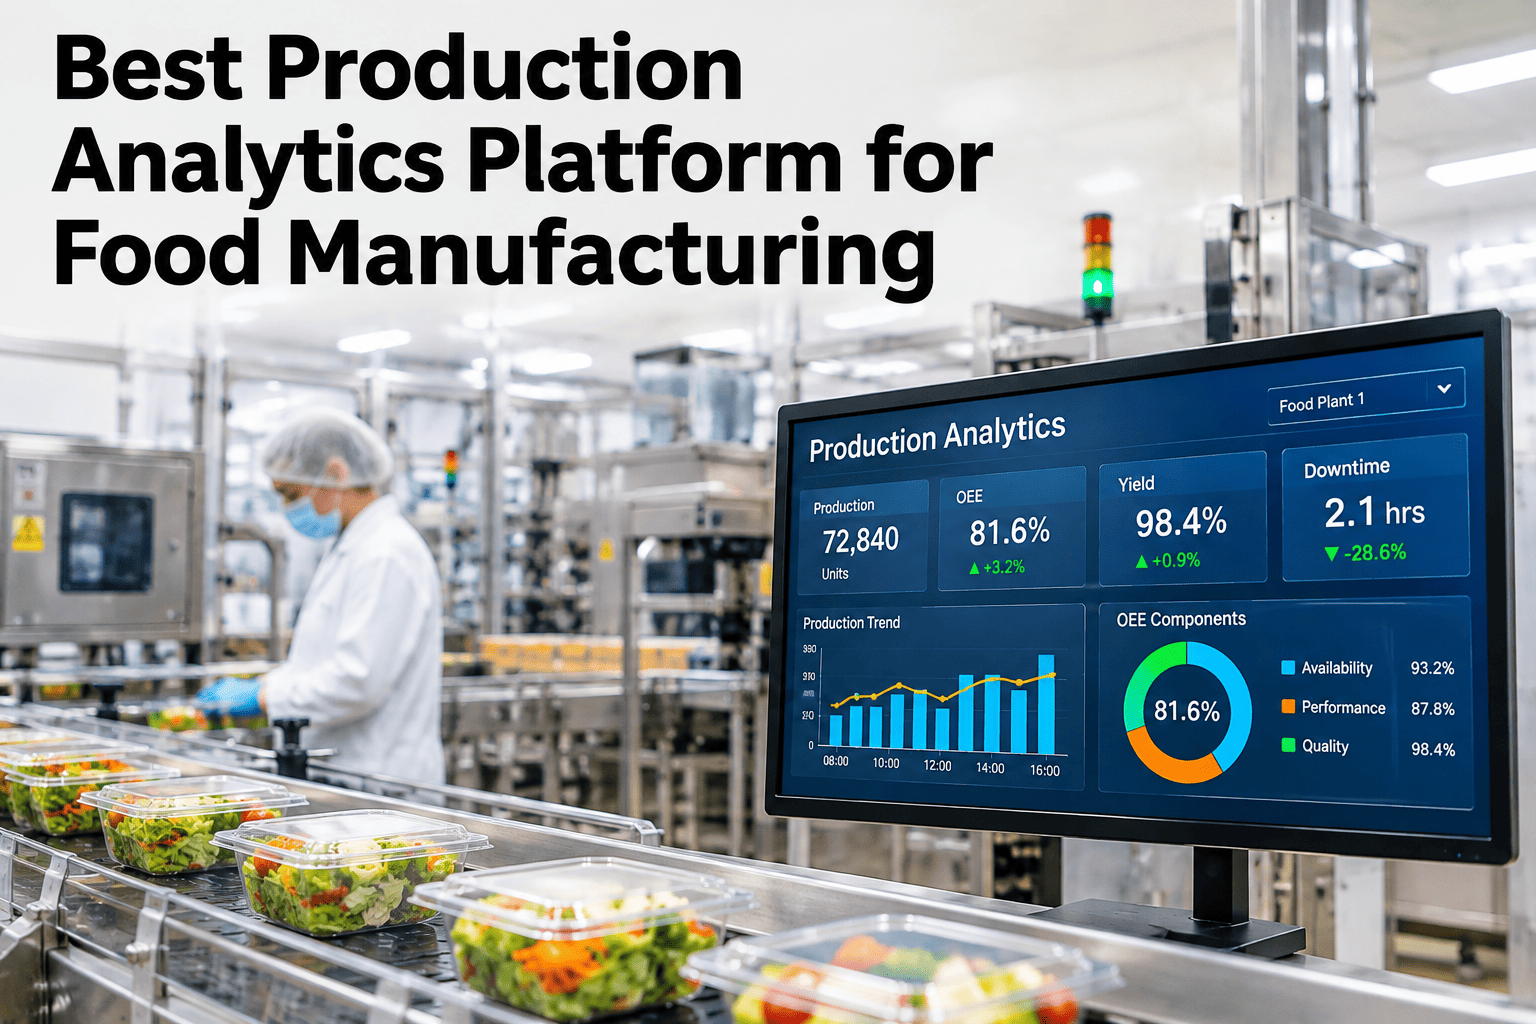
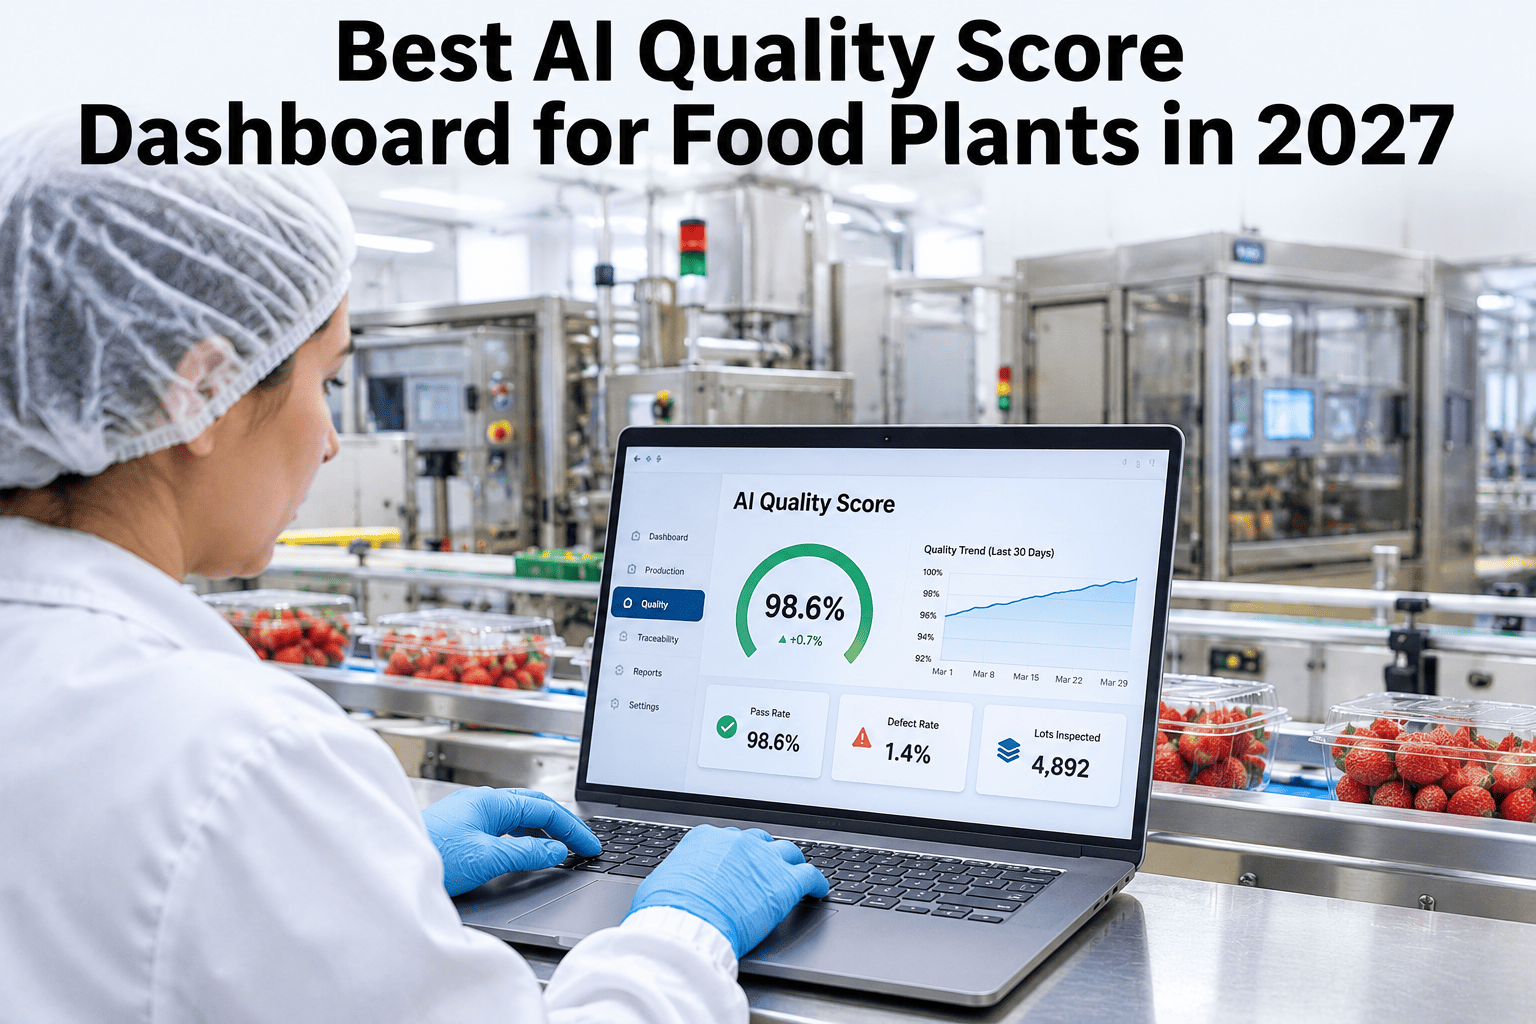
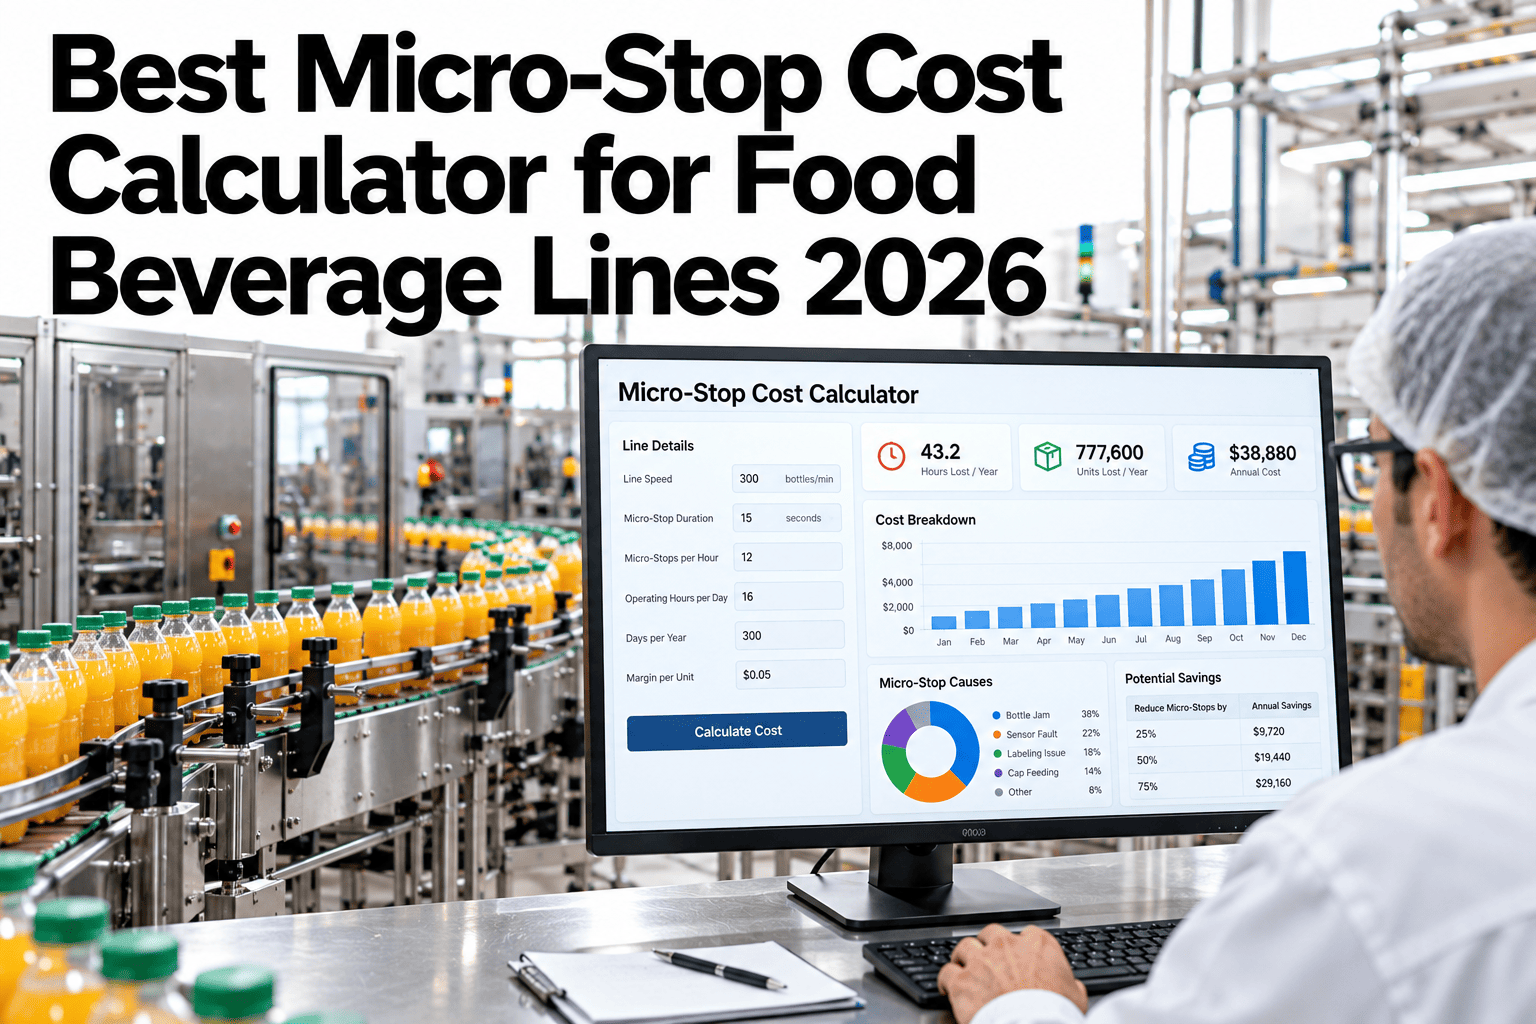
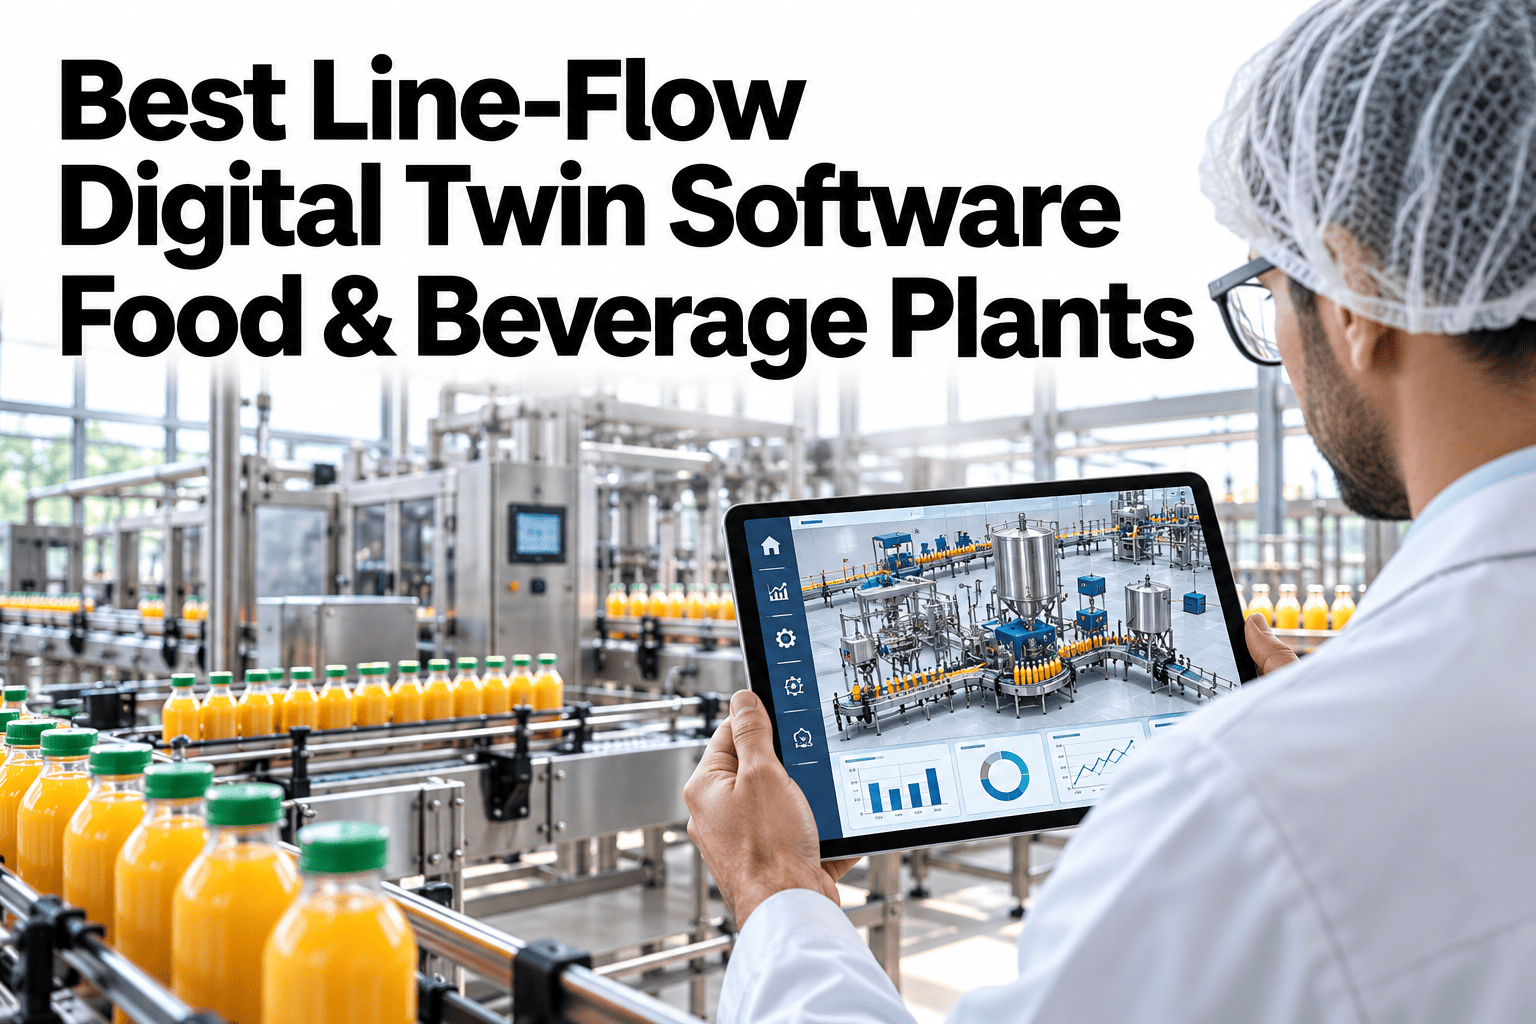
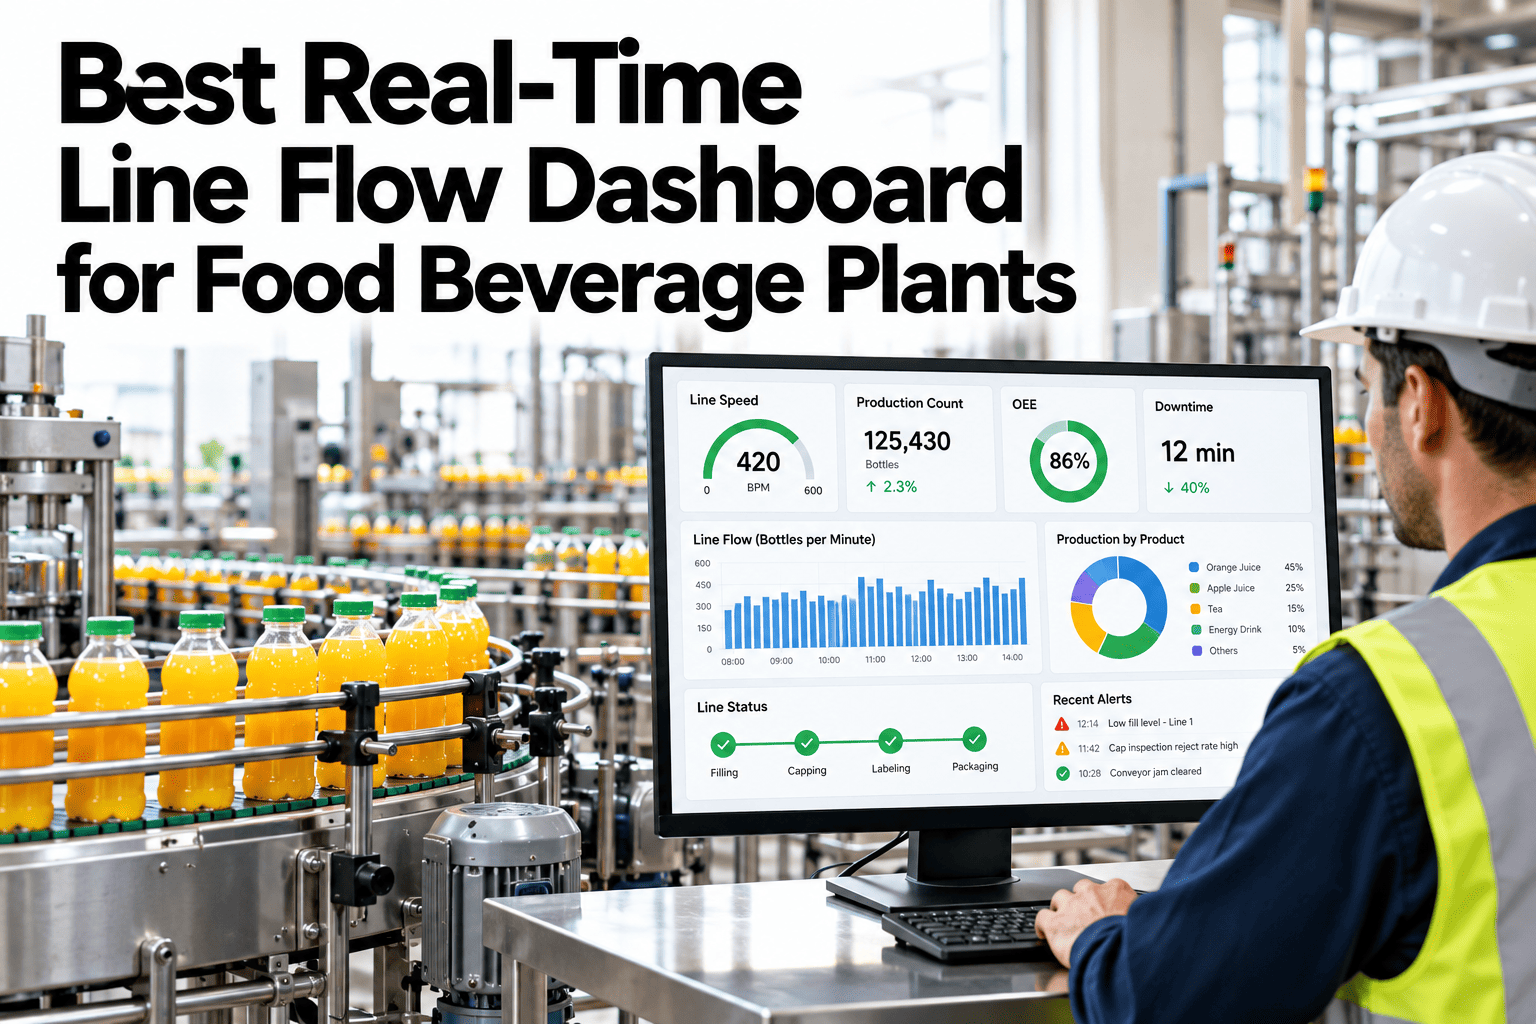
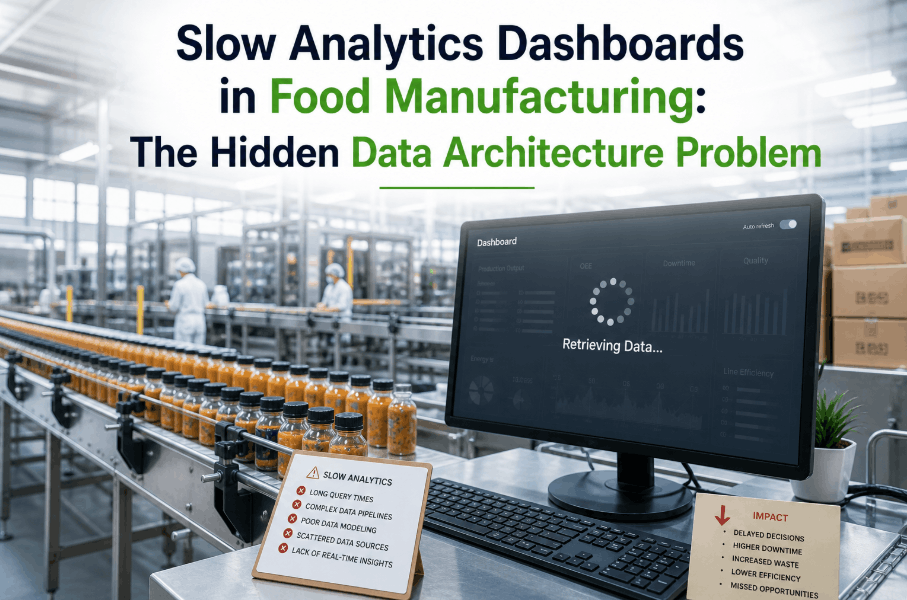
A dashboard showing OEE at 68% answers almost nothing by itself — it does not say which shift, which product run, or which specific ten-minute window drove the number down. Event-level production analytics keeps the detail intact: every availability gap, every speed loss and every quality drop stays tied to its source data, so a director can click from the summary number straight through to the exact event behind it. You can drill through your own OEE number to its source events with our team.
Food Plant Analytics, 2027
Every Summary Number Should Click Through to Its Source
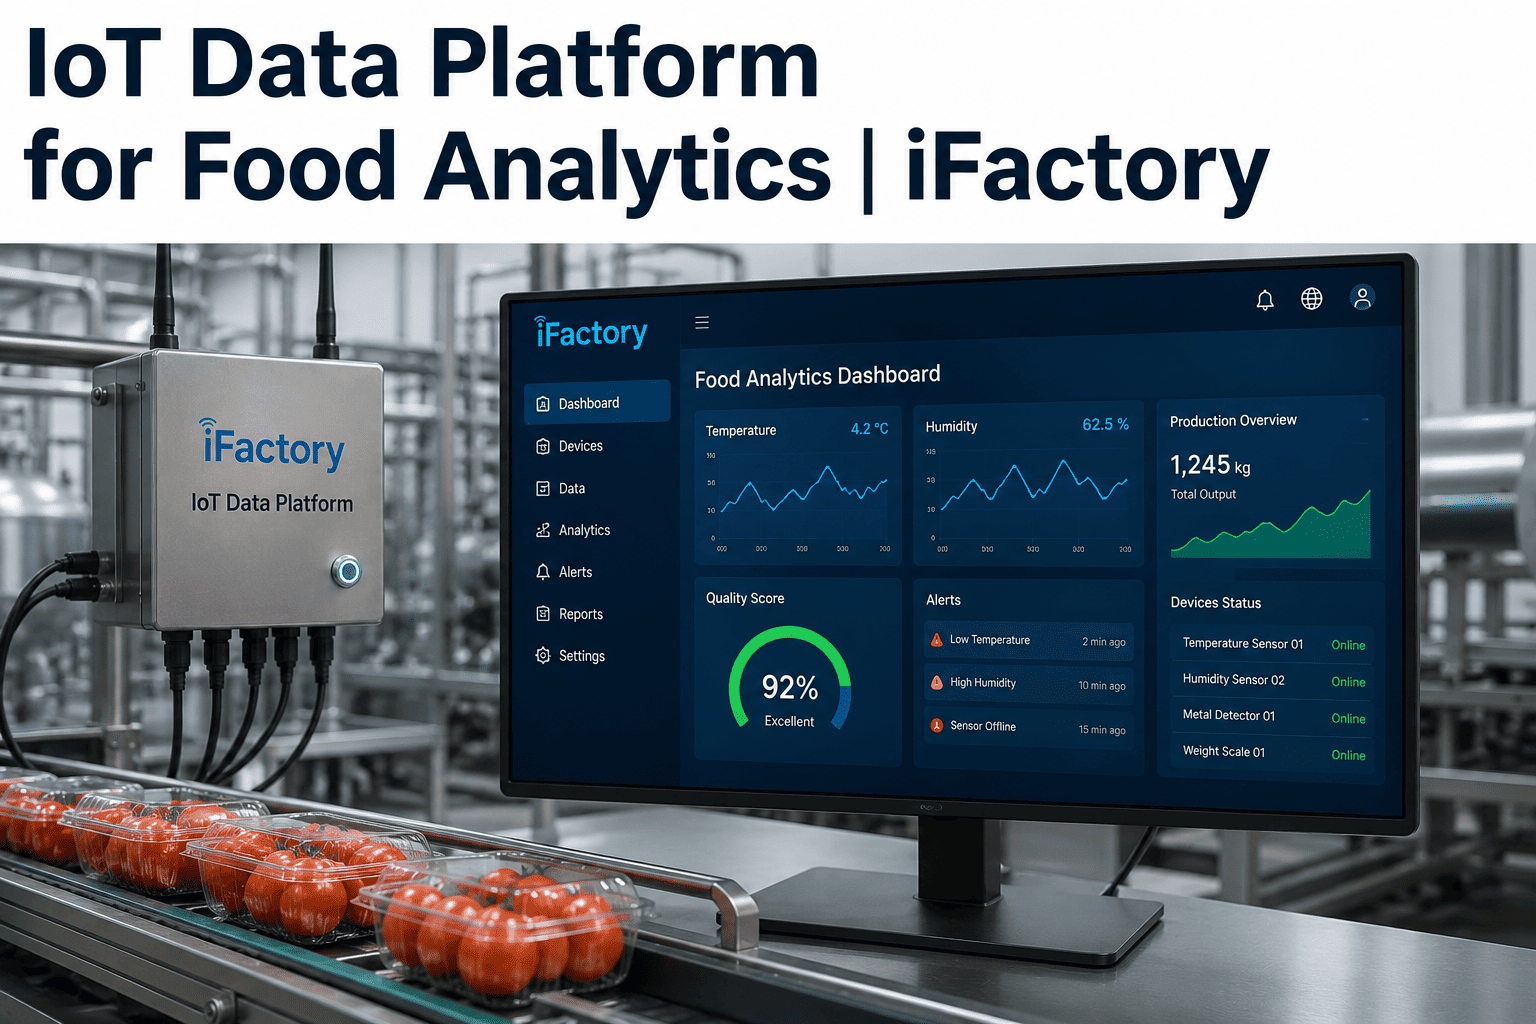
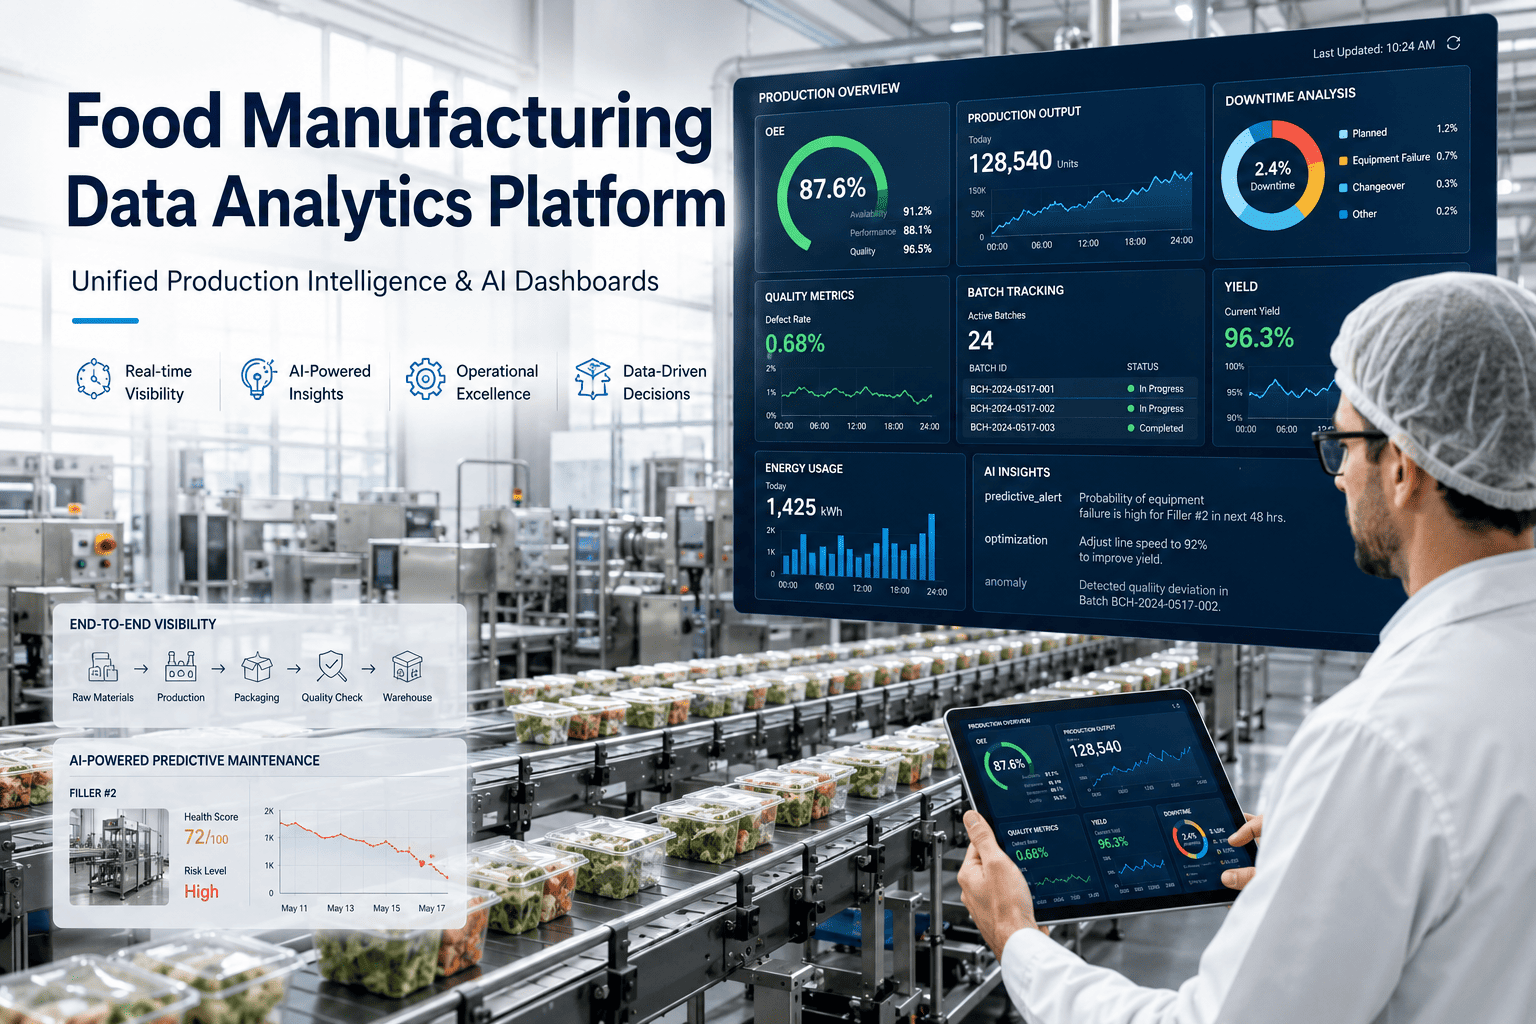
iFactory, an on-premise AI platform for production monitoring and OEE analytics, keeps availability, speed loss and quality events at full detail, with drill-through from any summary number straight to the source data behind it.
OEE: 68%
Speed Loss: 14%
Event: Line 3, 2:14pm, Changeover Overrun
What it is
What Makes Analytics "Event-Level" Rather Than Summary-Only?
Event-level analytics preserves every individual availability gap, speed loss and quality drop as its own record, with full source detail — timestamp, asset, shift, reason — rather than collapsing everything into pre-aggregated summary numbers from the start.
A summary-only dashboard can show the trend but not the cause. Event-level analytics keeps both: the summary for a quick read, and a direct path down to the specific event anyone needs to investigate further.
Three loss categories
What Gets Tracked at Full Detail
Availability
Every stop, with duration, reason code and the asset involved.
Speed loss
Every window where the line ran below standard rate, and for how long.
Quality drops
Every reject or hold event, linked back to the batch and process conditions at the time.
Comparison
Summary-Only Dashboard vs Event-Level Analytics
| Dimension | Summary-Only Dashboard | Event-Level Analytics |
|---|
| What you see first | A single OEE or loss percentage | The same number, with drill-through available |
| Investigating a dip | Requires a separate manual data pull | Click through to the source event directly |
| Historical detail | Often pre-aggregated and lossy | Full event detail retained over time |
| RCA starting point | A number with no path to the cause | The specific event already attached |
How it works
Four Layers From Raw Signal to Summary Dashboard
1
Capture raw machine, quality and work order events as individual records, not pre-aggregated.
2
Classify each event into its loss category — availability, speed or quality — with full source detail retained.
3
Roll events up into summary KPIs for the dashboard a director checks daily.
4
Keep a direct link from every summary number back to its underlying events, available on demand.
Expert review
What a Plant Analytics Lead Would Check First
Holds up
Preserving event-level detail beneath summary KPIs is standard data-warehousing practice applied to production analytics; the discipline is in not throwing detail away at the point of aggregation.
Watch for
A platform that markets "drill-down" but only goes one level deep, landing on another summary rather than the actual source event and its raw data.
Do next
Test the drill-through on your most confusing recent OEE dip first, since that is the clearest proof of whether the platform actually reaches the source event.
FAQ
What Food Plants Ask About Production Analytics Platforms
What does "drill-through to source data" actually mean in practice?
It means clicking on a summary number — an OEE percentage, a loss category — and landing directly on the individual events that produced it, with timestamp, asset and reason detail intact, rather than a second, still-aggregated view.
See this on your own data with our team.
Does keeping event-level detail require significantly more storage?
Event-level data is larger than pre-aggregated summaries, but with modern data infrastructure this is rarely a practical constraint — the tradeoff is well worth it given how much analytical value is lost when detail is discarded at aggregation time.
Ask about data retention for your setup.
How far back should event-level history be retained?
Most food plants retain at least a year of detailed event history to support seasonal comparison and RCA on longer-developing patterns, though retention needs vary by audit and customer requirements.
Discuss your retention requirements with our team.
Can this connect to our existing PLC and MES data?
Yes — event-level analytics is built to capture from existing machine and execution data sources rather than requiring a separate parallel data collection system.
Ask about connecting your current systems.
Who typically uses the drill-through feature day to day?
Plant directors use the summary view daily, while quality, maintenance and RCA teams use the drill-through specifically when a summary number prompts a question that needs the underlying event to answer.
Discuss role-based access for your team.