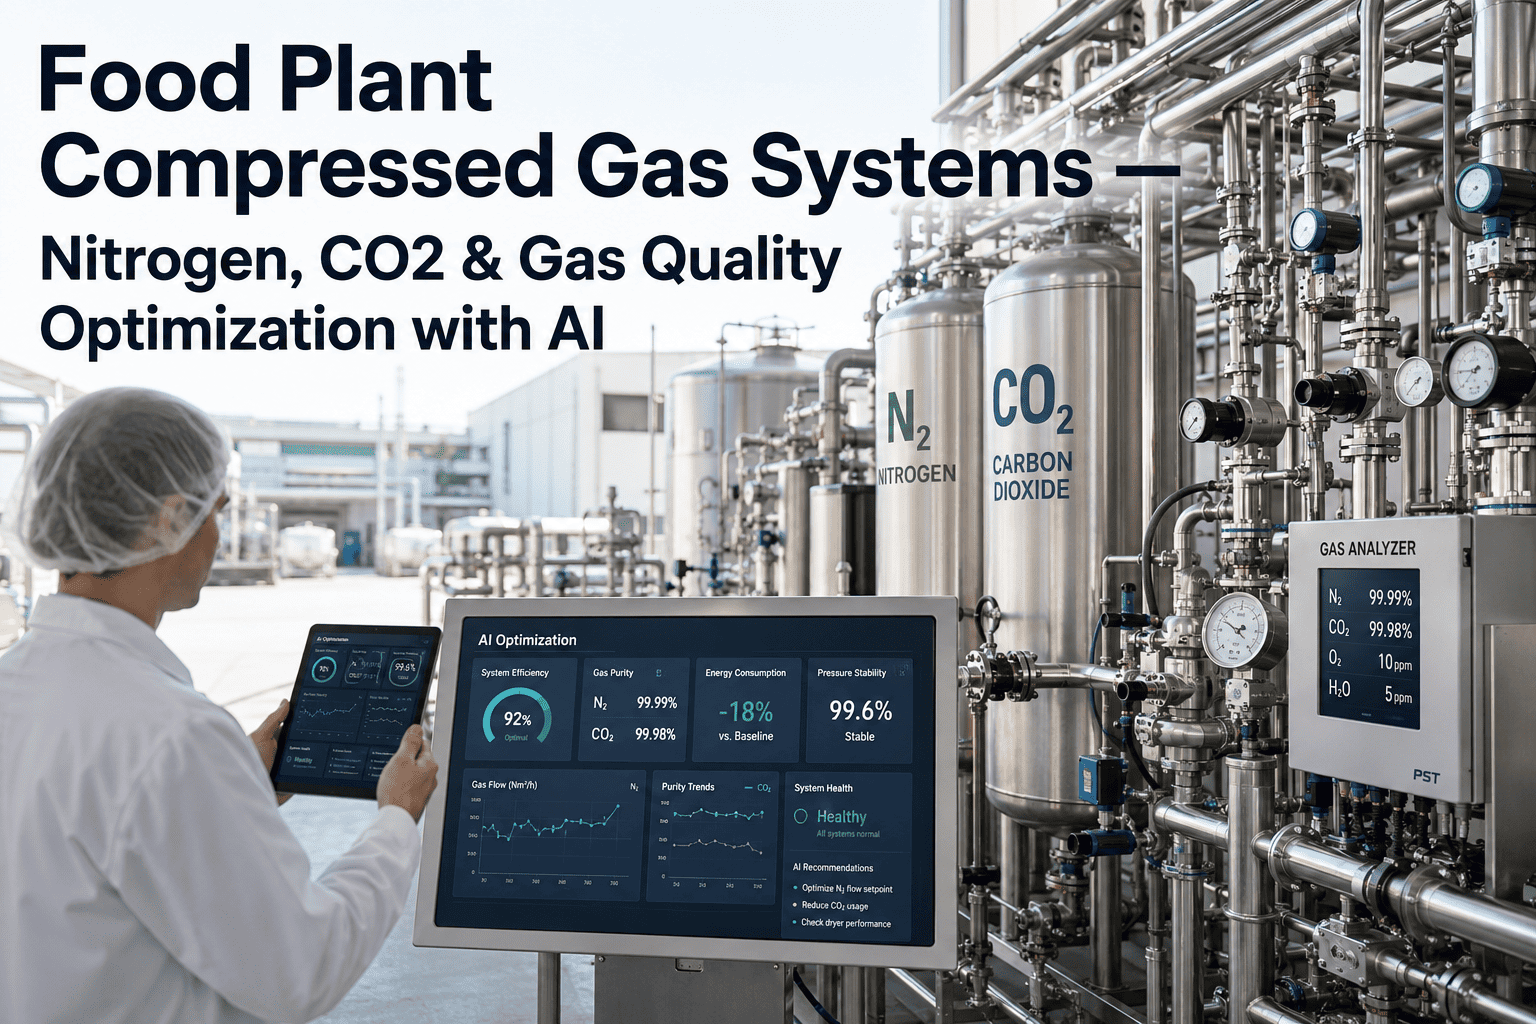
Most process engineers can quote their compressed air pressure setpoint from memory, but ask about nitrogen purity at the point of use during a modified-atmosphere packaging run and the answer is often "it's fine, the generator handles it." Purity drifts quietly as membranes age or PSA beds foul, and a shift from 99.9% to 99.5% nitrogen purity can be the difference between a three-week shelf life and product coming back from a retailer early. iFactory tracks gas quality and consumption continuously so drift gets caught at the generator, not in a customer complaint, which is easiest to see in a demo against your own utility room.
Nitrogen and CO2 Cost More Than the Invoice Shows Once Purity Drift and Over-Purging Are Counted
iFactory monitors gas purity, flow, and consumption across your compressed gas system in real time, flagging the drift and waste that a monthly utility bill never explains.
Every Plant's Gas Supply Follows the Same Three-Stage Path, Just With Different Equipment at Each Stage
Whether nitrogen arrives by cylinder, bulk liquid delivery, or an on-site generator, the gas still moves through the same three stages before it reaches a packaging line or blanketing application. Where quality gets lost usually traces back to one specific stage.
Generation or Supply
PSA or membrane generators, bulk liquid tanks, or cylinder banks produce or store the gas at source purity.
Distribution
Piping, regulators, and buffer tanks move gas to point of use, where leaks and pressure drops most commonly occur.
Point of Use
Packaging headspace flush, blanketing, or carbonation draws gas at the exact purity and flow the application requires.
Typical Purity Requirements by Application
Not every use case needs the same purity level, and generating higher purity than an application requires is one of the most common sources of unnecessary compressed gas cost in food plants.
Four Gas System Signals iFactory Monitors Continuously
Purity meters and flow meters already exist on most systems. iFactory's layer turns those individual readings into a pattern that tells engineers what's actually changing and why.
Purity Drift Detection
Flags gradual purity decline against the specific threshold each application requires, before a quality issue shows up downstream.
Consumption Per Unit Output
Normalizes gas usage against production volume, surfacing lines that consume more nitrogen per case than their peers.
Leak and Pressure Loss Mapping
Correlates pressure drops across distribution segments to localize leaks without a manual ultrasonic survey.
Generator Efficiency Trend
Tracks PSA or membrane generator output against feed air quality to flag maintenance needs before purity actually fails.
A Purity Meter Tells You the Number Right Now. It Doesn't Tell You It's Been Sliding for Three Weeks
iFactory turns your existing gas quality sensors into a trend engineers can act on before a shelf-life complaint arrives.
Bulk Delivery, On-Site Generation, or Cylinders: How the Three Options Compare
The right supply method depends on volume, purity needs, and how much variability your usage sees across shifts and seasons.
| Method | Best Fit For | Purity Ceiling | Cost Driver |
|---|---|---|---|
| On-Site Generation | High, steady volume | Up to 99.999% | Upfront equipment, low marginal cost |
| Bulk Liquid Delivery | Large but variable volume | Up to 99.998% | Delivery logistics and storage rental |
| Cylinder Supply | Low volume, backup use | Varies by grade | Highest per-unit cost |
Results Reported by Plants After Adding Gas Analytics
These figures reflect changes reported by food manufacturing sites after adding continuous purity and consumption monitoring to existing compressed gas systems.
Questions Process Engineers Ask About AI Gas Monitoring
Stop Guessing Where Your Gas Budget and Purity Margin Are Going
See iFactory's compressed gas analytics running against a system like yours in a live walkthrough.