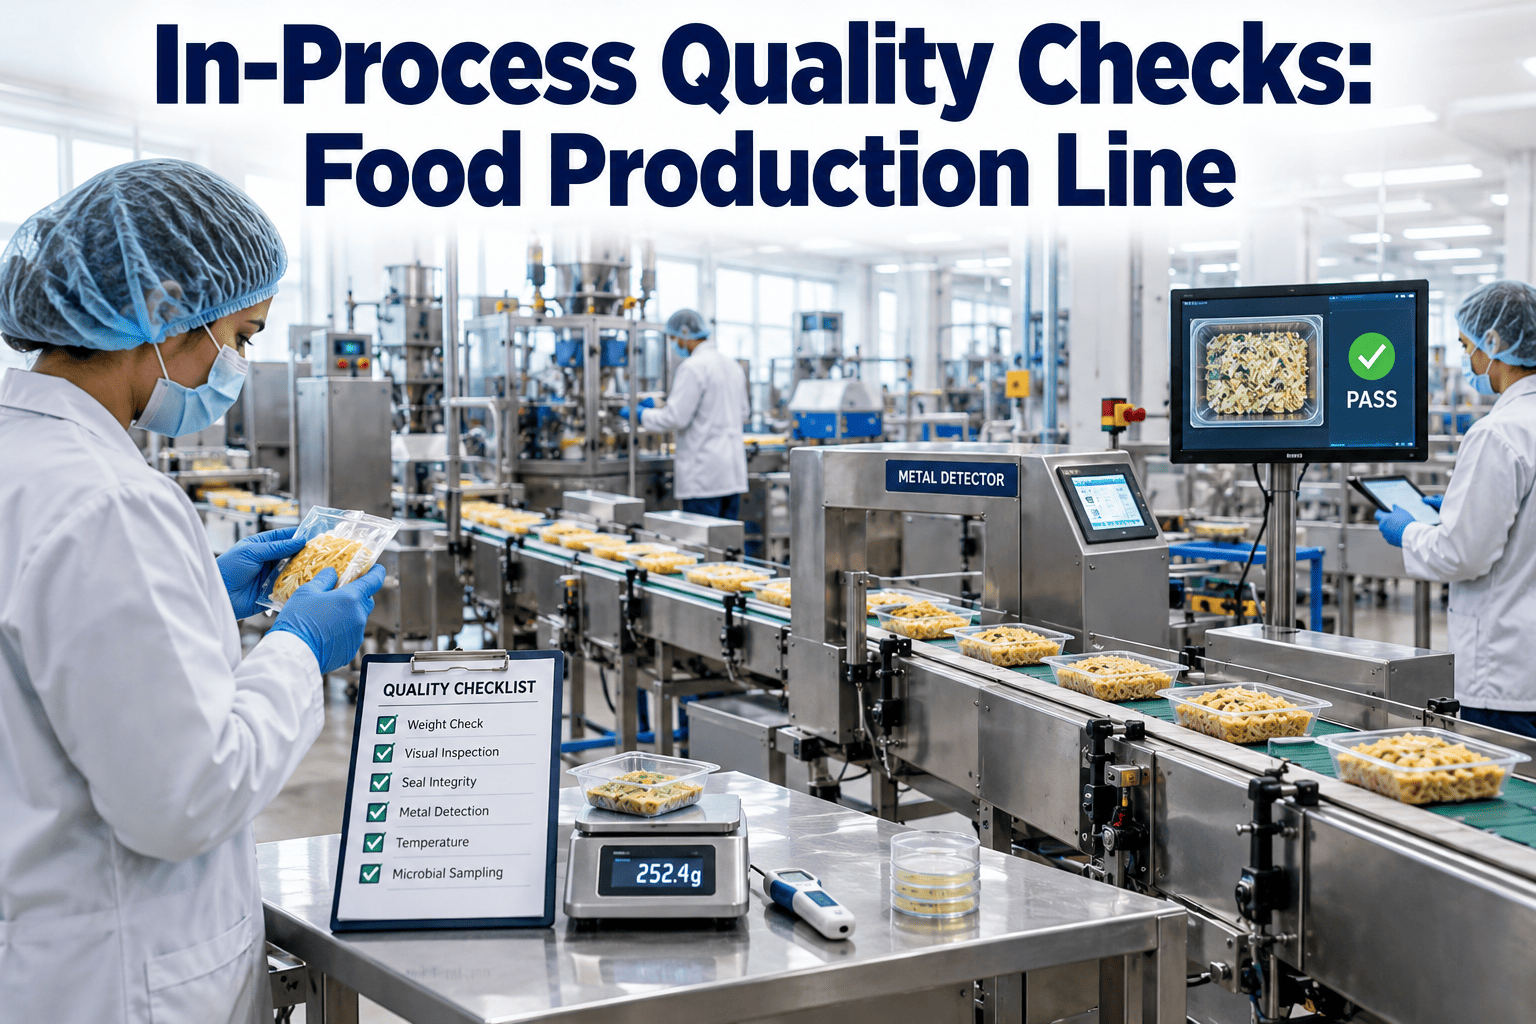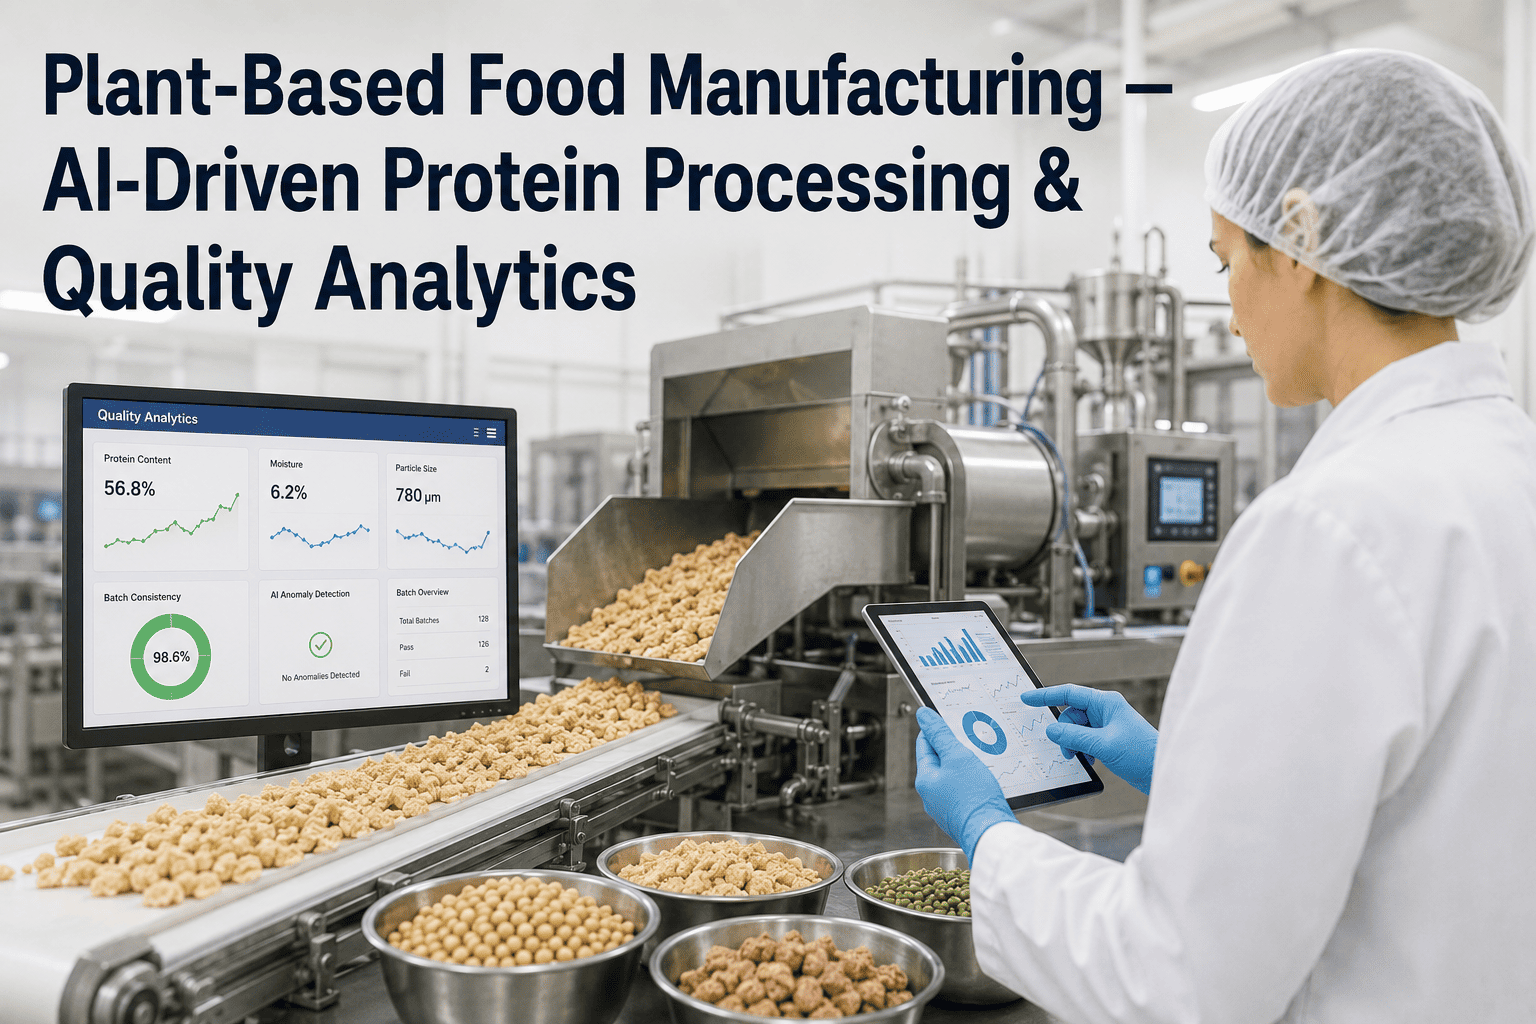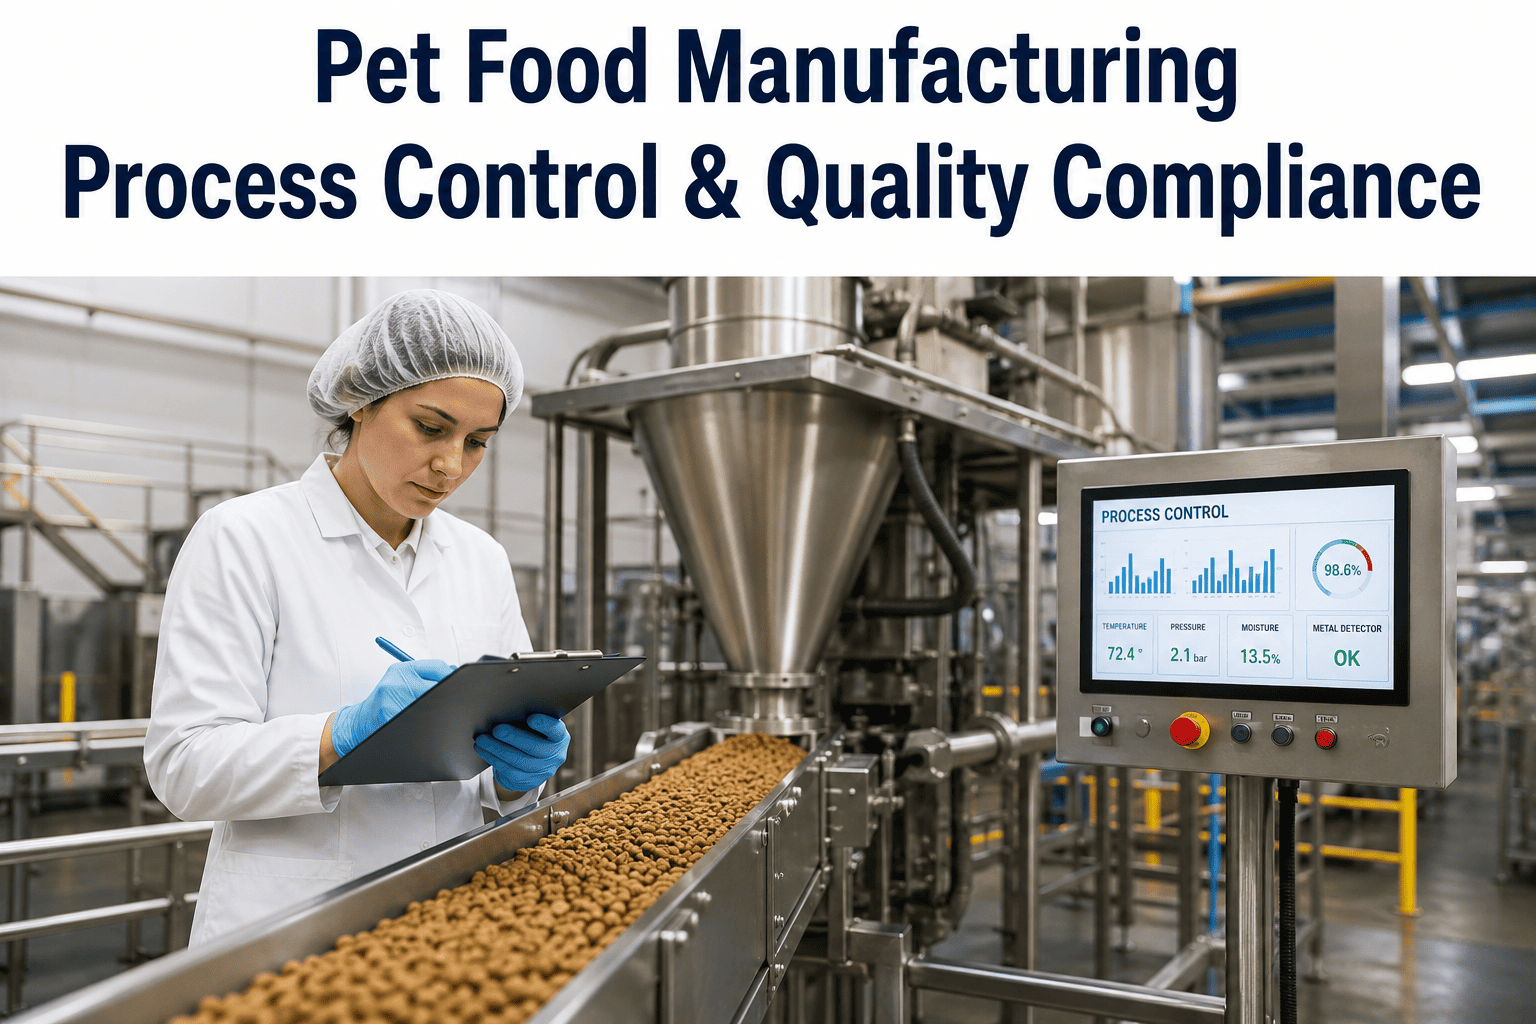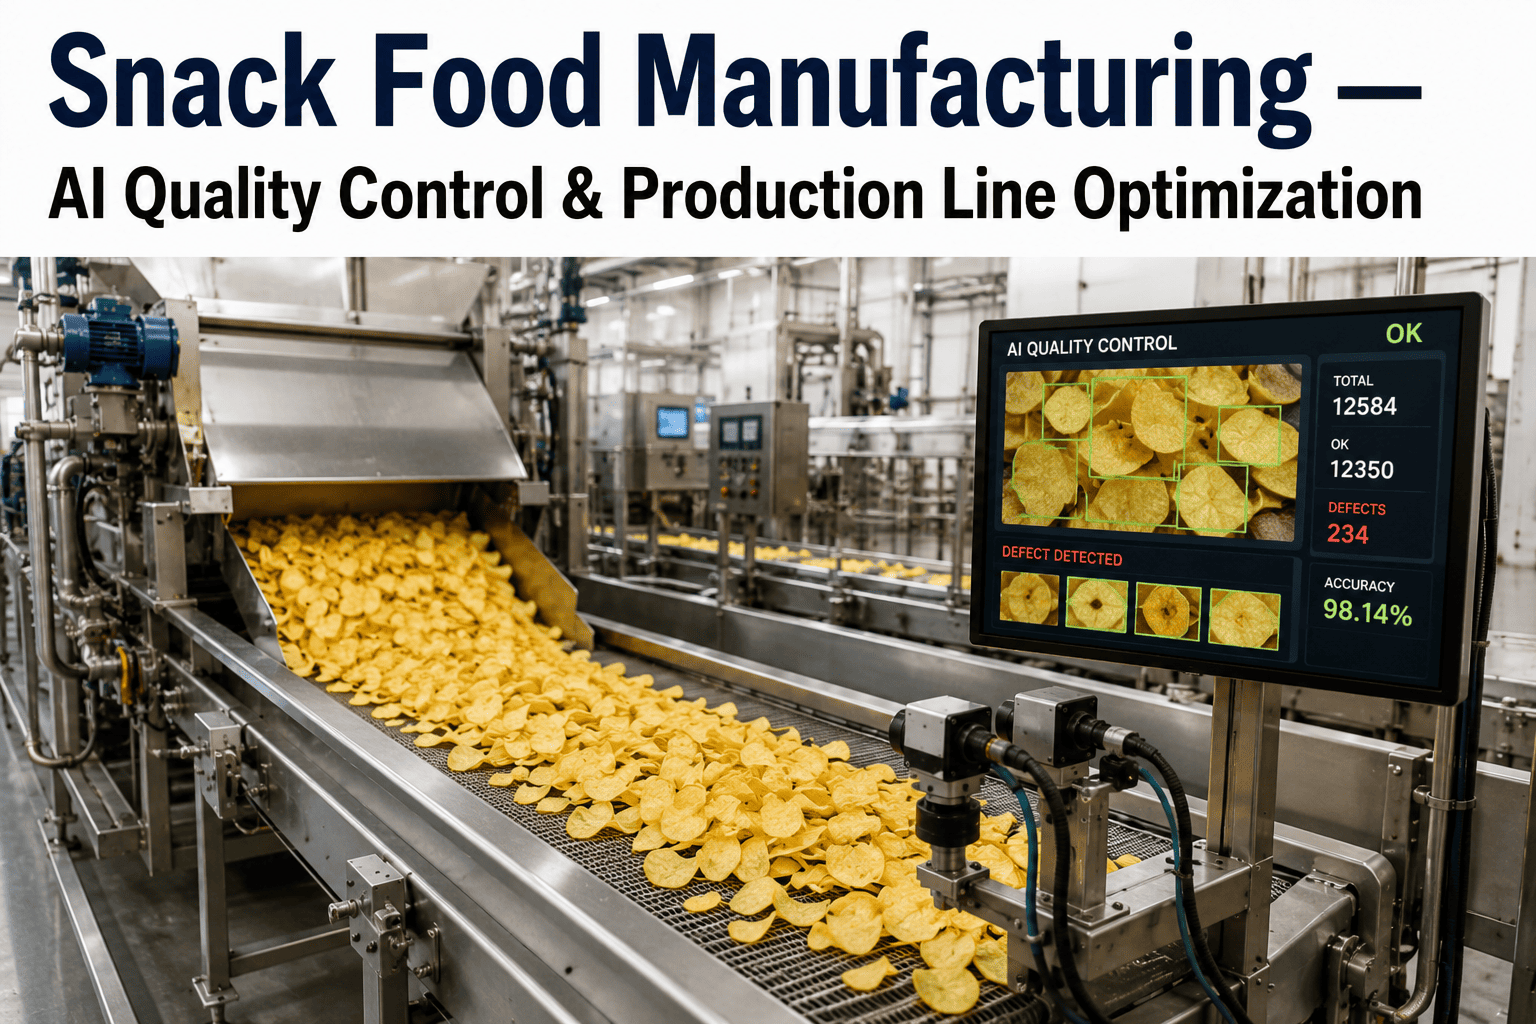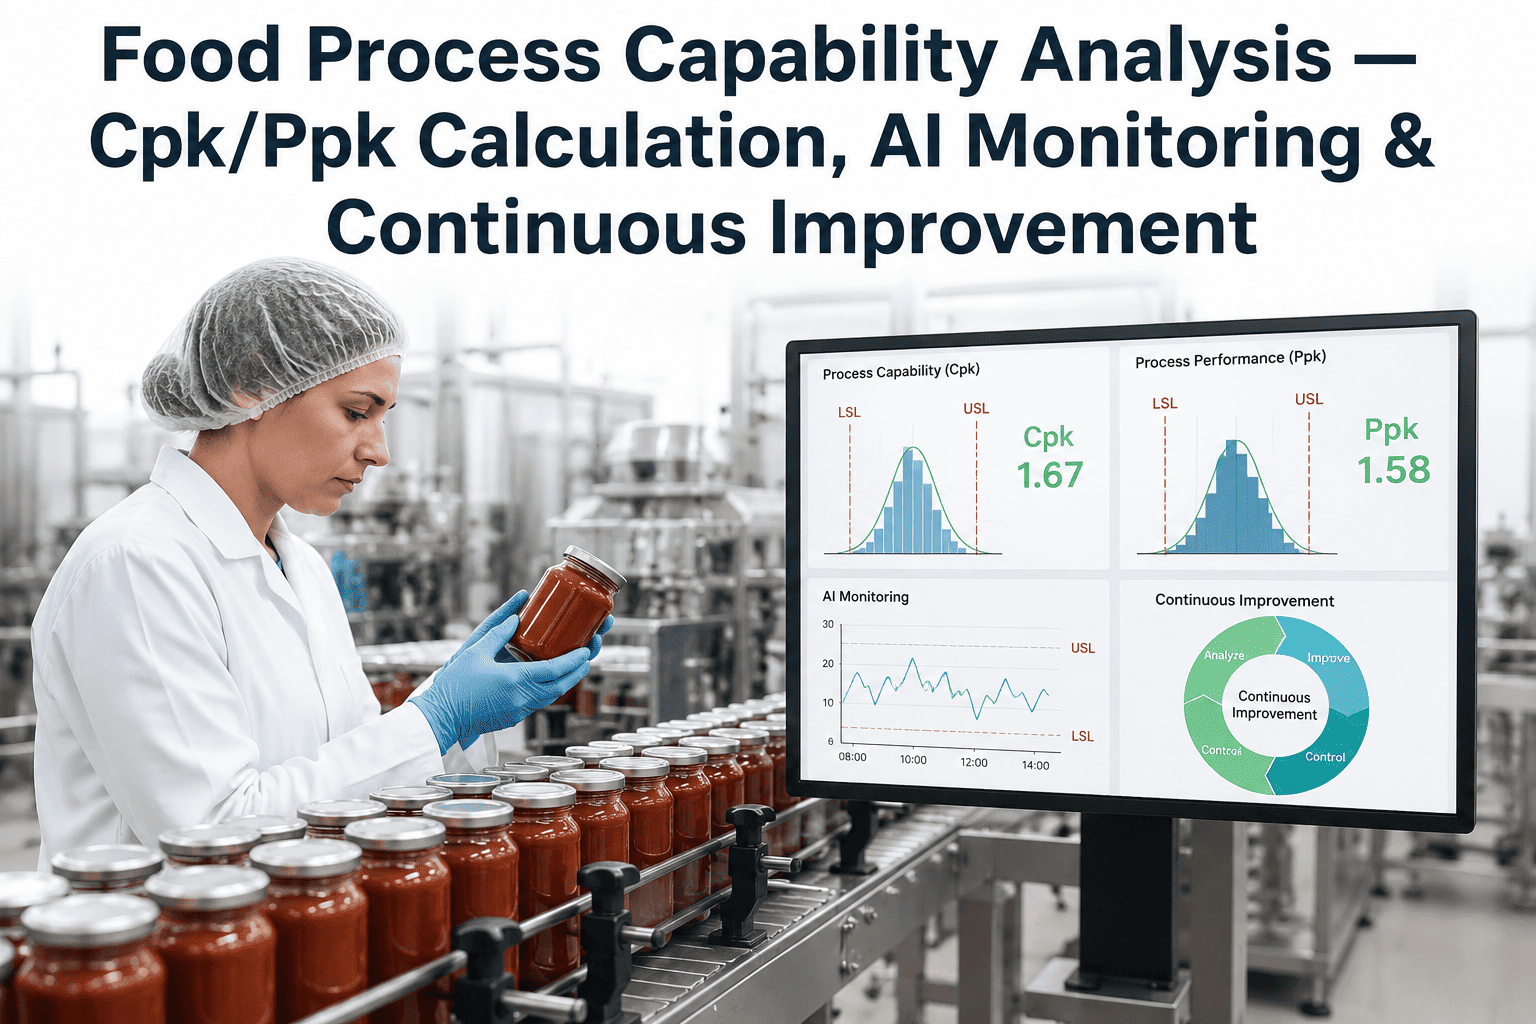
In the high-stakes environment of food manufacturing, process capability indices such as Cpk and Ppk are not merely statistical metrics—they are the bedrock of quality assurance, regulatory compliance, and operational excellence. For Quality Managers overseeing production lines for packaged goods, beverages, or ingredients, understanding and continuously improving process capability is essential to minimize waste, reduce rework, and ensure every unit meets stringent specification limits. Traditional manual calculations and periodic sampling are no longer sufficient in the era of Industry 4.0. By integrating AI-driven analytics into capability monitoring, manufacturers can detect subtle shifts in process performance in real time, predict potential non-conformances before they occur, and drive data-informed continuous improvement initiatives. This comprehensive guide delves into the technical nuances of Cpk and Ppk calculation for critical parameters such as fill weight, product dimensions, and chemical composition, and explores how AI-powered platforms like iFactory can transform capability analysis from a retrospective reporting exercise into a proactive, predictive, and prescriptive tool for manufacturing excellence. Book a Demo to see how AI can elevate your process capability monitoring.
Unlock Real-Time Process Capability Insights with AI
Transform your quality control with AI-driven Cpk/Ppk monitoring. Detect shifts instantly and reduce waste.
Why Process Capability Matters in Food Manufacturing
Process capability indices quantify how well a manufacturing process can produce output within specified tolerance limits. In food production, where parameters like net weight, pH level, moisture content, and vitamin fortification are tightly regulated, a high Cpk value indicates that the process is both centered and consistent. Low capability signals excessive variation, leading to out-of-spec products, costly recalls, and brand damage. AI enhances this analysis by continuously monitoring data streams from sensors and inline inspection systems, identifying subtle patterns that human analysts might miss, and providing early warnings when capability trends degrade.
Understanding Cpk and Ppk: Definitions and Differences
Cpk (Process Capability Index) measures the capability of a process that is assumed to be stable and in statistical control. It compares the distance from the process mean to the nearest specification limit, divided by three times the process standard deviation. A Cpk of 1.33 is often considered the minimum acceptable threshold for food production, indicating that the process is capable of producing 99.73% of units within spec. Ppk (Process Performance Index) uses the overall standard deviation, including any special cause variation, making it a more conservative measure for processes that are not yet fully stable. AI systems can automatically compute both indices in real time, flagging when either falls below target, and provide root cause analysis by correlating capability changes with upstream variables like ingredient batch, machine speed, or ambient temperature.
Cpk Calculation Example: Fill Weight
For a 500g cereal box with USL=510g and LSL=490g, if the process mean is 503g and sigma is 2.5g, Cpk = min((510-503)/(3*2.5), (503-490)/(3*2.5)) = min(0.93, 1.73) = 0.93. This low Cpk indicates the process is too close to the upper spec limit, risking overfill waste. AI can suggest adjusting the fill head target to 502g to center the process.
Ppk Calculation Example: pH Level
For a sauce with target pH 4.5 and limits 4.0-5.0, if historical data shows mean 4.6 and overall sigma 0.15, Ppk = min((5.0-4.6)/(3*0.15), (4.6-4.0)/(3*0.15)) = min(0.89, 1.33) = 0.89. The low Ppk suggests the process is not stable enough; AI can identify fermentation time variation as the root cause.
Chemical Parameter: Salt Content
For a snack with target 1.2% salt and limits 1.0%-1.4%, if AI monitoring shows Cpk dropping from 1.5 to 0.8 over a shift, the system can correlate this with a change in brine concentration and alert the operator to recalibrate the dosing pump.
Key Parameters for Capability Analysis in Food
| Parameter | Typical Specification Limits | Common Cpk Target | AI Monitoring Benefit |
|---|---|---|---|
| Net Weight (g) | ±1-5% of declared | 1.33 | Real-time fill head adjustment |
| Moisture Content (%) | ±0.5-2% | 1.33 | Predict dryer performance drift |
| pH Level | ±0.2-0.5 | 1.33 | Correlate with fermentation time |
| Vitamin Fortification (mg) | ±10% of label | 1.67 | Detect dosing pump wear early |
| Package Dimensions (mm) | ±0.5-2mm | 1.33 | Identify forming tool degradation |
AI-Driven Capability Trend Alerting: How It Works
Traditional capability analysis relies on periodic manual calculations, often weekly or monthly, which can miss rapid shifts in process performance. AI platforms like iFactory continuously ingest data from inline sensors, checkweighers, vision systems, and lab instruments. Machine learning models detect patterns such as gradual mean drift, increasing variance, or cyclic behavior that precede a capability drop. When Cpk or Ppk trends downward, the system sends real-time alerts to Quality Managers via dashboards, email, or SMS, along with suggested corrective actions based on historical correlations. This proactive approach reduces the time to detect and respond to capability issues from days to minutes.
Implementing AI Capability Monitoring: A Step-by-Step Timeline
Data Integration
Connect AI platform to existing sensors, PLCs, and MES to capture real-time parameter data.
Baseline Calculation
Compute initial Cpk and Ppk for each parameter using historical data to establish baseline capability.
Model Training
Train AI models to recognize normal variation patterns and detect early signs of capability drift.
Real-Time Monitoring
Deploy dashboards showing live Cpk/Ppk values, trend charts, and alert thresholds.
Continuous Improvement
Use AI-generated insights to fine-tune process parameters, schedule maintenance, and reduce variation.
Ready to Transform Your Capability Monitoring?
Leverage AI to achieve consistent Cpk > 1.33 across all critical parameters. Reduce waste and improve compliance.
Best Practices for Maintaining High Cpk in Food Production
Sustaining high process capability requires a holistic approach. First, ensure measurement systems are accurate and repeatable—gauge R&R studies should be conducted regularly. Second, implement statistical process control (SPC) charts for real-time visualization of parameter variation. Third, use AI to perform root cause analysis when capability drops, correlating with factors like raw material lots, machine settings, and environmental conditions. Fourth, establish a preventive maintenance schedule based on capability trends, not just time intervals. Finally, involve cross-functional teams in capability review meetings to drive continuous improvement. These practices, combined with AI monitoring, create a robust quality management system.
Traditional vs. AI-Enhanced Capability Analysis
| Aspect | Traditional | AI-Enhanced |
|---|---|---|
| Data Frequency | Weekly samples | Continuous real-time |
| Detection Speed | Days to weeks | Minutes |
| Root Cause Analysis | Manual investigation | Automated correlation |
| Scalability | Limited to few parameters | Hundreds of parameters |
| Predictive Capability | None | Forecast future drift |
Regulatory Compliance and Audit Readiness
Food manufacturers must comply with regulations such as FDA 21 CFR Part 11, FSMA, and global standards like ISO 22000. AI-driven capability monitoring supports compliance by providing automated, tamper-proof data logging, real-time alerts for deviations, and comprehensive audit trails. Quality Managers can generate reports on demand showing Cpk/Ppk trends, corrective actions taken, and process adjustments, all of which satisfy auditor requirements. The ability to demonstrate proactive capability management strengthens brand reputation and reduces liability.
Quantifying the ROI of AI Capability Monitoring
Investing in AI for process capability analysis delivers measurable returns. Reduced waste from out-of-spec products can lower material costs by 5-15%. Fewer recalls and rework save millions in potential losses. Improved process centering allows for tighter specification compliance, reducing the need for safety margins that inflate costs. Additionally, automation of data analysis frees Quality Managers to focus on strategic improvements. A typical food plant can achieve payback within 6-12 months of deployment.
Frequently Asked Questions
What is the difference between Cpk and Ppk?
Cpk assumes the process is in statistical control and uses within-subgroup variation, while Ppk uses overall variation including special causes. For food processes that are not yet stable, Ppk is more appropriate. AI can compute both simultaneously and recommend which to use based on process stability. Learn more about Cpk vs Ppk from our support resources.
How often should Cpk be calculated for food processes?
For critical parameters like net weight and fortification, real-time calculation is ideal. With AI, Cpk can be updated every production run or even every minute. This frequency allows immediate detection of shifts, whereas manual weekly calculations may miss transient issues. Book a Demo to see real-time monitoring in action.
What is a good Cpk value for food manufacturing?
A Cpk of 1.33 is generally considered the minimum acceptable, indicating 99.73% of output within spec. For high-risk parameters like allergens or fortification, a target of 1.67 or higher is recommended. AI can help you set dynamic targets based on historical performance and risk assessment. Contact our team for guidance on setting capability targets.
Can AI predict when Cpk will drop below target?
Yes, AI models trained on historical data can detect early warning signs such as increasing variance or mean drift, and forecast future Cpk values. This predictive capability allows proactive adjustments before non-conformances occur. Book a Demo to explore predictive analytics.
How does AI handle multiple parameters simultaneously?
AI platforms can monitor hundreds of parameters in parallel, each with its own specification limits and capability targets. Multivariate models can detect interactions between parameters, such as how moisture content affects weight, providing holistic process understanding. Learn more about multivariate analysis in our support documentation.
Elevate Your Food Quality with AI-Driven Capability Analysis
Stop relying on retrospective reports. Gain real-time visibility into process performance and drive continuous improvement with iFactory.