Most food plants already collect weight, moisture, and temperature readings on every batch, yet many still only look at those numbers after a batch fails to meet spec. Statistical process control flips that sequence, tracking every reading against control limits in real time so a process drifting toward an out-of-spec result gets caught while it is still correctable, not after the product has already been made. For quality managers building a defensible, auditable quality system, SPC turns raw process data into an early warning system rather than a historical record. Teams ready to see live control charts running on their own line data can book a demo.
STATISTICAL PROCESS CONTROL · FOOD MANUFACTURING · 2026
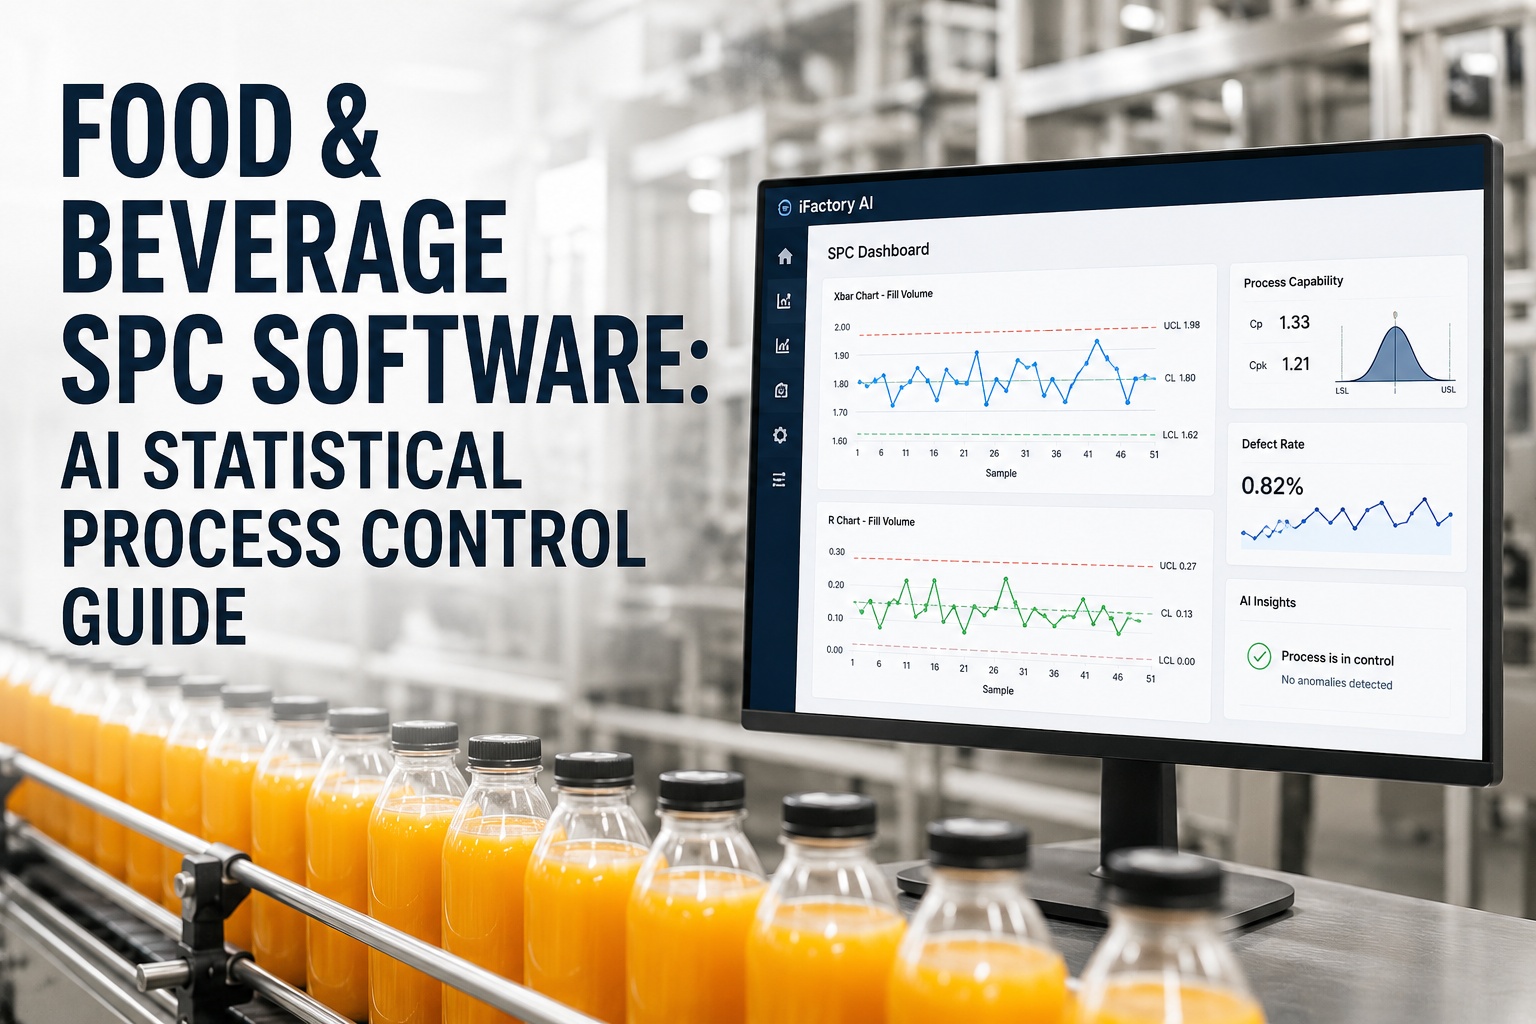
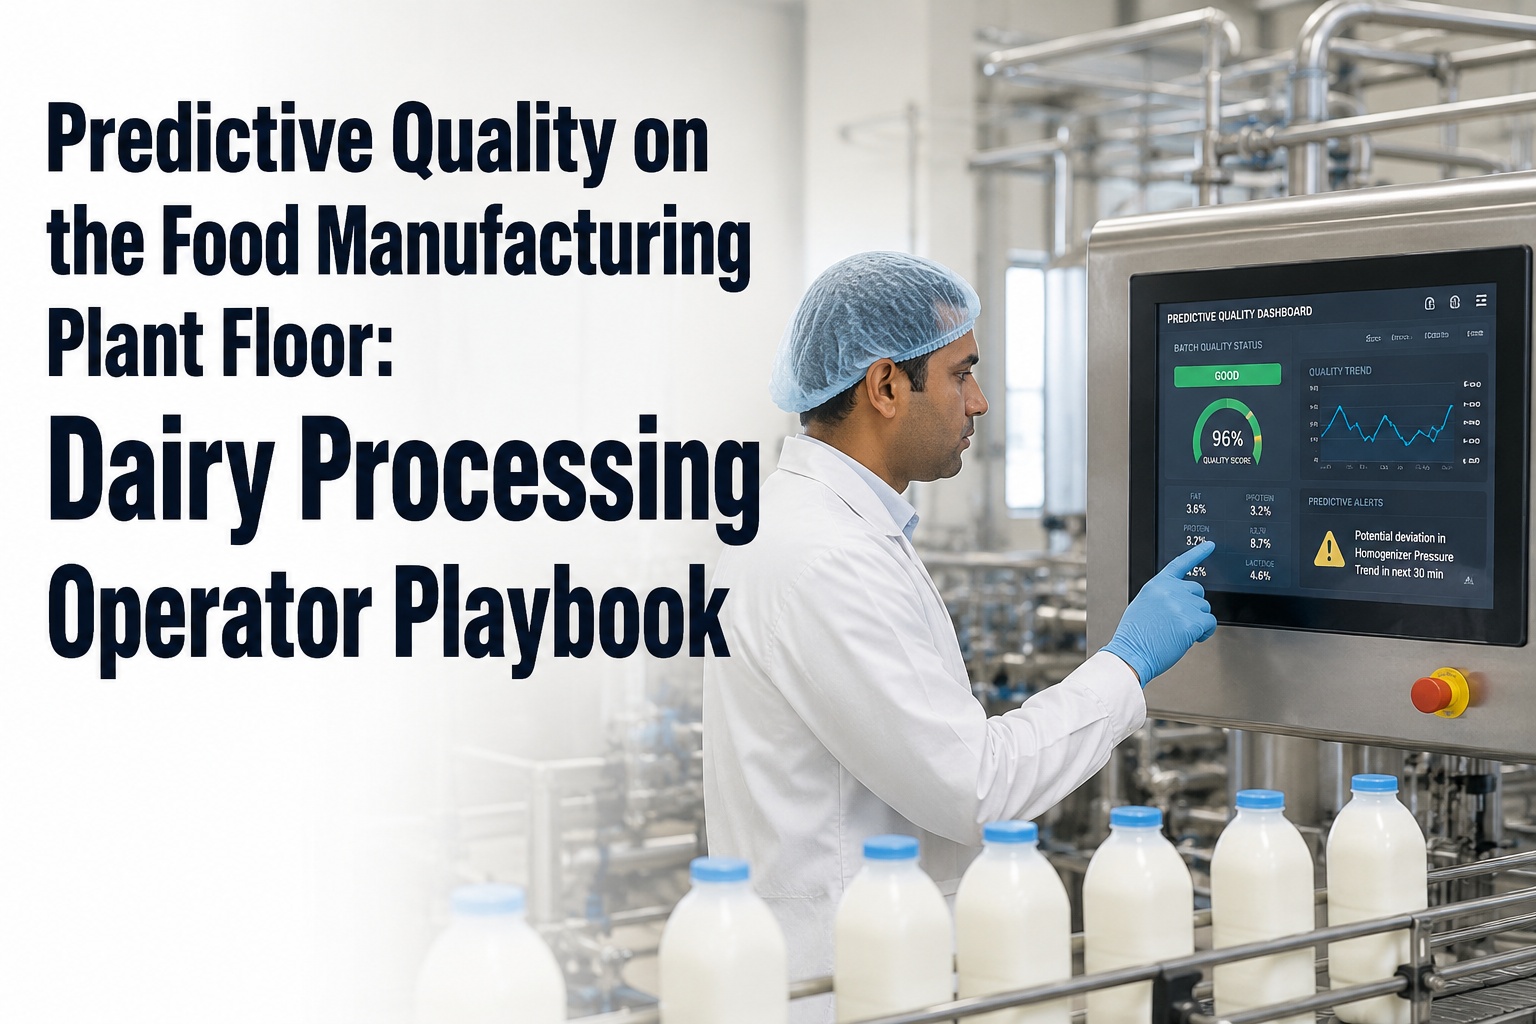
Catch Process Drift Before It Becomes a Failed Batch
Real-time control charts for weight, moisture, temperature, and Brix, with automatic out-of-spec alerts and Cpk tracking built for food production lines.
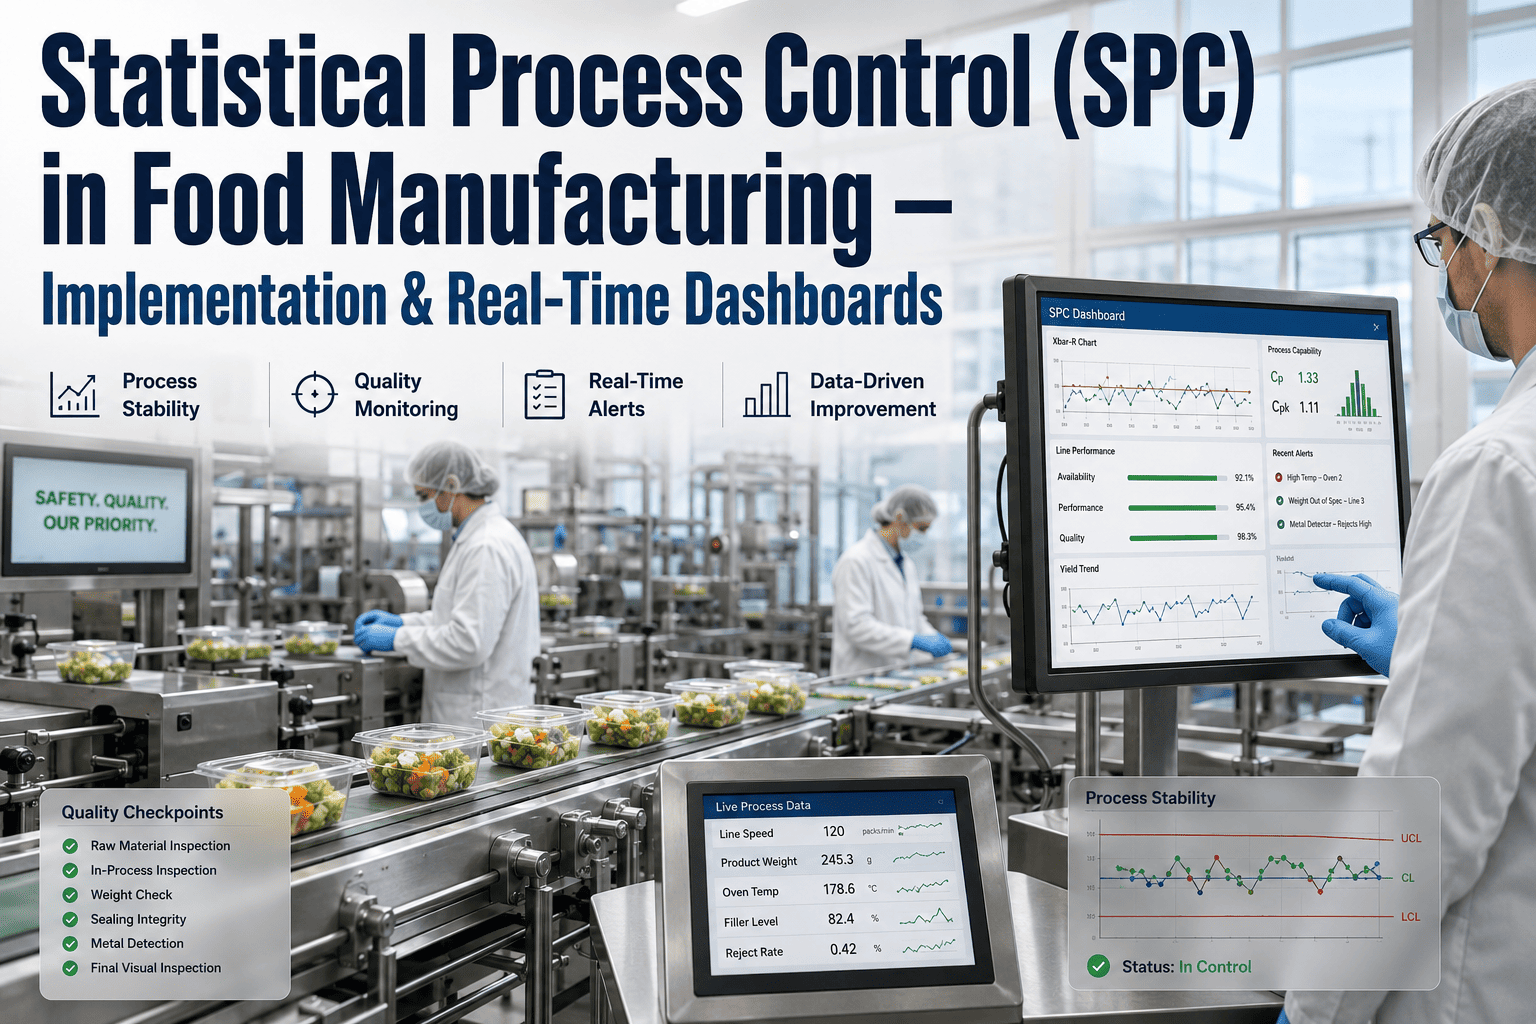
What a Live Control Chart Actually Shows
A control chart plots every reading against upper and lower control limits calculated from your own process history, not a generic industry default. The moment a run of points drifts toward a limit, or a single point breaches it, the system flags the trend before it turns into a rejected batch.
Upper Control Limit
Lower Control Limit
Flagged points show a process drifting toward the upper limit, triggering an alert before the next reading breaches spec entirely.
Cpk
Process capability tracked continuously, not recalculated once a month from a sample
UCL/LCL
Control limits calculated from your actual process history, not a generic default
Real-Time
Alerts fire the moment a reading or trend breaches a defined rule, not at shift end
Audit-Ready
Every chart, alert, and corrective action logged automatically for inspection
Metrics Most Food Plants Put Under SPC First
Not every measured parameter needs a control chart. Plants typically start with the handful of metrics that most directly affect compliance, cost, or customer complaints, then expand coverage as the program matures.
| Parameter | Why It Matters | Typical Alert Trigger |
|---|---|---|
| Fill Weight | Directly tied to giveaway cost and label accuracy compliance | Trend toward lower control limit |
| Moisture Content | Affects shelf life, texture, and food safety risk | Single point outside spec limits |
| Cook Temperature | Critical control point for food safety validation | Any deviation from validated set point |
| Brix Level | Determines product consistency and recipe accuracy | Seven consecutive points trending one direction |
SEE YOUR OWN PROCESS DATA ON A CONTROL CHART
Turn Raw Readings Into an Early Warning System
Get a walkthrough of live SPC charts built around your specific critical control points.
Rolling Out SPC Without Overwhelming the Floor
SPC programs fail most often when every parameter gets a chart on day one, overwhelming operators with alerts before anyone trusts the system. A staged rollout builds trust first.
Step 1
Baseline the process. Historical data establishes real control limits specific to your equipment and product, not a generic industry standard.
Step 2
Chart the critical few. Two or three parameters with the highest cost or compliance impact go live first, so the team learns the system on a manageable scope.
Step 3
Connect corrective actions. Alerts route directly to the operator or supervisor responsible, with a defined response logged against each one.
Step 4
Expand coverage. Additional parameters are added once the team trusts the first charts, building toward full-line SPC coverage over time.
What Quality Managers Are Saying
We used to find out our fill weights had drifted low when a customer complained about short-weight product. Now the chart flags the trend after just a handful of low readings, well before it turns into a compliance issue, and we adjust the filler before the next case even gets packed.
Quality Manager, Beverage Bottling Plant
Frequently Asked Questions
How are control limits calculated, and do we need to set them manually?
Control limits are calculated automatically from a baseline period of your own historical process data, typically using standard statistical methods based on the mean and variation observed during stable production. This means limits reflect what your specific equipment and product combination actually achieves, rather than an arbitrary industry-wide number that may not fit your process. Limits can be recalculated periodically as your process improves, so the chart continues to reflect genuine capability rather than a stale baseline.
What is the difference between Cpk and Ppk, and which one should we track?
Cpk measures how capable a process is of staying within specification limits based on short-term, within-subgroup variation, while Ppk measures overall performance including longer-term variation across shifts, days, and operators. Most food plants track both, since Cpk shows what the process is capable of under ideal conditions and Ppk shows what customers actually receive. A meaningful gap between the two numbers usually points to inconsistency between shifts or operators that is worth investigating.
Do operators need statistics training to use this day to day?
No, the system is designed so operators interact with clear visual alerts and defined response instructions rather than raw statistical calculations. When a chart flags a trend or an out-of-spec reading, the operator sees a plain-language alert with a suggested corrective action, not a control limit formula. The statistical work happens in the background, which is what allows SPC to actually get used consistently on the floor instead of becoming a report nobody reads.
How does SPC data support audits and regulatory inspections?
Every chart, alert, and logged corrective action becomes part of a continuous, timestamped record that auditors can review directly, replacing the manual log sheets many plants still rely on. This is particularly valuable for critical control points that need to demonstrate ongoing monitoring under a food safety plan, since the system shows not just that a parameter was in spec, but that it was actively monitored and responded to whenever it drifted. Teams preparing for an audit can review reporting formats through support.
How long does a full SPC rollout take across a plant?
A focused pilot covering two or three critical parameters on one line is typically live within three to four weeks, including the baseline period needed to establish real control limits. Full plant-wide coverage across all critical control points usually builds out over three to six months as parameters are added in stages, which keeps the rollout manageable for both IT and floor teams. Quality managers can book a demo to get a rollout plan scoped to their own critical control points.
SPC FOR FOOD MANUFACTURING
Stop Discovering Drift After the Batch Fails
Join food manufacturers already catching process drift in real time with live SPC charts.