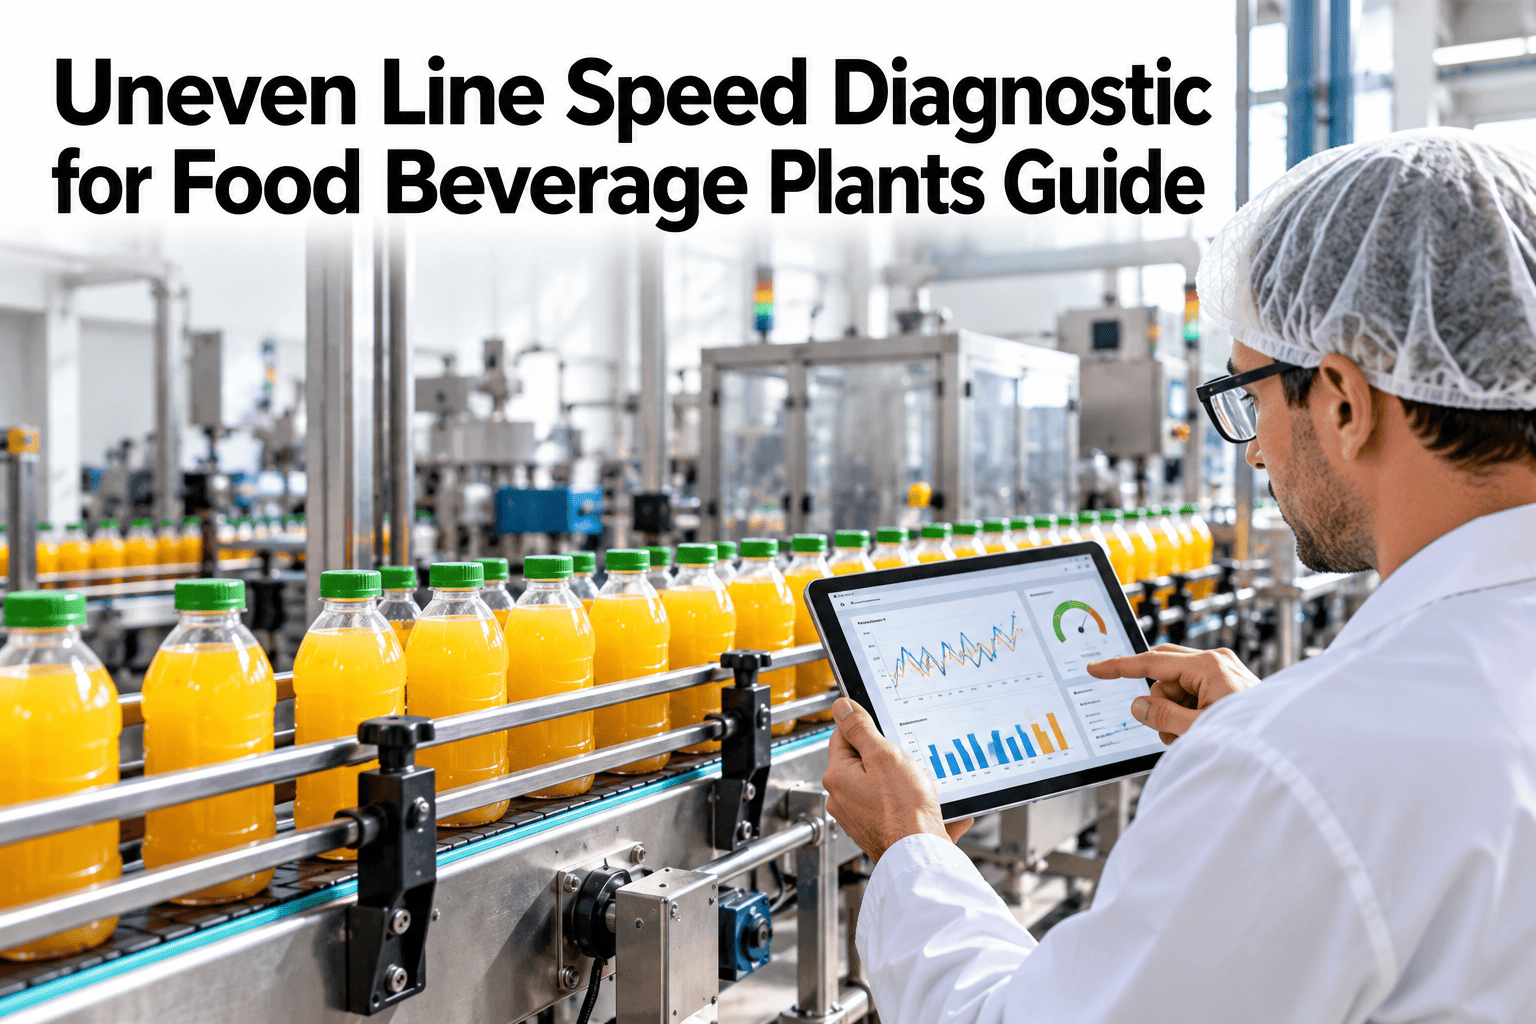
Every machine on a food line has a nameplate speed, and plants plan their throughput targets around those numbers for years after the equipment was installed. The problem is that nameplate speed and actual sustained speed drift apart over time, and when the filler runs 380 cases per minute while the labeler sustains only 340, the labeler is the true constraint no matter what the line's design rate says. Most plants never measure this gap directly. See your own line's actual speed parity mapped out in a short session.
The Slowest Sustained Station Sets Your Real Line Rate
iFactory AI measures actual sustained speed at every station, not nameplate rate, and names the true constraint when stations run out of parity.
Design Rate Is a Starting Point, Not a Fact
A nameplate speed reflects what a machine could do under ideal conditions when it was new.
Wear, changeover frequency, product mix, and maintenance history all pull sustained speed below nameplate, and the gap is rarely the same across every station on the line.
Mapping Speed Across the Line
A station-by-station view shows where sustained speed drops below design rate.
| Station | Design Rate | Sustained Rate | Parity Gap |
|---|---|---|---|
| Filler | 380 CPM | 372 CPM | 2% |
| Labeler | 380 CPM | 340 CPM | 11% |
| Case packer | 60 CPM | 58 CPM | 3% |
| Palletizer | 12 CPM | 12 CPM | 0% |
See Where Your Line Loses Parity
Book a 30-minute session and iFactory AI will map sustained speed against design rate for your own line.
Why the Gap Grows Over Time
Four factors pull sustained speed away from nameplate rate, usually gradually enough that nobody notices until the gap is large.
Mechanical Wear
Worn components introduce micro-stops that lower average speed without a single clear failure.
Changeover Frequency
More frequent format changes reduce effective run time at full speed.
Product Mix Shift
Newer SKUs or packaging formats may run slower than the original design basis.
Deferred Maintenance
A machine running below potential speed is often compensating for a maintenance backlog.
Tracking Parity Over a Campaign
The bars below show an illustrative two-week trend in labeler sustained speed against the filler's rate.
A Composite View Across Lines
Parity gaps tracked across several packaging lines. Darker cells show a wider gap between design and sustained rate.
Rolling It Out Across Your Lines
iFactory AI arrives turnkey, built to connect to existing line PLCs and speed sensors.
Frequently Asked Questions
How is sustained speed different from what our PLC already reports?
Most PLCs report instantaneous or peak speed, which can look fine even while average sustained speed over a shift sits well below design rate. The system calculates the sustained figure that actually governs throughput. Support can walk through the calculation for your line data.
Does this account for planned changeovers and cleaning stops?
Yes, scheduled downtime is excluded from the sustained-speed calculation, so the parity gap reflects actual running performance rather than being skewed by planned stops.
Can this help us decide where to spend a maintenance budget?
Yes, a clear view of which station carries the widest parity gap gives maintenance planning a ranked target instead of a general sense that the line runs slow. See a ranked view across your own stations in a walkthrough.
Does this work across multiple packaging lines at once?
Yes, parity is tracked per station per line, and a plant-wide view lets you compare which lines carry the largest gaps rather than reviewing one line at a time.
How does this connect to our throughput planning?
Sustained speed at the true constraint station becomes the basis for realistic throughput targets instead of the original design rate. Ask support how this feeds planning tools you already use.
Plan Around the Speed Your Line Actually Holds
iFactory AI measures sustained speed station by station and names the true constraint. Book a walkthrough to see it on your own lines.