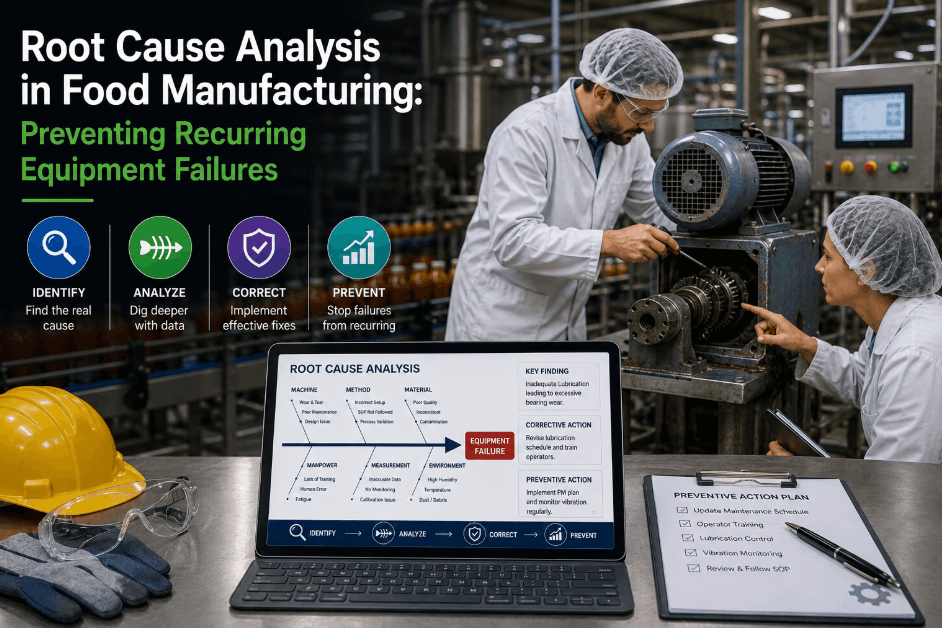
Every food plant investigates line stoppages, but many investigations end with a form that names a symptom and closes the ticket. A stoppage that is explained as "operator error" or "sensor fault" will usually come back, because the real cause was never reached. A good root cause analysis template guides the team from the event to the cause, then to a corrective action and a check that it worked. This checklist gives a ready structure for 5 Whys, fishbone and fault tree work, with the record fields auditors tend to expect. Teams building a template library can see how iFactory AI attaches machine data to a stoppage investigation and cut the guesswork.
Turn Every Line Stoppage Into a Cause You Can Fix for Good
Use these templates to move from what stopped to why it stopped, and to prove that the fix held.
Which Method Fits Which Stoppage
No single method suits every event. Match the depth of the tool to the weight of the problem.
Simple, single chain
Best for events with one likely path, such as a jam or a missed lubrication.
Several possible causes
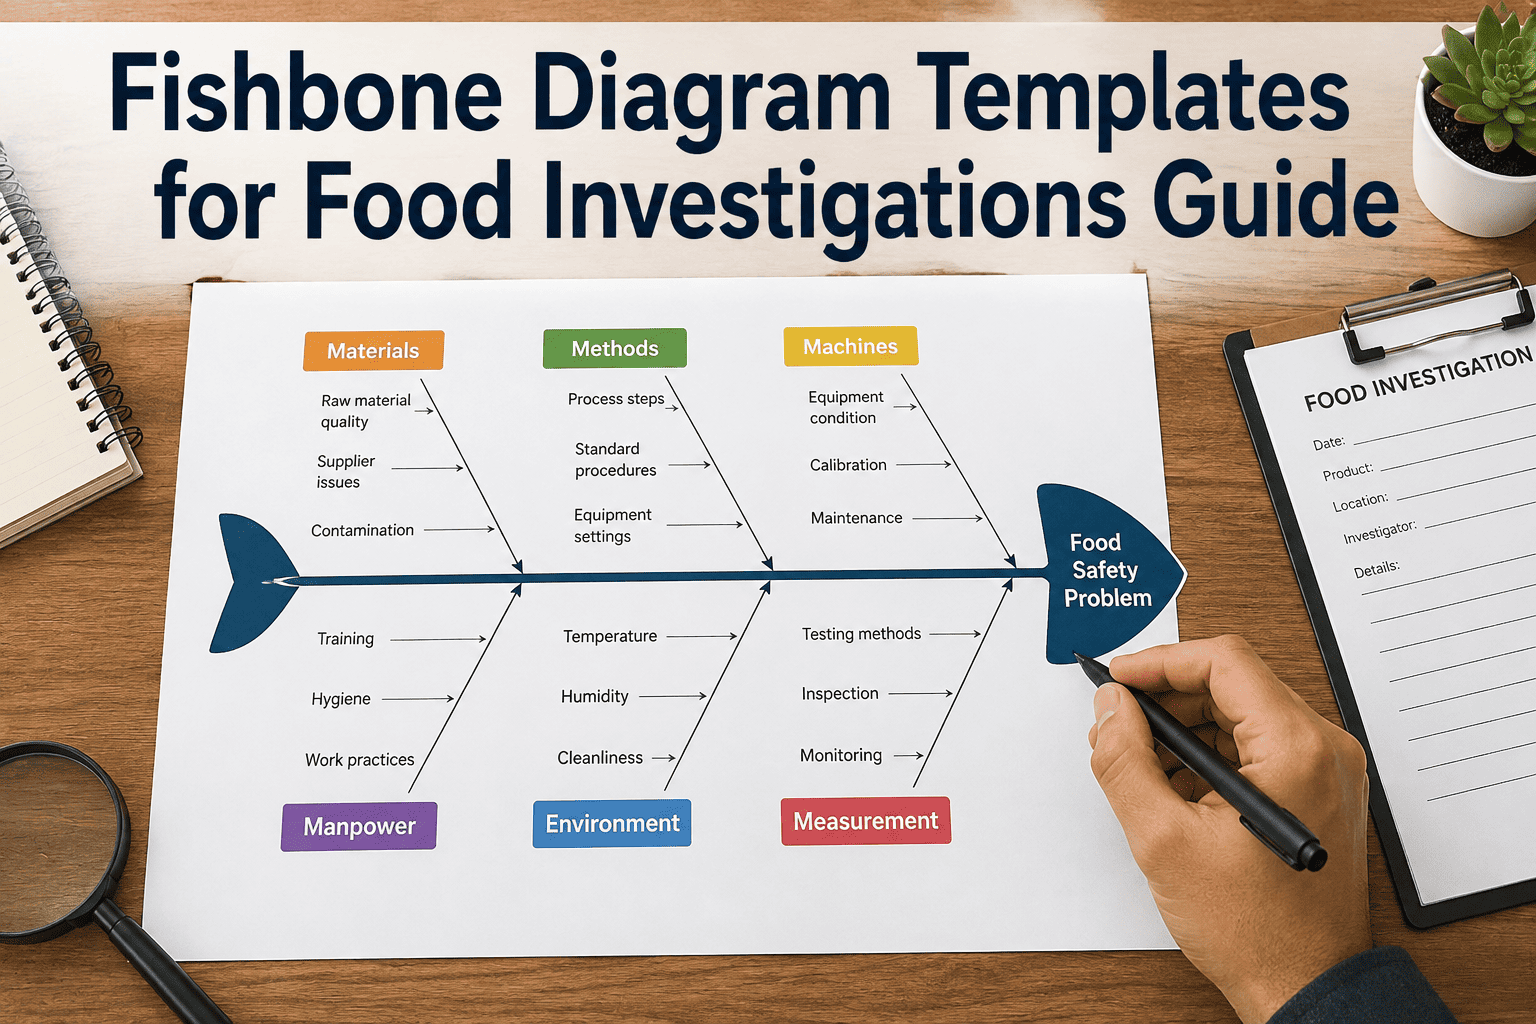
Best when machine, method, people and materials may all have played a part.
Complex or repeated
Best for serious, repeated or safety-related events with many combined causes.
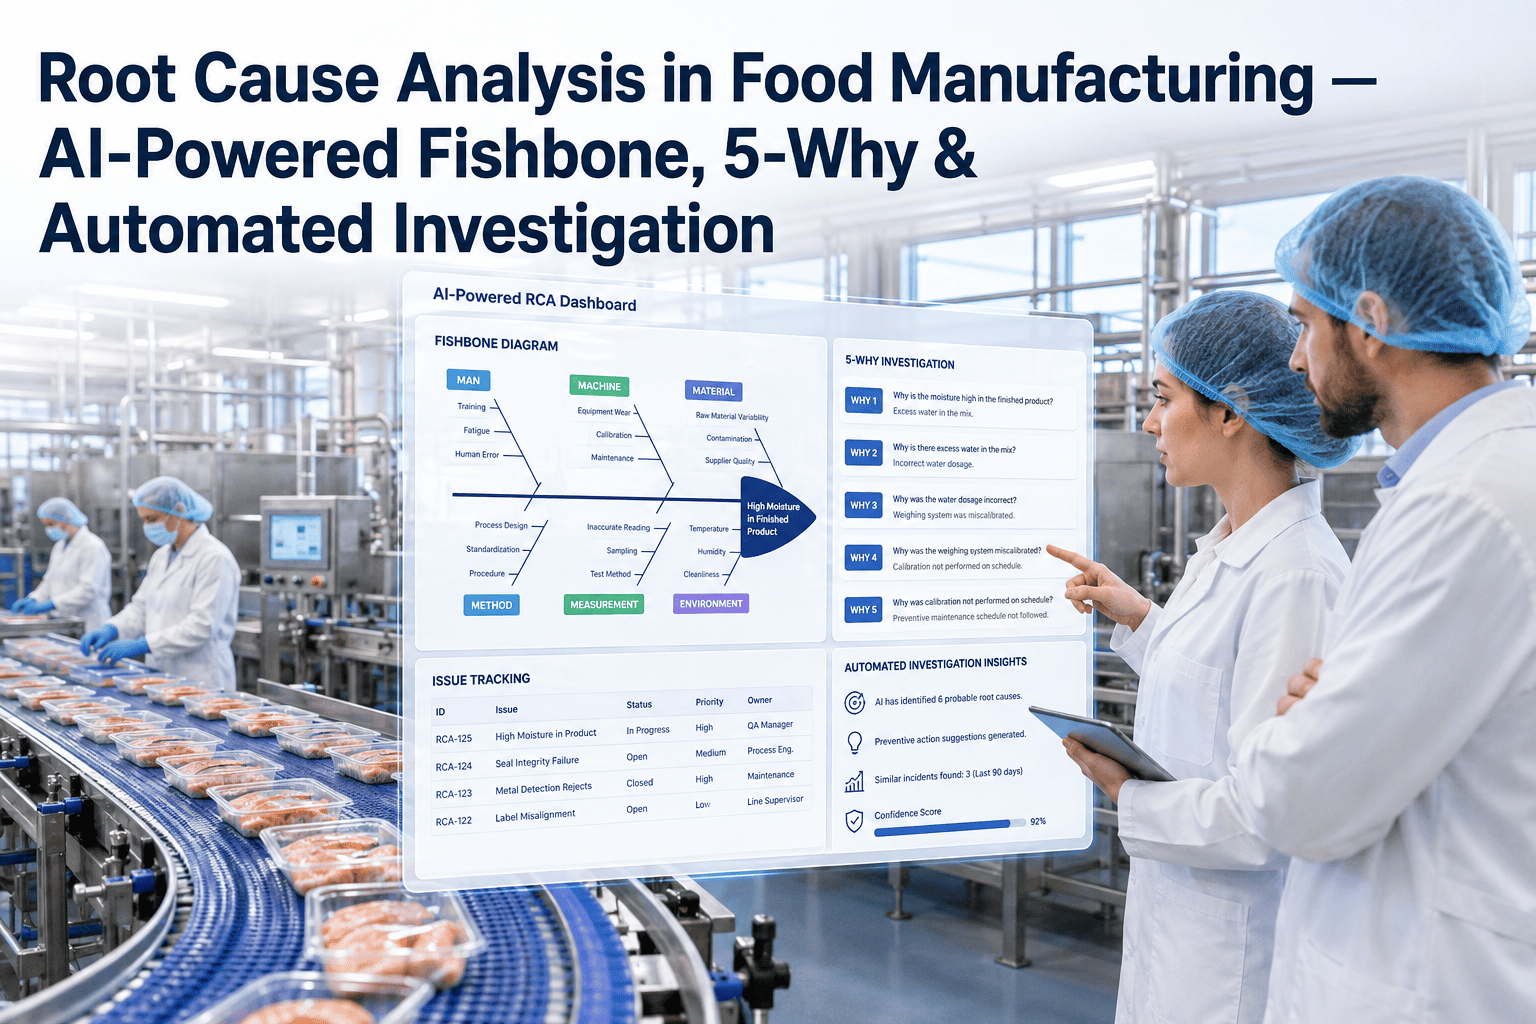
A 5 Whys Example, Drawn Out
Each answer becomes the next question. The chain below is an illustrative example, not a real incident.
Give Every Investigation Real Machine Evidence
Bring a recent stoppage to a 30-minute session and see how sensor history could have shortened the investigation.
The Fields a Complete Record Contains
Auditors commonly look for a clear trail from event to cause to action. Exact requirements vary by site, customer and standard.
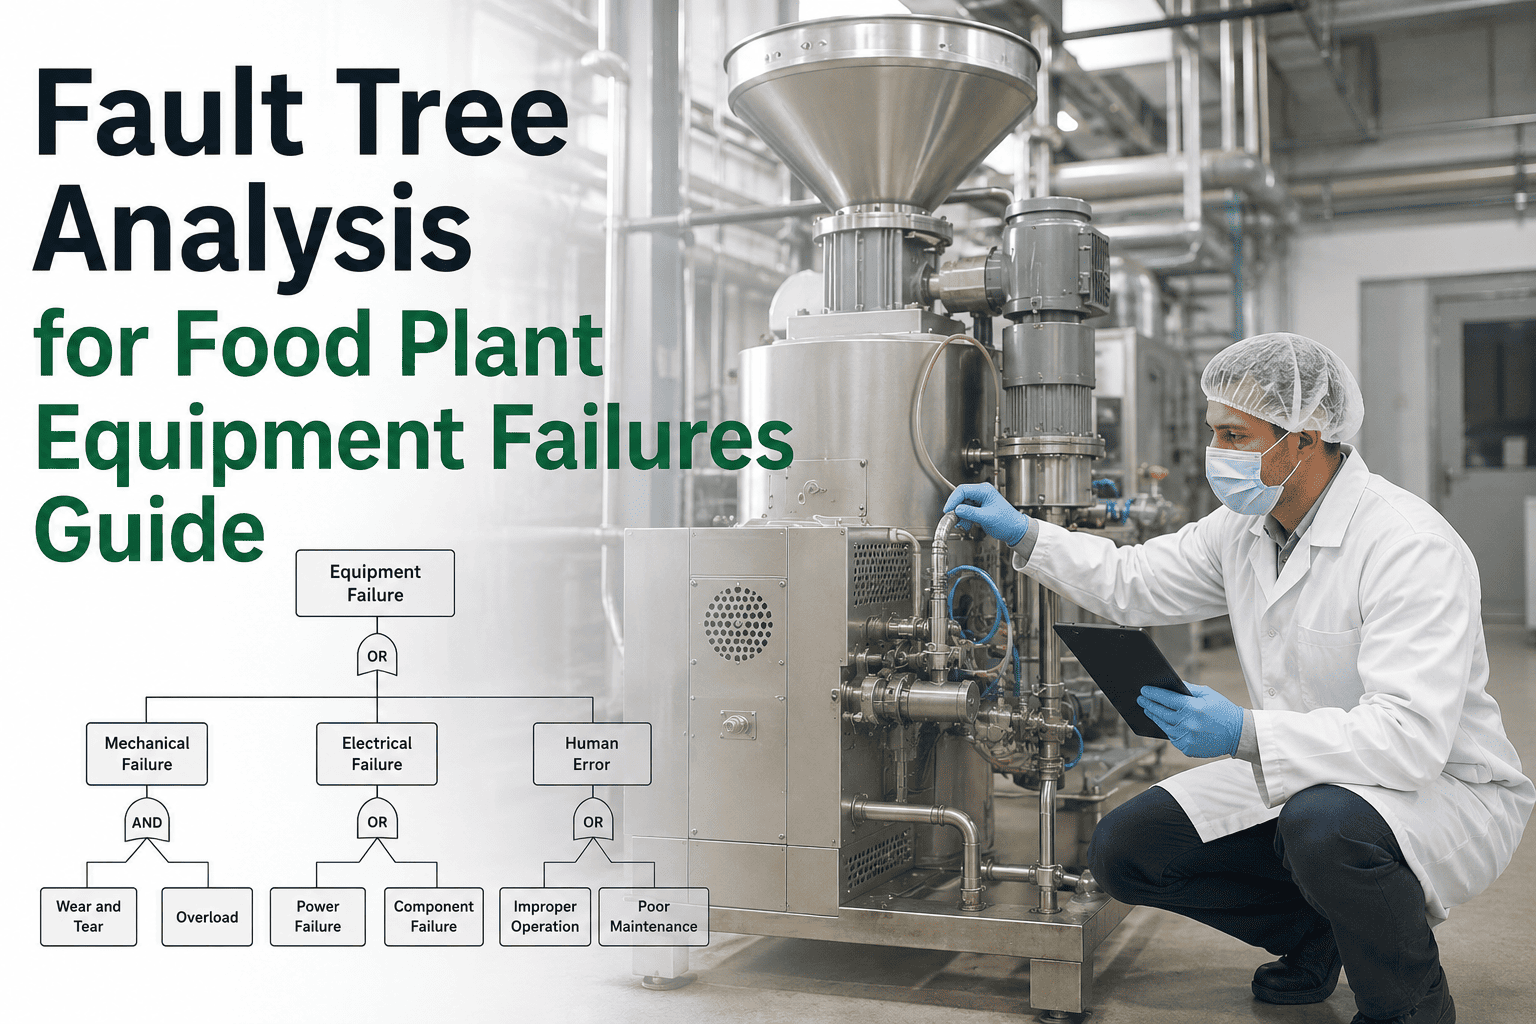
A Simple Fault Tree Layout
A fault tree starts with the top event and splits it into the ways it could have happened.
Questions to Ask by Stoppage Category
| Category | Key Question | Evidence to Pull |
|---|---|---|
| Mechanical | Was there a warning trend before failure? | Vibration, current, temperature history |
| Sanitation and CIP | Did cleaning change the machine state? | CIP logs, post-wash start-up data |
| Changeover | Was the setup completed to standard? | Changeover record, settings log |
| Material or packaging | Was an input out of specification? | Supplier lot, incoming checks |
| Utilities | Did air, power or water drop? | Utility trends, alarm history |
| Controls | Did a sensor or program fault trip it? | PLC alarm and event logs |
Spot the Repeat Offenders
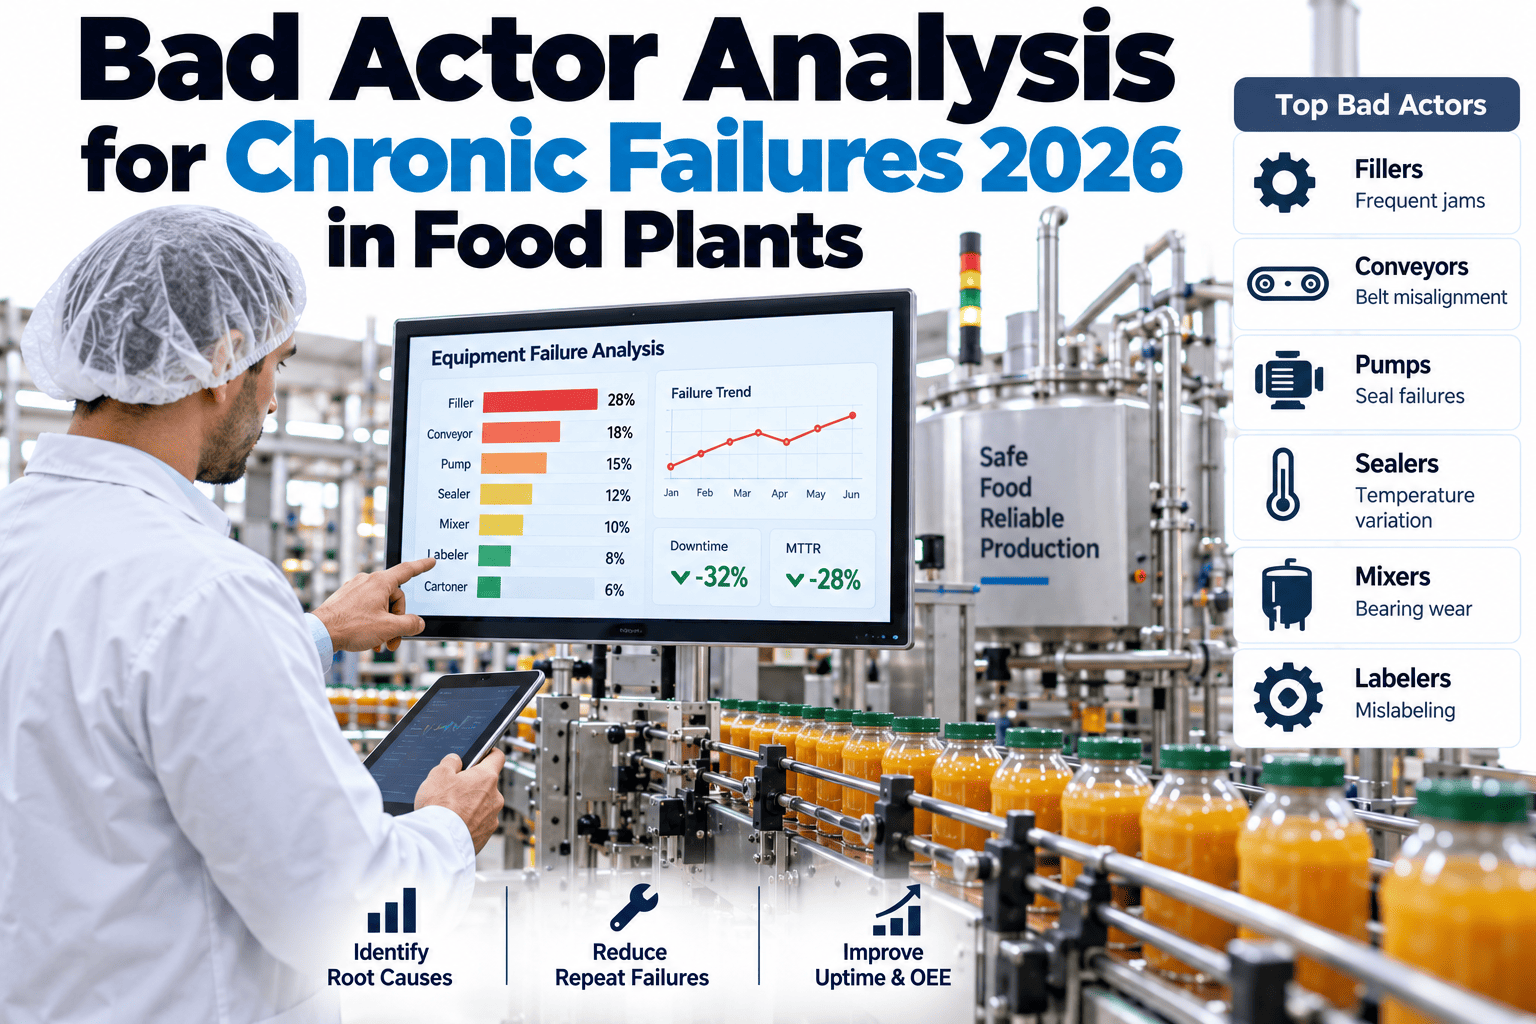
A small number of causes usually drive most stoppages. Ranking them shows where one fix removes many events.
A Composite Scenario: The Stop That Kept Coming Back
Picture a packing line that stops every few weeks. Each time the report says a sensor faulted, the sensor is cleaned and the line restarts.
A stronger investigation would pull the machine history and find a belt tension drift that triggers the sensor each time. The corrective action becomes a tension adjustment and a trend alert, and the repeat stops end.
Where iFactory AI Fits
Builds the timeline
Sensor, alarm and work order history are laid out around the stop for the investigation team.
Shows the warning signs
Trend data reveals whether the machine gave early signals that were missed.
Flags repeat causes
Recurring faults are grouped so teams see which causes keep coming back.
Tracks the follow-up
Corrective actions link to work orders and to monitoring that confirms the fix held.
Frequently Asked Questions
Which RCA method should a food plant use for line stoppages?
Use 5 Whys for simple, single-path events, a fishbone when several factors may be involved and a fault tree for serious or repeated stoppages. Many plants keep all three as templates and choose by event size. The key is that each method ends in a verified cause and a tracked action. You can see how machine data supports each of these methods in a short session.
What should a line stoppage RCA record include for audits?
Records usually cover the event details, product impact, containment, method used, evidence, verified root cause, corrective and preventive actions, owners, dates and an effectiveness check. Exact needs depend on your site, customers and certification standard, so confirm with quality. A clear trail from event to closure matters most. Ask for a template review against your current audit expectations.
How do we stop "operator error" from becoming the default cause?
Treat it as a symptom and keep asking why the error was possible. Look at training, setup instructions, machine design and whether the machine gave any warning. Objective data helps, because trends can show a fault was already developing. Fixing the system, not the person, prevents repeats. Explore how trend evidence changes the story behind a stoppage.
How do we know a corrective action actually worked?
Set an effectiveness check when the action is created, with a date and a measure, such as no repeat of the fault over a defined period. Monitoring data can confirm the machine now behaves normally. Without that check, an action is only a hope. Try a walkthrough of effectiveness checks tied to live machine data.
How can software shorten the investigation time?
It gathers the sensor history, alarms and work orders around the event so the team starts with evidence instead of memory. It also highlights repeated causes and past fixes. Shorter investigations leave more time for the corrective action itself. Join a session that rebuilds a recent stoppage timeline from your data.
Stop Closing the Same Stoppage Twice
iFactory AI gives every investigation the machine evidence it needs and tracks the fix until it holds. Book a walkthrough on one of your recent stoppages.