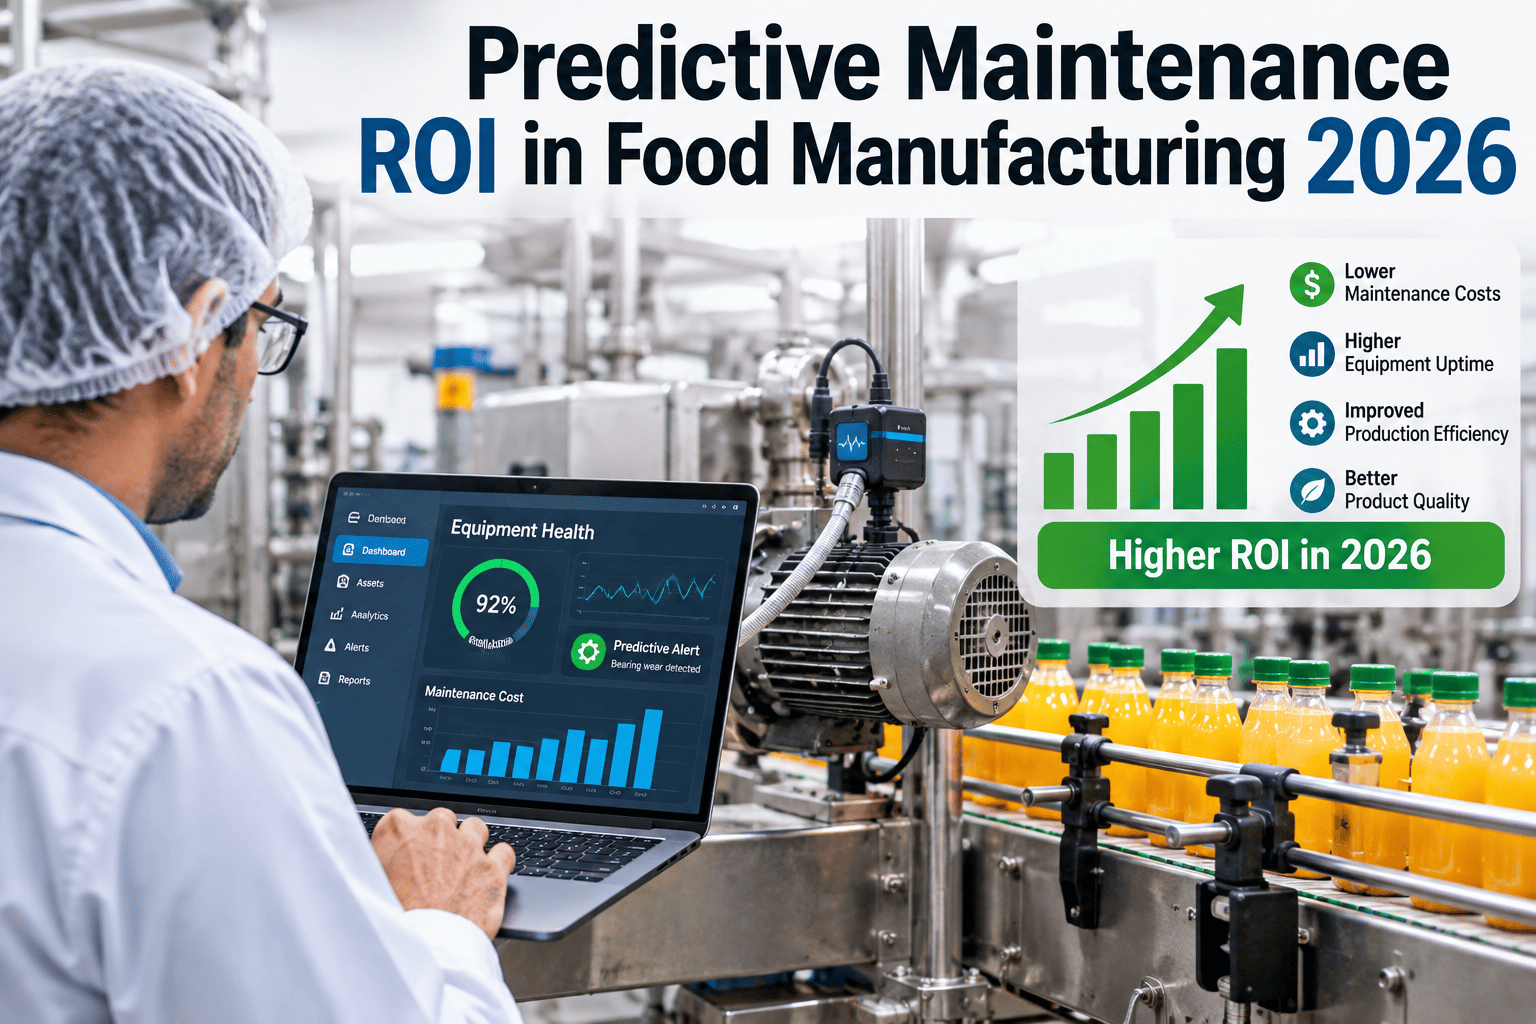
Every food plant manager has run some version of the predictive maintenance ROI math, and most of them stop at the same two numbers: downtime hours avoided and maintenance cost reduced. Those two numbers alone already justify most PdM programs, but they routinely understate the real return by leaving out the line that hurts food manufacturers more than any other industry — the batch of product that has to be scrapped when a filling or packaging line fails mid-run. A dropped line in discrete manufacturing loses time. A dropped line in food manufacturing loses time and the perishable product already committed to it. iFactory's predictive maintenance layer is built around that difference, and the numbers below reflect what a realistic 2026 business case actually looks like.
FOOD & BEVERAGE — PREDICTIVE MAINTENANCE ROI
What Predictive Maintenance Actually Returns in a Food Plant in 2026
Downtime cost, product loss, and maintenance labor all move together in a food plant, but most ROI models only capture one of the three. iFactory's PdM layer connects line sensors, quality data, and maintenance records so the business case reflects everything a failure actually costs — not just the hours the line was stopped.
$8K–$25K
Typical unplanned downtime cost per hour in food manufacturing
30–45%
Downtime reduction achievable with a mature PdM program
9–14 mo
Typical payback period for sensor and software investment
Where the Return Actually Comes From
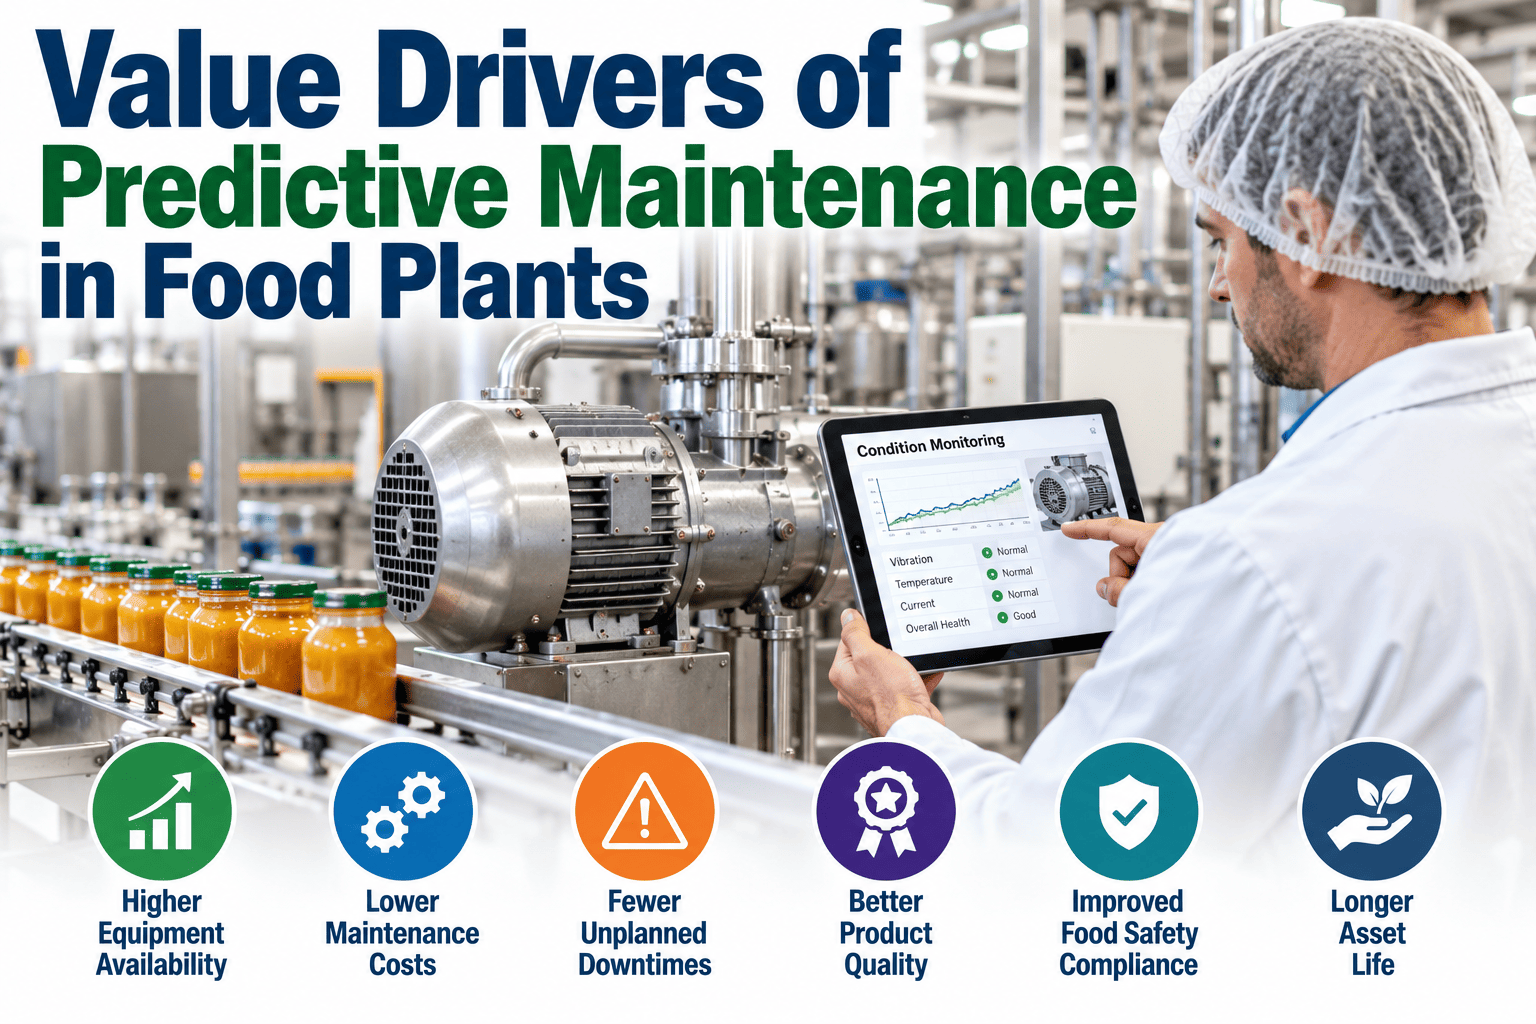
A predictive maintenance business case built on downtime hours alone leaves real money on the table. The value drivers below are the ones that consistently show up in a food plant's numbers once maintenance, quality, and production data are looked at together.
Avoided Unplanned Downtime
Fewer emergency stops on filling, packaging, and processing lines translate directly into more scheduled production hours per week.
Product and WIP Loss Avoided
A mid-run failure often means the entire batch in progress is scrapped or reworked, not just the repair time — the largest and most overlooked line.
Lower Emergency Repair Costs
Planned repairs on a known failure typically cost a fraction of an emergency call-out, rush parts freight, and overtime labor combined.
Extended Asset Life
Catching wear early before it cascades into connected equipment extends the useful life of motors, compressors, and conveyor systems.
Reduced Spare Parts Inventory
Knowing which components are actually degrading lets a plant carry targeted stock instead of broad just-in-case inventory.
Fewer Compliance Exposures
Fewer unplanned stops mean fewer temperature excursions, sanitation re-runs, and the documentation gaps that follow an emergency shutdown.
The Line Most ROI Calculations Leave Out
When a filling or packaging line fails mid-run, the batch of product already committed to that line is frequently unsalvageable. Most ROI worksheets count the repair time and the maintenance labor, but skip the cost of the milk, dough, batter, or beverage concentrate that went into the scrap bin with it. For a high-value product running at speed, that single line item is often larger than the downtime cost itself.
Building this into the business case is straightforward once production and quality data are connected: take the average batch value in progress at the moment of failure and multiply it by how often failures happen mid-batch rather than between runs. For most plants, that number changes the entire funding conversation.
Payback Speed by Maintenance Maturity
Two plants can install identical sensors and see very different payback timelines, because the starting point of their maintenance program determines how much low-hanging value is still on the table.
Reactive Maintenance
Repairs happen after failure, with high emergency labor and parts premiums. The fastest payback stage because the starting waste is largest.
Often under 9 months
Calendar-Based PM
Scheduled maintenance replaces some emergencies but still services healthy components and misses failures between intervals.
Typically 9–14 months
Basic Condition Monitoring
Vibration or temperature sensors exist on critical assets but are not yet connected into a unified alerting and work order flow.
Typically 12–18 months
Mature Predictive Program
Sensors, quality data, and CMMS are unified, and remaining gains come from refinement rather than eliminating obvious waste.
Longer, but compounding
Model Your Own Plant's PdM Payback Timeline
iFactory can walk through your actual downtime hours, batch values, and current maintenance spend to show a realistic payback range for your specific lines — before any commitment.
Worked Examples Across Four Food Categories
The numbers below are representative worked examples, not guarantees — every plant's payback depends on its own downtime frequency, batch value, and current maintenance baseline. They illustrate how the same value drivers play out differently by category.
| Category |
Primary Failure Point |
Downtime Reduction |
Typical Payback |
| Dairy Processing |
Compressor and pasteurizer pump failures |
30–40% |
9–12 months |
| Bakery Production |
Oven conveyor and proofer motor wear |
25–35% |
10–14 months |
| Snack Manufacturing |
Fryer and high-speed packaging line seals |
35–45% |
8–12 months |
| Beverage Bottling |
Filler valve wear and capper misalignment |
30–45% |
9–13 months |
High-speed categories like snack and beverage tend to see faster payback because line speed amplifies both the downtime cost per minute and the batch value lost on a mid-run failure — the same failure costs more per hour the faster the line runs.
Building the Business Case in Four Steps
1
Establish True Downtime Cost
Track every unplanned stop for 60 to 90 days and multiply hours by fully loaded production value, including scrapped product in progress.
2
Identify the Highest-Value Assets
Rank equipment by combined failure frequency and downstream production impact, not just repair cost alone.
3
Pilot on One or Two Lines
Run a focused pilot on the assets identified in step two rather than instrumenting the entire plant at once.
4
Model Payback Against Real Numbers
Apply a conservative 25 to 35 percent downtime reduction to your baseline figure and compare it against pilot investment cost.
What Speeds Up or Slows Down Your Payback
Downtime Cost per Hour
Higher-value, higher-speed lines recover their investment faster because every avoided hour is worth more.
Failure Frequency
A plant with frequent unplanned stops has more low-hanging value to capture in the first months of deployment.
Batch Value in Progress
Categories with expensive raw materials mid-batch see the product-loss line dominate the payback calculation.
Data and Integration Readiness
A plant with existing sensors and a connected CMMS reaches value faster than one starting from paper logs.
Frequently Asked Questions
What is a realistic first-year ROI for predictive maintenance in food manufacturing?
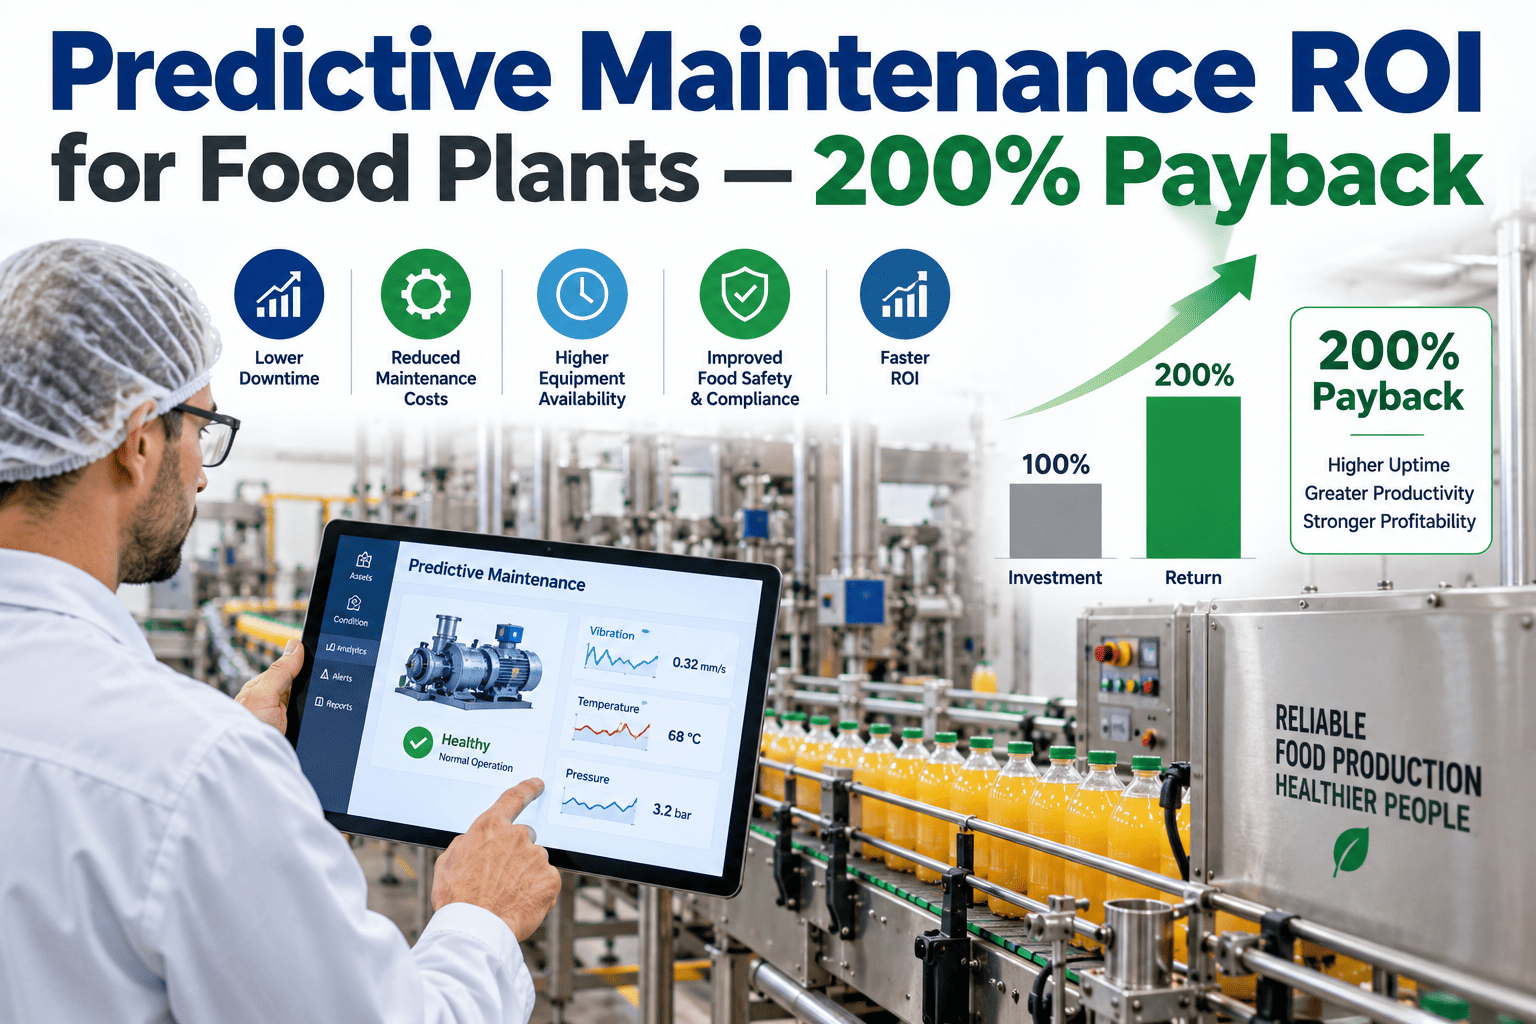
Most food plants see returns in the range of 3 to 5 times their initial investment within the first year, driven primarily by avoided downtime and reduced emergency repair costs. Plants that also capture the product-loss line from mid-run failures often see the return land at the higher end of that range, since a single avoided batch loss can be worth more than several avoided repair events combined.
Does predictive maintenance ROI look different for high-speed lines versus slower batch processes?
Yes — high-speed lines like snack frying and beverage filling tend to see faster payback because both the downtime cost per minute and the value of product lost mid-run scale with line speed. Slower batch processes like bakery proofing still generate strong returns, but the payback window is typically a few months longer since less value is lost per hour of downtime.
Do we need a full CMMS in place before predictive maintenance can show a return?
No — a plant can start capturing PdM value with sensor data and alerting alone, though the returns compound faster once alerts flow directly into a connected work order system. You can
talk to our team about how iFactory connects to whatever maintenance system you currently run, including paper-based logs.
How do we calculate the product loss line if we have never tracked it before?
Start with the average batch value in progress on your highest-volume line and estimate how often failures occur mid-batch versus between scheduled runs, using maintenance logs from the past six to twelve months. Even a conservative estimate usually reveals that this line is larger than most teams assume, which is exactly why it belongs in the business case from the start.
How quickly can we get a real ROI estimate for our specific plant?
Most plants can get a directional payback estimate within a single working session once downtime hours, batch values, and current maintenance spend are shared. A full pilot typically confirms that estimate within the first 60 to 90 days of live data.
Book a demo to walk through the numbers for your own lines.
Build a PdM Business Case That Captures the Full Cost of a Failure
Downtime hours are only part of what a food plant failure costs. iFactory connects line sensors, quality data, and maintenance records so your ROI case reflects the product loss, labor, and compliance risk that reactive maintenance quietly carries.