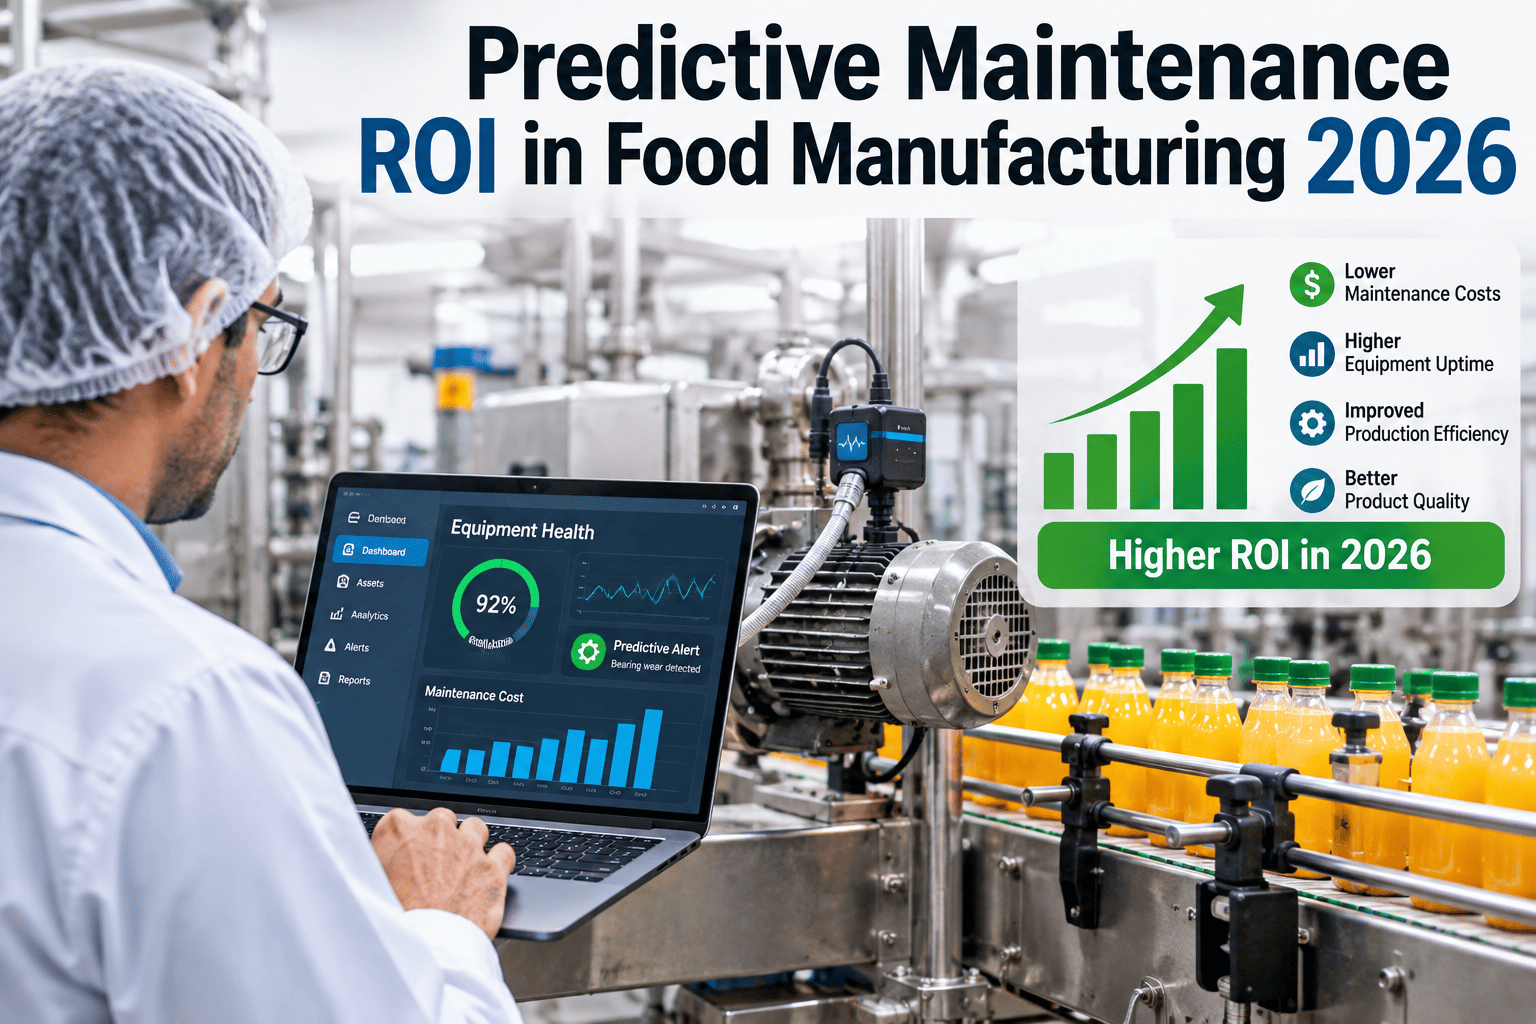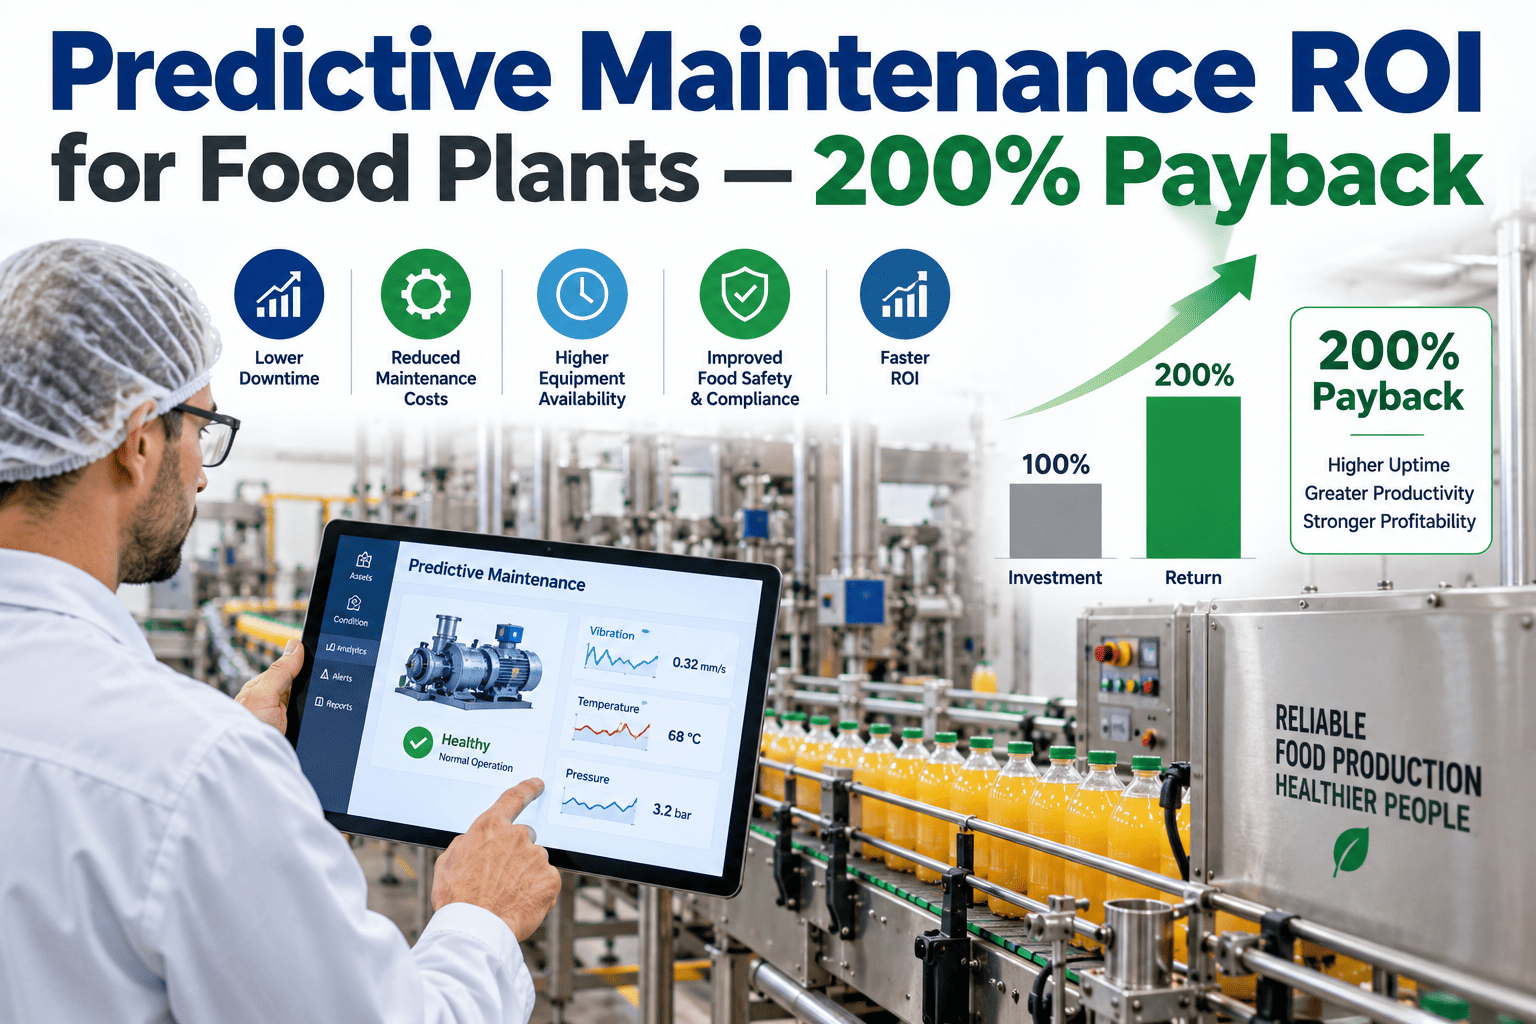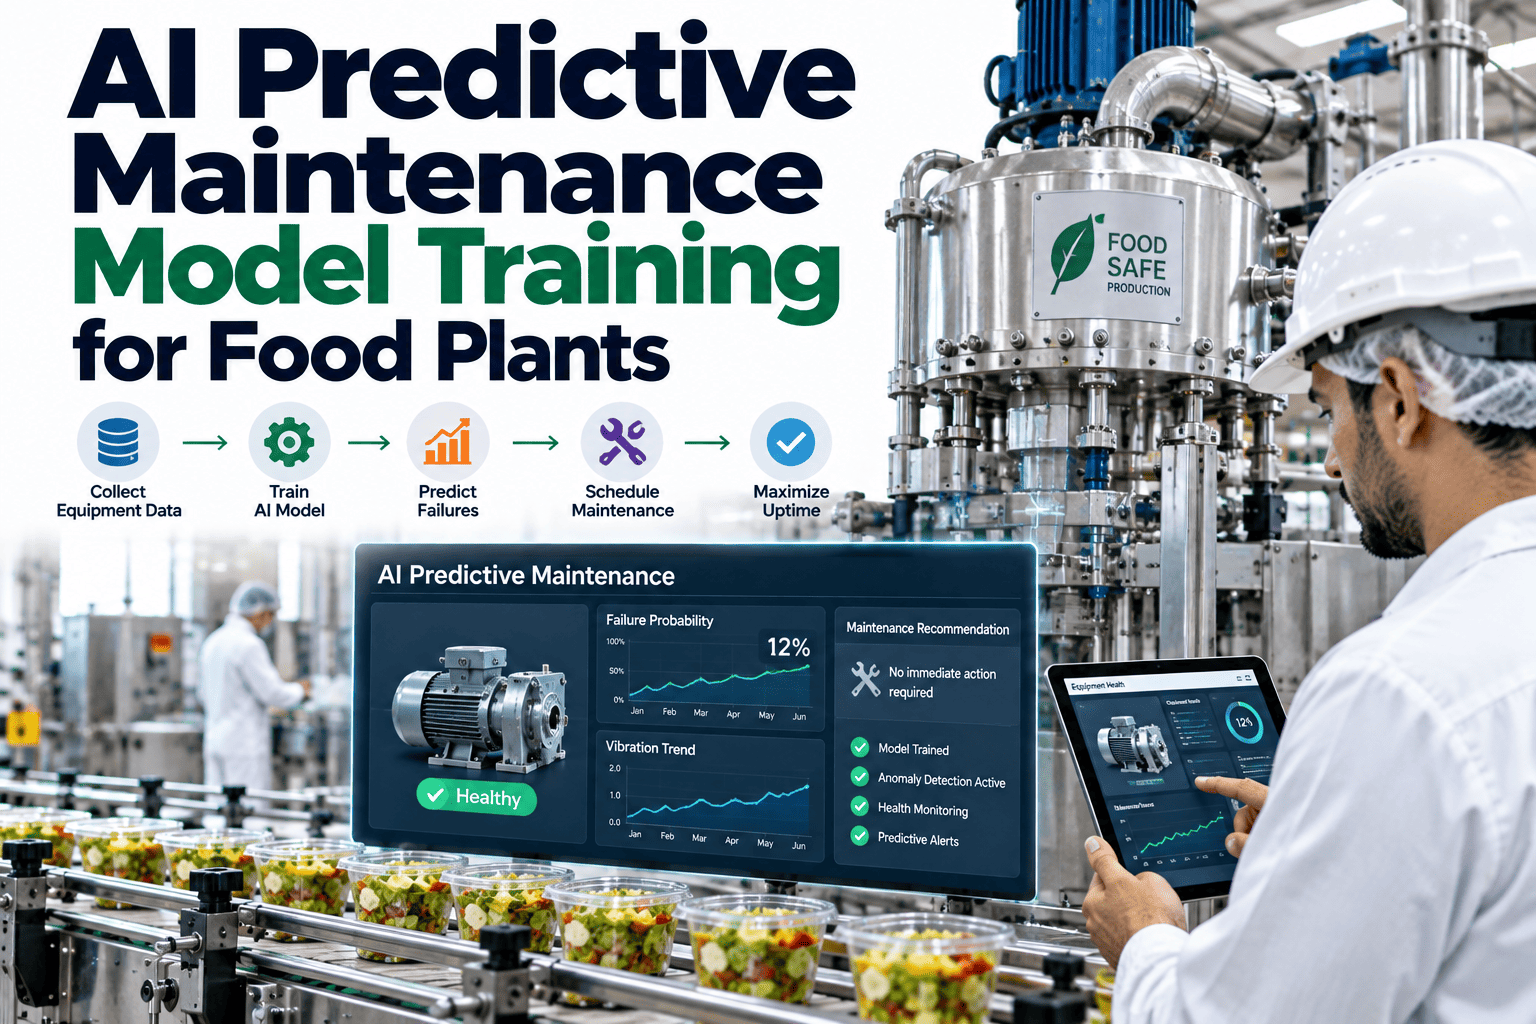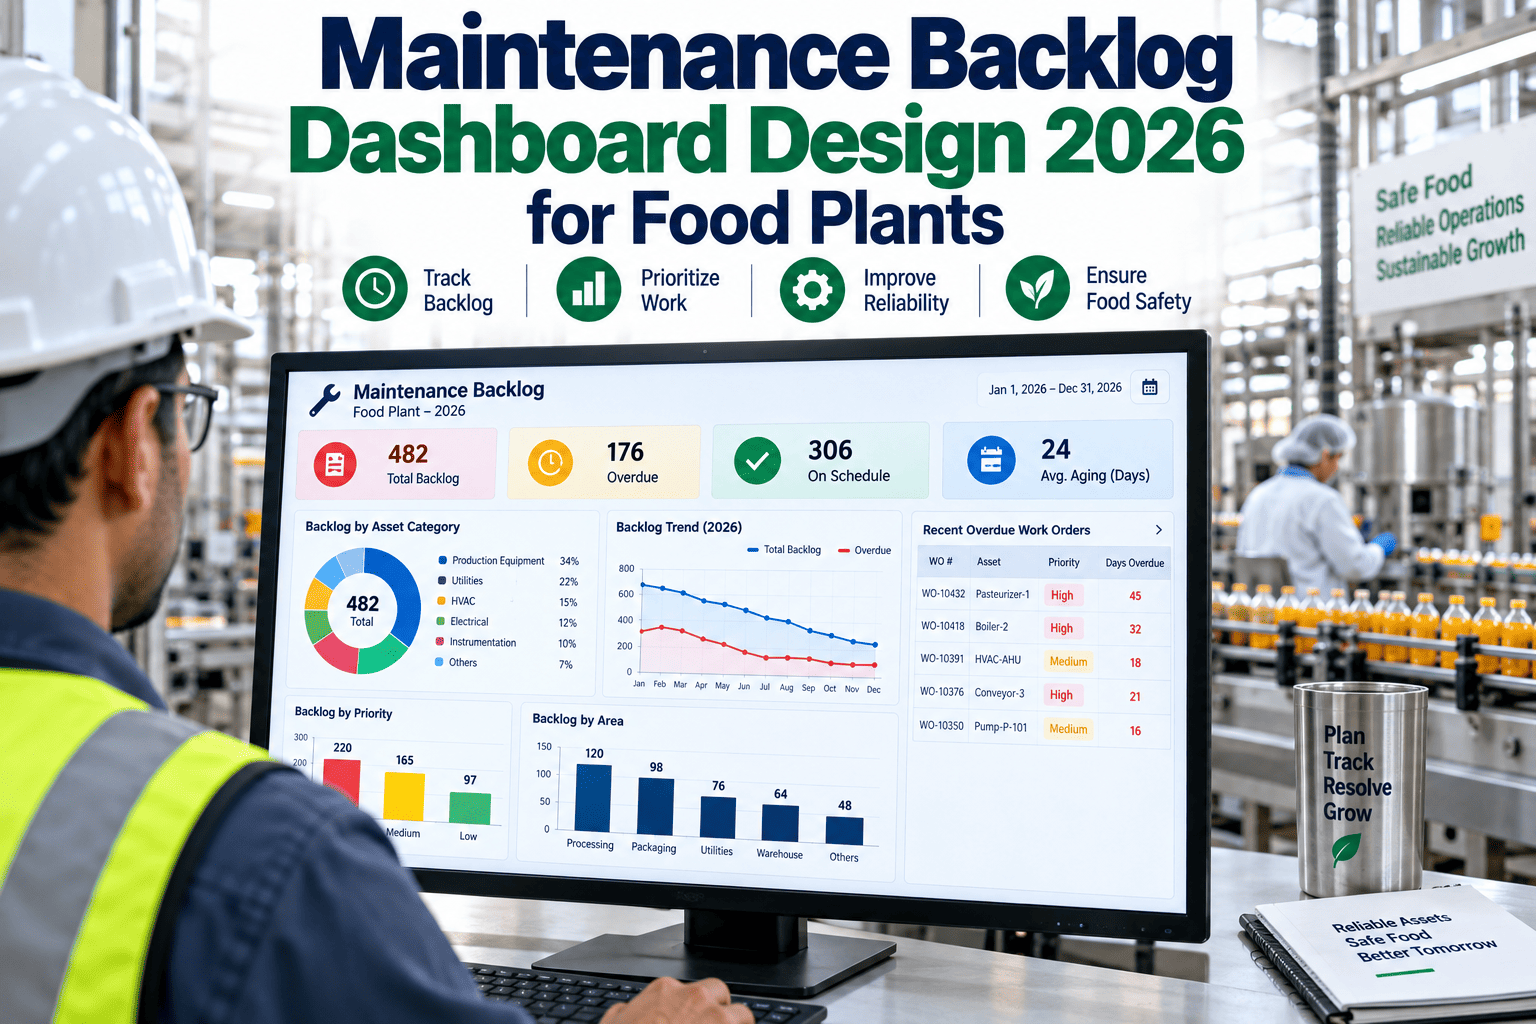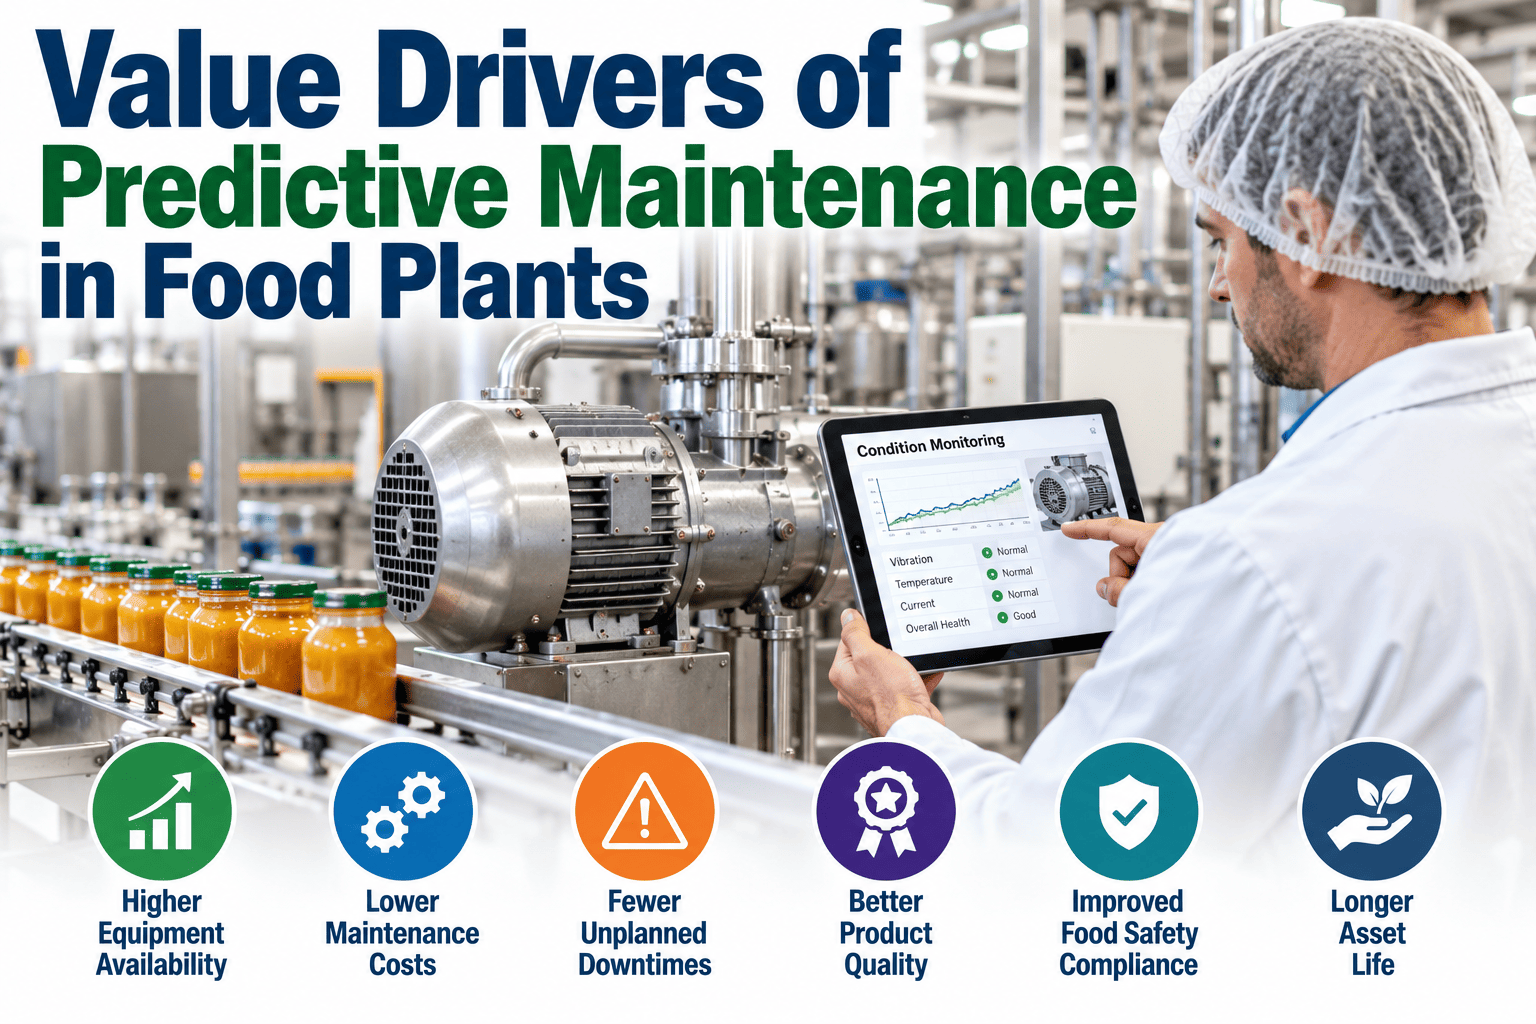
Ask five different people at a food plant why predictive maintenance matters and you will likely get five different answers — the maintenance manager says fewer breakdowns, the plant controller says lower parts spend, and the quality lead says fewer temperature excursions. All five are right, because predictive maintenance in a food plant delivers value through five distinct, measurable channels rather than one single number. Understanding each driver on its own is what turns a vague "PdM helps" into a business case a plant can actually fund. Book a demo to see which of these five drivers matters most for your specific lines.
The Five Ways Predictive Maintenance Actually Pays Off in a Food Plant
Downtime avoided is the headline number, but four other value drivers compound alongside it — faster repairs, smarter spare parts stocking, lower energy draw, and protected shelf life. iFactory tracks all five from one connected data layer instead of five disconnected spreadsheets.
This is the driver every plant already tracks, and for good reason — it is usually the largest single number in the business case. Catching a failing bearing, a drifting valve, or a slipping belt while it is still a scheduled repair instead of an emergency stop is the difference between a planned five-minute changeover and an unplanned two-hour line-down event.
Mean time to repair does not just depend on how fast a technician works — it depends on how much time is spent diagnosing the fault and finding the right part before any wrench turns. When a predictive alert already names the failing component, the technician arrives with the correct part in hand instead of starting the clock with a diagnosis.
Most plants carry broad safety stock because they cannot predict which component will fail next, so they stock a little of everything just in case. Once condition data shows which specific components are actually degrading, that broad stock gets replaced by targeted, just-in-time ordering — freeing working capital without adding stockout risk on critical spares.
iFactory connects downtime logs, maintenance records, energy meters, and cold chain data into one view, so every driver below is measured, not estimated.
A compressor running with a fouled condenser, a motor bearing running hot, or a conveyor drive fighting misalignment all draw more power than the same equipment running healthy — and none of that extra draw shows up as a failure until it eventually does. Predictive monitoring catches the efficiency drift itself, not just the eventual breakdown it causes.
In a food plant, a refrigeration or freezer failure is not only a production problem — it is a food safety event with a compliance clock attached. Catching compressor degradation before a cold chain break protects the shelf life of everything currently in that zone, and keeps the documentation trail intact for the next HACCP or SQF audit.
How the Five Drivers Compound Together
None of these five drivers operate in isolation — a faster repair also means less downtime, and a right-sized spare parts stock also means faster repairs because the correct part is already on the shelf. The table below shows how each driver reinforces the others.
| Driver | Primary Metric It Improves | Secondary Effect |
|---|---|---|
| Downtime Avoided | Unplanned stop frequency | Protects throughput and reduces overtime recovery labor |
| MTTR Reduced | Average repair duration | Shrinks the downtime window even when a stop does occur |
| Spare Parts Optimized | Inventory carrying cost | Feeds faster MTTR by keeping the right part in stock |
| Energy Saved | kWh per unit of output | Often the earliest visible sign of the wear driving future downtime |
| Shelf Life Protected | Temperature excursion frequency | Reduces product loss and strengthens audit readiness |
Frequently Asked Questions
Downtime, repair speed, spare parts, energy, and shelf life all move together once they are measured from the same connected data layer. See what that looks like for your own lines.