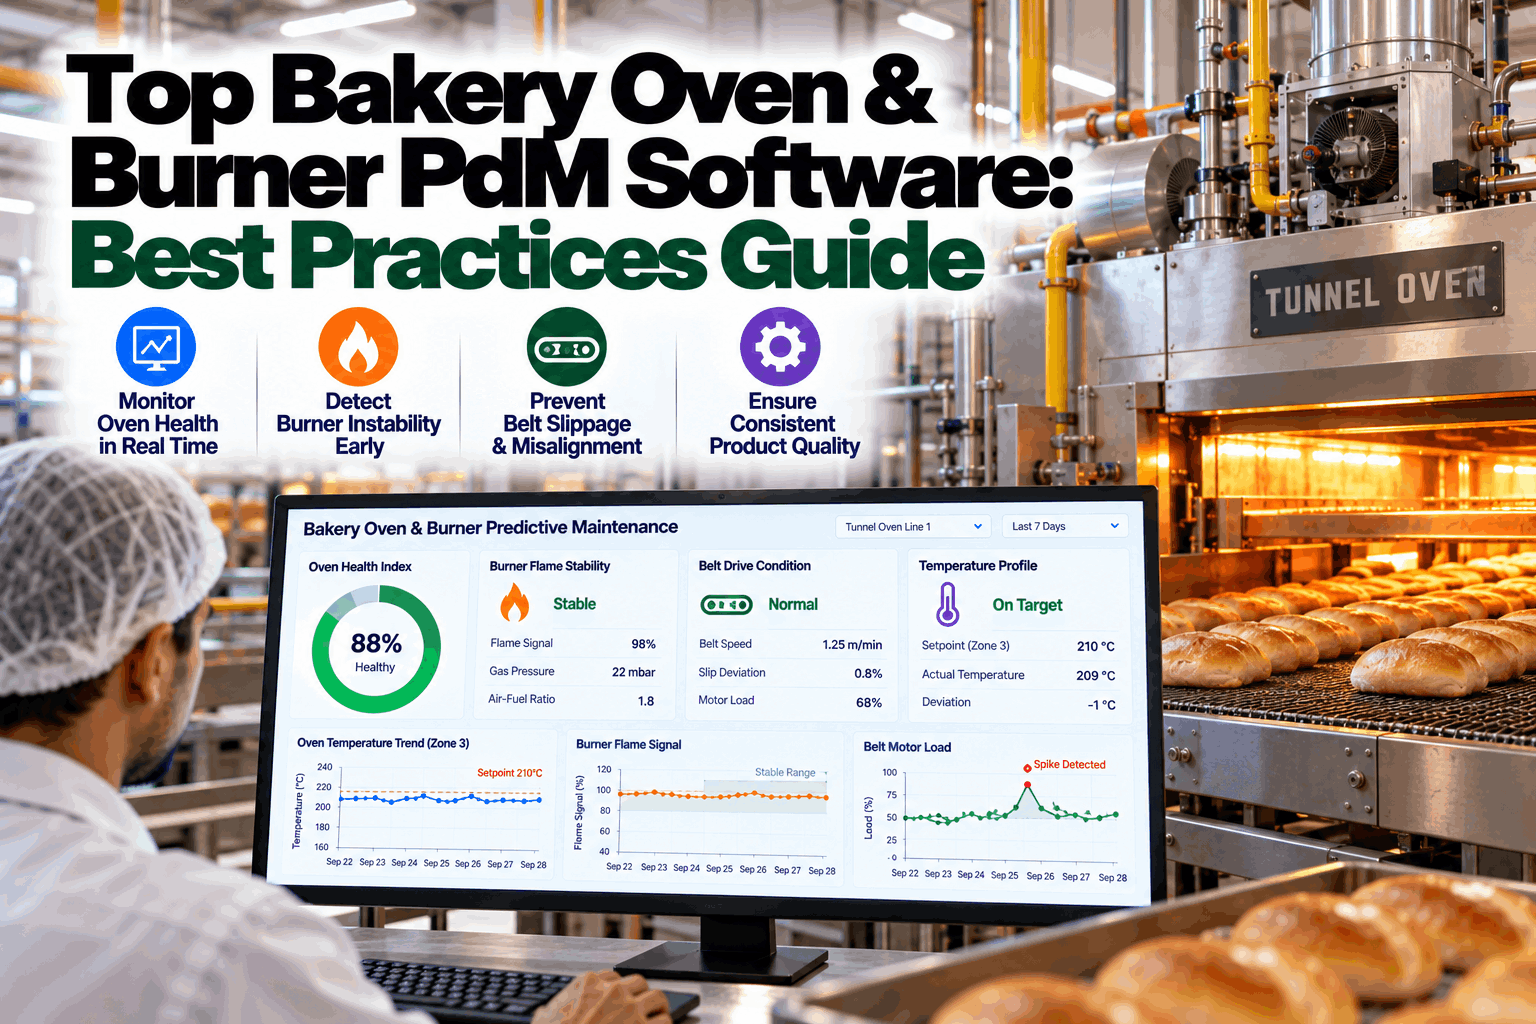
A tunnel oven stop is one of the most expensive events in a bakery. Everything inside is usually scrap, the line behind it backs up, and restarting means bringing zones back to temperature before a single good product comes out. Most oven stops start small: a band that needs more tracking corrections every hour, a support roller that begins to drag, a burner whose flame signal weakens over weeks. This best-practices guide covers how real-time analytics prevent band slippage, burner flame instability and thermal drift, and our team can map the signals your oven already produces.
Bakery Oven and Burner Predictive Maintenance: Best Practices to Prevent Band Slippage, Flame Instability and Thermal Drift
Band tracking, drive torque, flame signal strength and zone firing rates trended continuously, so oven problems are fixed in planned stops, not mid-bake.
Why Tunnel Oven Stops Cost More Than the Downtime
A tunnel oven is the heart of an industrial bakery, and the least forgiving machine on the line. When it stops unexpectedly, product in the baking chamber is usually lost, upstream proofers and dividers have to stop or dump dough, and the restart takes time while zones return to temperature and the band clears. The oven also carries the highest fire and explosion hazards in the plant, which is why burner management and combustion safeguards are tightly regulated.
Most oven problems give plenty of warning. Band tracking systems work harder long before a band runs off; drives pull more torque before a roller seizes; flame scanners report weaker signals before a burner locks out. The problem is that these signals live inside the oven PLC and the burner management system, where nobody trends them. Getting them onto one timeline is the first step, and our engineers can show what yours already record.
Where Tunnel Oven Failures Start
| Subsystem | Failure mode | Early signal | Best data source |
|---|---|---|---|
| Oven band (steel or mesh) | Mistracking, edge damage, stretch | More frequent tracking corrections; growing position offset | Tracking sensors and actuator activity |
| Drive and tail drums | Lagging wear, bearing wear, slip | Band speed versus drum speed difference; vibration | Encoders, drive current, accelerometers |
| Support rollers and skids | Seized rollers, worn skids | Drive torque rises at constant load | Drive current or torque |
| Tensioning system | Tension drift, cylinder leaks | Tension cylinder pressure drifts | Pressure transmitter |
| Burners and flame supervision | Dirty scanners, electrode wear, unstable flame | Flame signal strength weakens or fluctuates | Burner management system |
| Combustion and exhaust fans | Bearing wear, imbalance, fouling | Vibration, current, airflow change | Accelerometers, drive data |
| Insulation and seals | Heat loss, damaged doors or seals | More firing needed to hold zone setpoints | Zone temperatures and firing rates |
Each of these signals is easier to act on when it is trended rather than alarmed. A site review lists which ones your oven already exposes.
Best Practice 1: Trend the Tracking System, Not Just Its Alarms
Band tracking is a control loop: sensors detect the band edge, and cylinders steer a drum or roller to correct it. When that loop works harder every day, something is changing. Belt maker Steinhaus points to three families of causes: oven alignment and temperature, drive and tensioning equipment, and the band itself. It notes that a band permanently tending to one side is nearly always a sign that something is wrong with oven alignment, and that uneven temperature across the band width also causes mistracking.
Plants that trend these values catch alignment and tension problems while they are still adjustments, not band replacements. Our team can set up the first tracking trends in days.
Best Practice 2: Watch Drive Torque and Band Slip
The oven drive is a good early-warning instrument because everything that adds drag to the band shows up as torque. A seized support roller, a skid that has lost its surface, or a tension setting that has crept up all make the drive work harder at the same speed and load. Comparing band speed, measured by an encoder on a non-driven roller, with drive drum speed shows slip, which usually starts before visible damage.
Trending torque against band load and oven temperature separates real mechanical drag from normal variation. We can show you what a seized roller looks like in the data.
Best Practice 3: Trend Flame Signal Strength and Firing Rate
Burner management systems supervise every flame with UV or infrared scanners or flame rods. They trip the burner when the signal drops below a threshold, which protects the oven, but the trip arrives without warning. The same signal, trended over days, tells a different story. A slowly weakening flame signal usually means a dirty sight glass, an ageing scanner or a burner drifting away from its correct air-to-gas ratio. A signal that fluctuates more than usual points to flame instability.
Weakening or noisy signals flag scanner, electrode or combustion problems before a lockout.
A zone that needs more firing to hold the same setpoint is losing heat or burning poorly.
Rising retries on one burner show ignition wear early.
These trends complement, and never replace, the burner management system’s safety functions. See the burner views in a demo.
Best Practice 4: Align PdM With NFPA 86 Safety Testing
NFPA 86, the Standard for Ovens and Furnaces, sets minimum inspection and testing requirements for combustion safeguards. They include testing safety interlocks at least annually, verifying the set points of temperature, pressure and flow safety devices at least annually, and seat leakage testing of safety shutoff valves at least annually, with records kept. Your safety program and authority having jurisdiction determine the full scope for your ovens.
Predictive maintenance does not replace these tests, but it makes them more useful. Trends collected between tests show which devices are drifting, which burners are closest to their limits and which valves are cycling most. The annual test then becomes a confirmation of known condition rather than a surprise.
Our specialists can show how test records and trends sit together.
Best Practice 5: Catch Thermal Drift Before It Reaches Product
Thermal drift is the slowest oven failure and the easiest to miss. Insulation degrades, door seals harden, exhaust dampers stick, and burners gradually need more firing to hold the same zone temperatures. Product quality drifts with it: colour, moisture and bake loss change a little at a time, and operators compensate by adjusting setpoints until nobody remembers what normal looked like.
| Signal | What drift looks like | Likely cause |
|---|---|---|
| Firing rate at constant setpoint | Slow climb over weeks | Insulation or seal losses, burner efficiency loss |
| Zone temperature variability | Wider swings around setpoint | Control tuning, damper or burner problems |
| Cross-band temperature difference | One side hotter or colder | Burner imbalance, airflow blockage; also affects tracking |
| Heat-up time after stops | Longer to reach temperature | Heat loss or burner capacity loss |
| Setpoint changes by operators | Frequent manual adjustments | Operators compensating for hidden drift |
Linking these to bake quality data, such as colour and moisture checks, shows the cost of drift in product terms. Ask our team how that link is built.
From Early Signal to Planned Oven Work
Tracking effort, torque, flame signal or firing rate moves outside its learned band.
The alert separates alignment, drag, burner and insulation causes using the combination of signals.
Work is scheduled into the next planned sanitation or weekend stop, with parts reserved.
Technicians receive the zone, burner or roller location with the evidence attached.
Signals return to baseline; the record feeds the next NFPA 86 test cycle.
See how this looks on your oven in a guided session.
How iFactory Solves Oven and Burner Reliability
Correction frequency and position offset trended per band and zone.
Torque and band-speed comparisons that reveal drag and slip early.
Flame signal strength, stability and ignition history per burner.
Firing rate against setpoint, heat-up times and cross-band balance.
Trends organized for NFPA 86 testing and record keeping.
Alerts turned into scheduled work with location and evidence.
It reads the oven PLC, burner management system and drive data you already have, across oven makers. Ask our engineers about your setup.
See What Your Oven Is Telling You
Share a few weeks of tracking, drive and burner data. We show which rollers, burners and zones are drifting, and what to fix in your next planned stop.
Flame signal strength has weakened and fluctuated for five days while firing rate rises to hold zone temperature.
How Deployment Works
iFactory ships as a pre-configured NVIDIA AI server, racked and ready with the oven and burner models loaded. Rack it, plug in power and Ethernet, and the AI is live on your network. Our scope covers sensor and PLC/SCADA integration, cabling and network setup, operator and technician training, and 24×7 remote monitoring.
Server installed, sensors and controllers connected, historical work orders and failure history loaded.
Baselines learned per asset, alerts piloted on the first line with your maintenance team reviewing every finding.
Rollout to the agreed assets, technician training, CMMS hand-off and 24×7 remote monitoring in place.
Most bakeries start with their highest-volume tunnel oven, then add proofers, coolers and packaging on the same line. The rollout order is agreed on a scoping call.
Frequently Asked Questions
By trending drive torque and comparing band speed with drum speed, drag and slip are visible days before damage. Tracking system activity adds early warning of alignment and tension problems. See it in a demo.
Oven alignment, uneven temperature across the band, drive and tension equipment, and the band’s own tolerances. A band that consistently runs to one side usually points to an alignment problem. Our engineers can review your tracking data.
Trend flame signal strength and stability from the burner management system for each burner. A weakening or noisy signal flags scanner, electrode or combustion problems before a lockout. Ask about burner trending.
No. NFPA 86 inspection and testing, including annual tests of safety interlocks and safety shutoff valve leakage, remain required. Continuous trends make those tests more informative. Talk to our team.
Tracking sensor and actuator data, drive current or torque, encoder speeds, zone temperatures and firing rates, and burner management data. Most ovens already record much of this in the PLC. Get a data review.
Typical programs go live in 6–12 weeks, starting with one oven. The server ships pre-configured and our scope covers integration, training and 24×7 remote monitoring. Plan it with our support team.
Keep the Oven Baking, Not Stopping
iFactory trends band tracking, drive torque, flame signals and zone firing so every oven problem gets a warning, a diagnosis and a planned fix.
Band, drive and burner signals come from the oven PLC and burner management system.