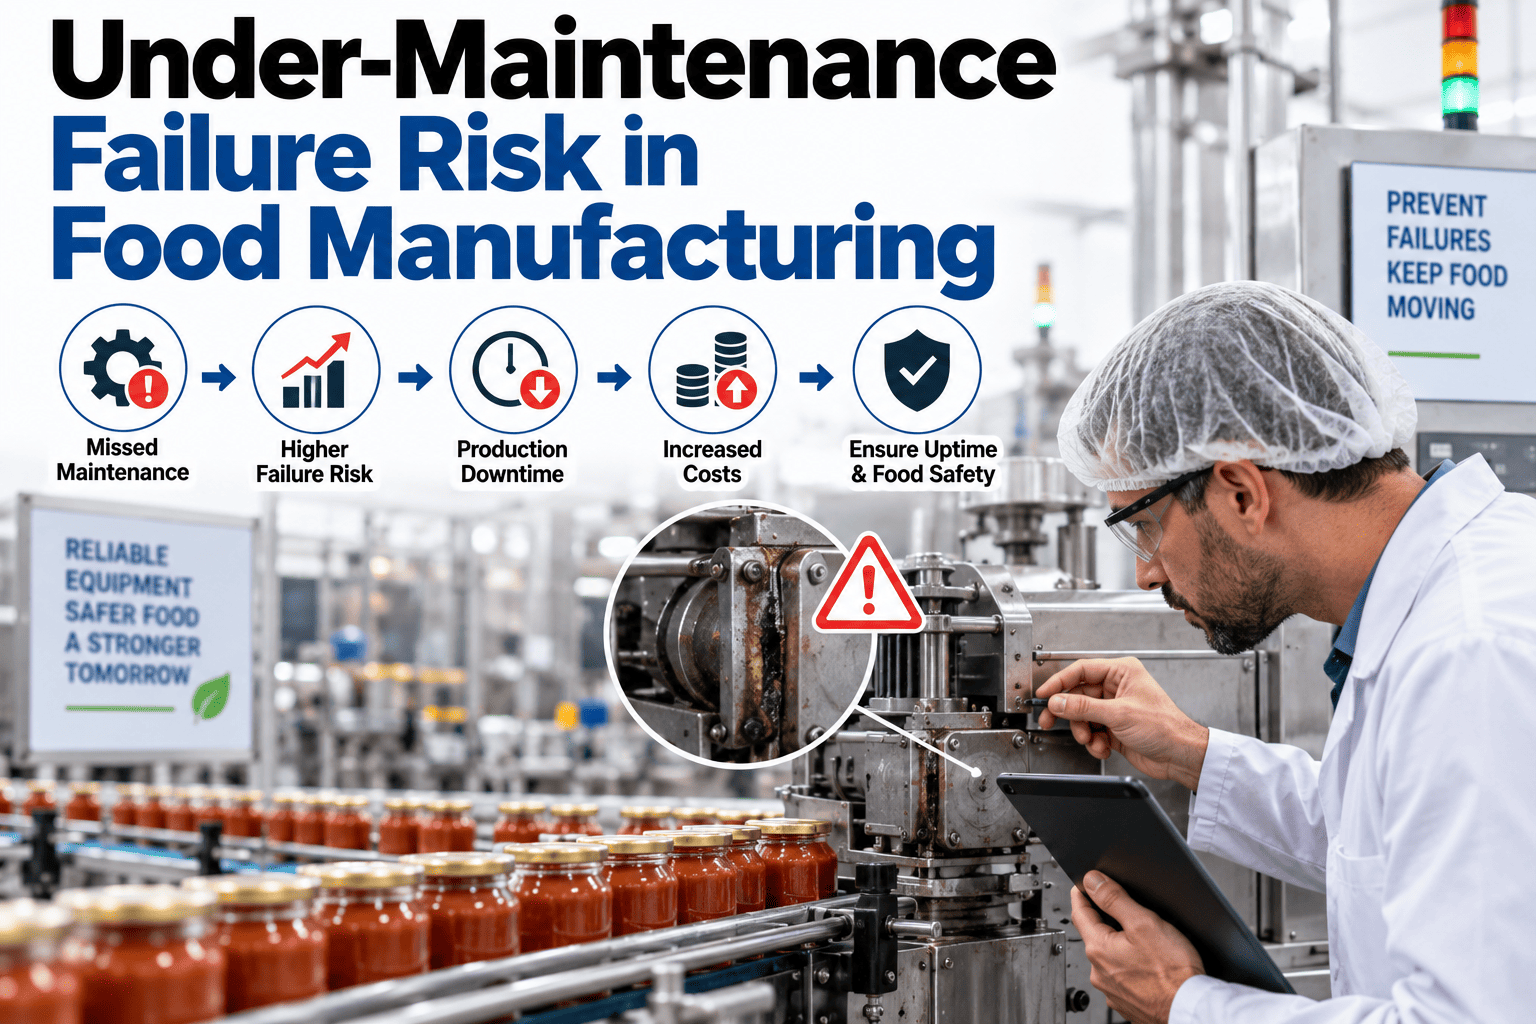
A gearbox that fails between scheduled inspections doesn't check whether it's convenient. It fails on whatever day the wear finally crosses the point of no return, and if that day falls three weeks before the next calendar-driven PM was due, the plant absorbs an unplanned stoppage that a tighter, condition-aware schedule would have caught with time to spare. Under-maintenance gets far less attention than over-maintenance in most reliability conversations, probably because it looks like discipline rather than negligence right up until the moment something breaks, but the two are really the same root problem wearing different faces: a fixed calendar interval that has no actual relationship to how fast a specific asset is degrading. If you've ever had a failure land squarely in the gap between two scheduled inspections, book a demo to see how AI closes that exact gap.
FOOD & BEVERAGE · RELIABILITY & FAILURE PREVENTION
Some of Your Assets Are Failing Between PM Cycles
Nearly a quarter of unplanned failures happen on assets whose PM interval was simply too long relative to how fast they were actually degrading. iFactory identifies exactly which assets are under-covered and closes the gap before the next failure lands.
23%
of unplanned failures trace to an interval that was too long for the actual degradation rate
5x
higher hidden cost when a failure occurs between PM cycles versus a caught, planned repair
WHY THE CALENDAR MISSES THIS
A Fixed Interval Can't See a Machine That's Degrading Faster Than Usual
Time-based PM assumes every asset of a given type wears out at roughly the same rate, which is a reasonable simplification right up until a specific unit starts degrading faster than its peers because of a process change, an operating condition shift, or simply because that particular unit had a rougher installation than the others. The calendar has no way to see that difference, because it was never built to look.
HIGH RISK
Assets Running Above Rated Load
Equipment pushed past its designed operating envelope during peak production periods degrades faster than the interval assumes, and nothing on the calendar adjusts for that extra stress.
HIGH RISK
Recently Repaired or Rebuilt Units
A component that went back together slightly out of tolerance after a repair often fails faster than a comparable unit that was never touched, yet returns to the exact same PM interval as before.
MODERATE RISK
Assets Running a Different Product Mix
A change in recipe, viscosity, or packaging format can quietly increase wear on seals, bearings, and belts well beyond what the original interval was calibrated against.
MODERATE RISK
Aging Equipment Past Its Design Life
Older assets often need shorter intervals than they were originally assigned, but PM programs rarely revisit and tighten a schedule as equipment ages past its intended service life.
FAILURE SIGNATURES THAT PRECEDE A BREAKDOWN
The Warning Signs Sitting Between Your PM Cycles
Most catastrophic failures don't happen without warning, they happen without anyone watching for the warning at the moment it appeared. These are the patterns that consistently show up in the days or weeks before a failure that a fixed calendar interval would have otherwise missed entirely.
!A slow, steady rise in vibration amplitude that never crosses a single fixed alarm threshold but climbs consistently over several weeks, the classic signature of bearing wear developing between scheduled checks.
!Small temperature increases at a motor or gearbox housing that stay within a normal daily range individually but trend upward when viewed across several days in a row.
!A gradual increase in cycle time or run current on equipment that used to complete the same task in a consistent window, often the earliest sign of mechanical resistance building somewhere in the drivetrain.
!An uptick in minor stoppages or jams on a line that used to run cleanly, frequently dismissed individually as a one-off but forming a clear pattern when logged and reviewed together.
!Operator comments about unusual sound or smell logged in a shift note but never escalated, exactly the kind of early signal a structured monitoring layer is built to catch and act on.
Find your under-covered assets before they find you
iFactory can compare your current PM intervals against real degradation data and flag exactly which assets are running underprotected.
WHAT AN UNCAUGHT FAILURE ACTUALLY COSTS
The Gap Between a Planned Repair and a Surprise Breakdown
The direct repair cost of fixing a failed component is almost never the real story. The real cost lives in everything that surrounds an unplanned event: the emergency parts premium, the overtime labor, the production lost while the line is down, and in food and beverage specifically, the potential food safety exposure if the failure happens mid-run.
PLANNED REPAIR
Scheduled during a planned downtime window
Standard parts pricing and technician rates
No production loss beyond the planned window
VS
UNPLANNED FAILURE
Occurs mid-run, forcing an immediate stoppage
Expedited parts and overtime labor premiums apply
Full production loss until the line is restored
Hidden costs like these, lost production, safety exposure, and environmental impact when applicable, can run up to five times higher than the direct repair cost alone, which is exactly why closing the coverage gap on high-risk assets pays for itself many times over compared to the modest cost of tightening a handful of intervals.
TIME-BASED VS AI-ADAPTIVE COVERAGE
Closing the Gap Between Scheduled Checks
| Factor |
Fixed-Interval PM |
AI-Adaptive Coverage |
| Detection window |
Only at scheduled inspection points |
Continuous, between scheduled checks |
| Sensitivity to load changes |
None, interval stays fixed regardless |
Interval tightens automatically under added stress |
| Recently repaired assets |
Returns to standard interval automatically |
Flagged for closer monitoring post-repair |
| Aging equipment |
Interval rarely revisited as equipment ages |
Interval adjusts as failure rate data accumulates |
| Typical unplanned failure reduction |
Baseline, no adjustment applied |
30-40% fewer unplanned events on covered assets |
CLOSING THE GAP
How iFactory Finds and Fixes Under-Covered Assets
01
Failure History Cross-Reference
Every unplanned failure in your history is checked against the PM interval that was in place at the time to identify assets where the schedule was demonstrably too long.
02
Operating Condition Overlay
Load, product mix, and environmental data are layered onto the asset history to identify units running harder than their assigned interval assumes.
03
Risk-Tiered Interval Adjustment
High-risk assets identified through this process move to a tighter, condition-aware trigger while low-risk assets stay on their existing schedule.
04
Continuous Re-Evaluation
Risk tiers aren't static, an asset that stabilizes moves back down in monitoring intensity while a newly stressed asset moves up automatically.
FREQUENTLY ASKED QUESTIONS
What Reliability Teams Ask About Coverage Gaps
How do we know which of our assets are actually under-covered right now?
The clearest signal is cross-referencing your failure history against the PM interval that was active at the time of each unplanned event, since an asset that keeps failing shortly before its next scheduled check is showing you directly that the interval doesn't match its actual degradation rate. A second strong signal comes from operating condition data, an asset running consistently above its rated load or handling a more demanding product mix than it was originally spec'd for is a strong candidate for under-coverage even before a failure confirms it. Combining both signals gives a far more reliable picture than either one reviewed in isolation.
Book a demo to run this cross-reference against your own failure history.
Isn't the safest response just to shorten every interval across the board?
That approach solves under-maintenance by creating over-maintenance everywhere else, trading one wasteful pattern for another rather than actually fixing the problem. The more precise response tightens intervals specifically on the assets where data shows real risk, an unusual load profile, a recent repair, an aging unit past its typical service life, while leaving healthy, stable assets exactly where they are. This targeted approach is what actually reduces unplanned failures without inflating labor and parts spend on equipment that was never at meaningful risk in the first place.
Contact our support team to discuss a targeted approach for your specific fleet.
Do we need continuous sensors on every asset to catch this in time?
Continuous condition monitoring hardware helps most on your highest-consequence and highest-risk assets, but it isn't a requirement for the entire fleet to start closing coverage gaps. A meaningful first pass comes from analyzing existing failure history, shift log observations, and operating condition data you likely already have, which is often enough to identify the clearest under-covered assets and adjust their intervals immediately. Sensors add real value as a second layer specifically for the assets identified as highest risk through that first analysis, rather than being a blanket prerequisite everywhere.
Book a demo to see what's achievable with your existing data first.
What happens to an asset once it's flagged as high risk?
A flagged asset moves onto a tighter, condition-aware monitoring cadence rather than simply having its calendar interval shortened arbitrarily, which means the actual trigger for the next inspection becomes real degradation data where it's available, or a meaningfully shorter interval where it isn't yet. The flag also typically prompts a root-cause look at why that asset is running hotter than its peers, since a recurring flag on the same unit often points to an underlying operating condition problem worth fixing directly rather than just monitoring around indefinitely.
Contact our support team to see how flagged assets are handled operationally on the floor.
How quickly can we expect to see fewer unplanned failures after this?
Assets identified as clearly under-covered and moved to tighter monitoring typically show a measurable reduction in unplanned events within the first one to two maintenance cycles after the adjustment, since the fix directly targets the specific gap that was causing those failures. The full picture across your entire fleet takes longer to validate, generally a full quarter or two, as enough operating history accumulates to confirm the new intervals are correctly calibrated and not just a temporary improvement. Plants running this kind of targeted coverage adjustment consistently report thirty to forty percent fewer unplanned events on the specific assets that were re-tiered.
Book a demo to map a realistic timeline against your own failure data.
CLOSE THE GAP BEFORE THE FAILURE DOES
Stop Letting High-Risk Assets Hide Behind a Fixed Calendar
iFactory identifies exactly which assets are running under-covered by your current PM intervals and closes that gap with condition-aware monitoring before the next failure lands.