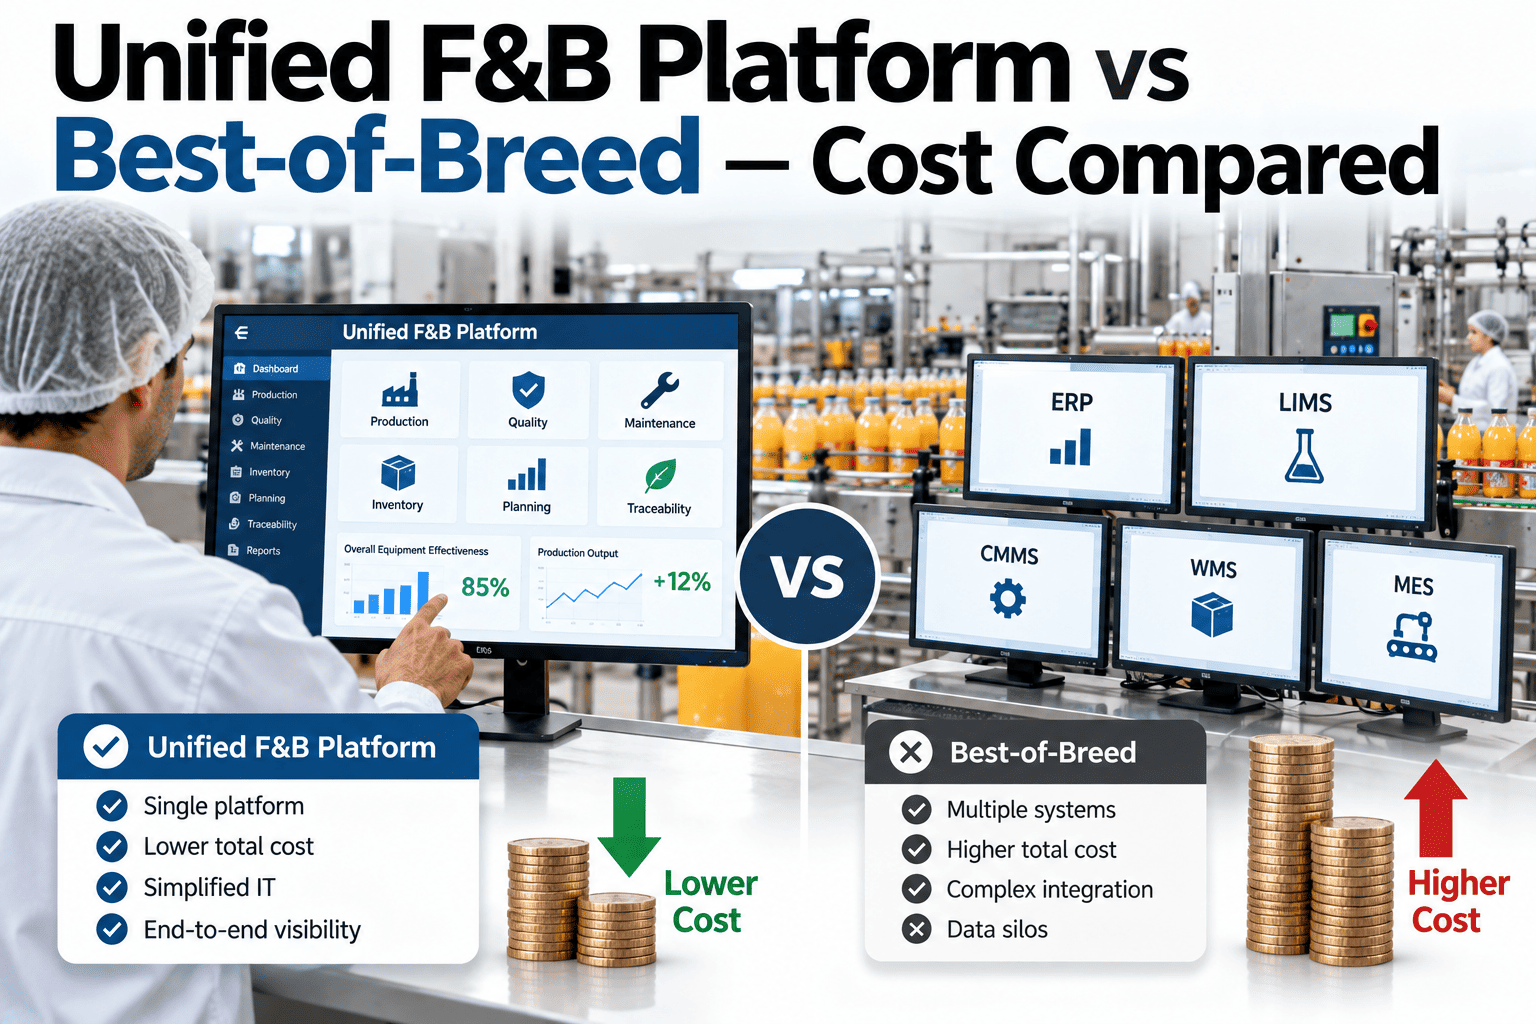
A best-of-breed software stack always wins the individual feature comparison — the specialized CMMS is genuinely stronger at work order scheduling than a unified platform's maintenance module, and the specialized OEE tool genuinely visualizes line performance better in isolation. What that comparison never captures is the cost sitting between the tools: the integration project that took four months longer than planned, the two people whose real job became keeping data synchronized across systems, and the report that takes a full day to assemble because it lives in three different places. Total cost of ownership for a food manufacturing software stack has to include the seams, not just the features on either side of them. If your current stack has more integration points than anyone can name from memory, book a demo to see what a unified data model actually removes.
The Best Tool for Each Job Still Has to Talk to the Others
Best-of-breed wins every feature-by-feature comparison. It loses on total cost the moment you count integration projects, duplicate data entry, and the reports that take a full day to assemble across three disconnected systems.
Why the Feature Comparison Misses the Real Cost
Every best-of-breed vendor's demo focuses entirely on what their tool does better than a general platform's equivalent module, and in isolation, that comparison is often accurate. The problem is that a food manufacturing operation doesn't run any single tool in isolation — a work order in the CMMS needs to reflect an OEE-flagged downtime event, a HACCP deviation needs to trigger a corrective action, and a traceability record needs data from receiving, production, and shipping all at once.
Every point-to-point connection between two specialized tools is a custom project that needs building, testing, and maintaining indefinitely as either vendor updates their software.
The same SKU, line, or employee record often exists separately in three or four systems, each capable of drifting out of sync the moment one is updated without the others.
A cross-functional report pulling maintenance, quality, and production data requires manually exporting from each system and reconciling it in a spreadsheet before anyone can see the full picture.
When an integration breaks, each vendor can reasonably claim the fault lies with the other system, leaving the plant's own IT team to diagnose and mediate a problem neither vendor owns.
Total Cost, Side by Side
License cost is the easiest number to compare and the least representative of actual total cost. The categories below are where the real difference between a unified platform and a best-of-breed stack shows up over a three-year horizon.
| Cost Category | Best-of-Breed Stack | Unified Platform |
|---|---|---|
| Initial license cost | Often lower per-module | Often higher upfront, bundled |
| Integration build cost | Significant — one project per connection | Minimal — connections native to the platform |
| Ongoing integration maintenance | Recurring cost every vendor update cycle | Handled within platform release cycle |
| Master data reconciliation | Manual or semi-automated, recurring effort | Single source of truth, no reconciliation needed |
| Cross-functional reporting | Manual export and spreadsheet assembly | Native cross-module reporting |
| New line or plant onboarding | Repeat integration work per site | Configuration, not a new integration project |
| Vendor accountability on issues | Split across multiple vendors | Single vendor, single point of accountability |
Map Your Own Stack's Integration Debt
Bring your current system diagram and we'll help identify which seams are costing the most in maintenance time and reporting delay.
The Seam Checklist: Where Best-of-Breed Stacks Actually Break
Before comparing platforms, it helps to know exactly where a multi-vendor stack tends to develop friction. These are the specific seams worth interrogating in any current-state assessment.
CMMS to OEE
Does a downtime event automatically create or link to a maintenance work order, or does someone manually cross-reference the two systems after the fact?
Quality to Production
Does a HACCP deviation or quality hold automatically flag the affected batch in the production and shipping systems, or rely on a person remembering to communicate it?
Traceability Across Systems
Can a single lot be traced from raw material receiving through production and into finished goods shipping without manually joining data from separate systems?
Master Data Consistency
Is the same line, SKU, and shift structure defined identically across every system, or does each tool maintain its own version that can silently diverge?
A Decision Framework, Not a Universal Answer
Best-of-breed is not always the wrong choice, and unified is not automatically right for every plant. The decision depends on specific factors worth evaluating honestly before committing either direction.
Cross-functional visibility — connecting maintenance, quality, and production data — is a stated strategic priority, or the plant is scaling to multiple sites that need consistent reporting.
One specific functional area has a truly unique, highly specialized requirement that no unified platform module can match, and that gap is worth the integration cost to fill.
Internal IT capacity for maintaining custom integrations is limited, and the team would rather rely on a single vendor's release cycle than manage several independently.
The organization has already invested heavily in one specific best-in-class tool with deep internal expertise built around it, and replacing it would erase that investment.
What a Stack Audit Found at One Multi-Plant Operator
A regional snack food manufacturer running four plants had accumulated six separate systems over a decade — a CMMS from one vendor, an OEE tool from another, a quality management system from a third, plus spreadsheet-based traceability that no single system actually owned. Producing a single monthly cross-plant performance report required one analyst roughly three full days every month, manually exporting and reconciling data from each source.
A stack audit revealed the company was spending more annually on integration consultants maintaining the connections between these systems than it would have cost to license a unified platform covering the same functional scope. The decision to consolidate was not primarily about feature parity — several of the specialized tools had capabilities the unified platform's equivalent modules didn't fully replicate — but about the compounding cost of the seams between them, which had quietly become the single largest line item in the software budget without ever appearing as its own budget category.
A Phased Consolidation Approach That Doesn't Disrupt Production
Few plants can or should rip out an entire software stack overnight. A phased approach to consolidation reduces risk while still moving toward a single connected data model.
Identify the single highest-friction seam in the current stack — typically traceability or quality-to-production handoff — and migrate that specific functional area first.
Run the newly unified functional area alongside the remaining specialized tools for a defined validation period, confirming data accuracy and user adoption before continuing.
Migrate the next highest-friction functional area, using lessons learned from phase one to shorten the transition timeline and reduce user disruption.
Decommission remaining point-to-point integrations only once their corresponding functional areas have fully transitioned, avoiding a gap in coverage during the transition.
Benefits That Don't Show Up on a Cost Spreadsheet
Beyond the direct cost savings of eliminating integration debt, plants that consolidate onto a unified platform frequently report benefits that are real but harder to quantify in a straightforward return-on-investment calculation.
New employees learn one interface and one set of workflows instead of navigating between several disconnected tools with different conventions and logins.
An engineer investigating a quality issue can see maintenance history, production data, and quality records in one place instead of piecing together a timeline across systems.
A single connected data model means an auditor's request for cross-functional evidence doesn't require reconstructing a narrative from multiple disconnected exports.
Rolling out consistent processes and reporting across multiple plants is considerably simpler when every site runs the same connected platform rather than its own historical stack.
Frequently Asked Questions
Does moving to a unified platform mean losing capabilities we currently rely on in our specialized tools?
This depends entirely on how specialized and mission-critical the specific capability is. Many features that feel indispensable in a specialized tool turn out to be adequately covered by a well-designed unified platform's equivalent module, especially once the value of native cross-functional data access is factored in. A small number of genuinely unique, highly specialized requirements may still justify keeping one best-of-breed tool integrated into an otherwise unified stack, which is a reasonable hybrid approach rather than an all-or-nothing decision. Our team can review your current specialized tool usage against platform capability during a demo — book a session to walk through it.
How disruptive is a migration from a multi-vendor stack to a unified platform?
Migration complexity depends heavily on how much historical data needs to be preserved and how deeply embedded the current systems are in daily workflow, but most food manufacturers phase the transition module by module rather than attempting a single cutover across all functional areas simultaneously. Starting with the functional area experiencing the most integration pain — often traceability or quality-to-production handoffs — tends to produce the clearest early win and builds internal confidence before migrating the remaining modules. For a realistic migration timeline based on your specific current stack, contact our support team.
How do we quantify integration debt if it's never shown up as its own line item in our budget?
Integration debt hides inside IT staff time, consultant invoices tagged to individual projects rather than a recurring category, and the opportunity cost of analyst hours spent manually reconciling reports across systems. A useful exercise is tracking, over a single month, every hour spent by any employee specifically reconciling, exporting, or troubleshooting data because it lives in more than one disconnected system — this number is almost always larger than expected once actually measured rather than estimated. Our team can help structure this assessment for your specific stack — book a demo to review the framework.
Is a unified platform always the more expensive option upfront?
Often yes, on a pure license-cost comparison — a unified platform bundling multiple functional areas typically carries a higher initial quote than licensing several narrower point solutions separately. The total cost comparison only favors the unified approach once integration build cost, ongoing integration maintenance, and the labor cost of manual reconciliation are added to the best-of-breed side of the ledger, which is exactly the comparison most procurement processes skip. For a side-by-side cost model using your specific plant scale, reach out to support.
What happens if our unified platform vendor's specific module in one area isn't as strong as a specialized competitor?
This is a legitimate trade-off worth evaluating honestly rather than dismissing — a unified platform's module in any given functional area may not match a decade-old specialized tool built exclusively for that one function. The relevant question is whether the gap in that specific module's depth outweighs the cumulative cost and friction of maintaining a separate integrated system just for that one function. In many cases, the native cross-functional visibility gained is worth a modest depth trade-off in one area, but this varies by plant and by which functional area is in question. For an honest, specific comparison against your current specialized tools, schedule a session with our team.
Count the Seams Before You Count the Features
See what a single connected data model across maintenance, quality, and production actually removes from your current stack's total cost.