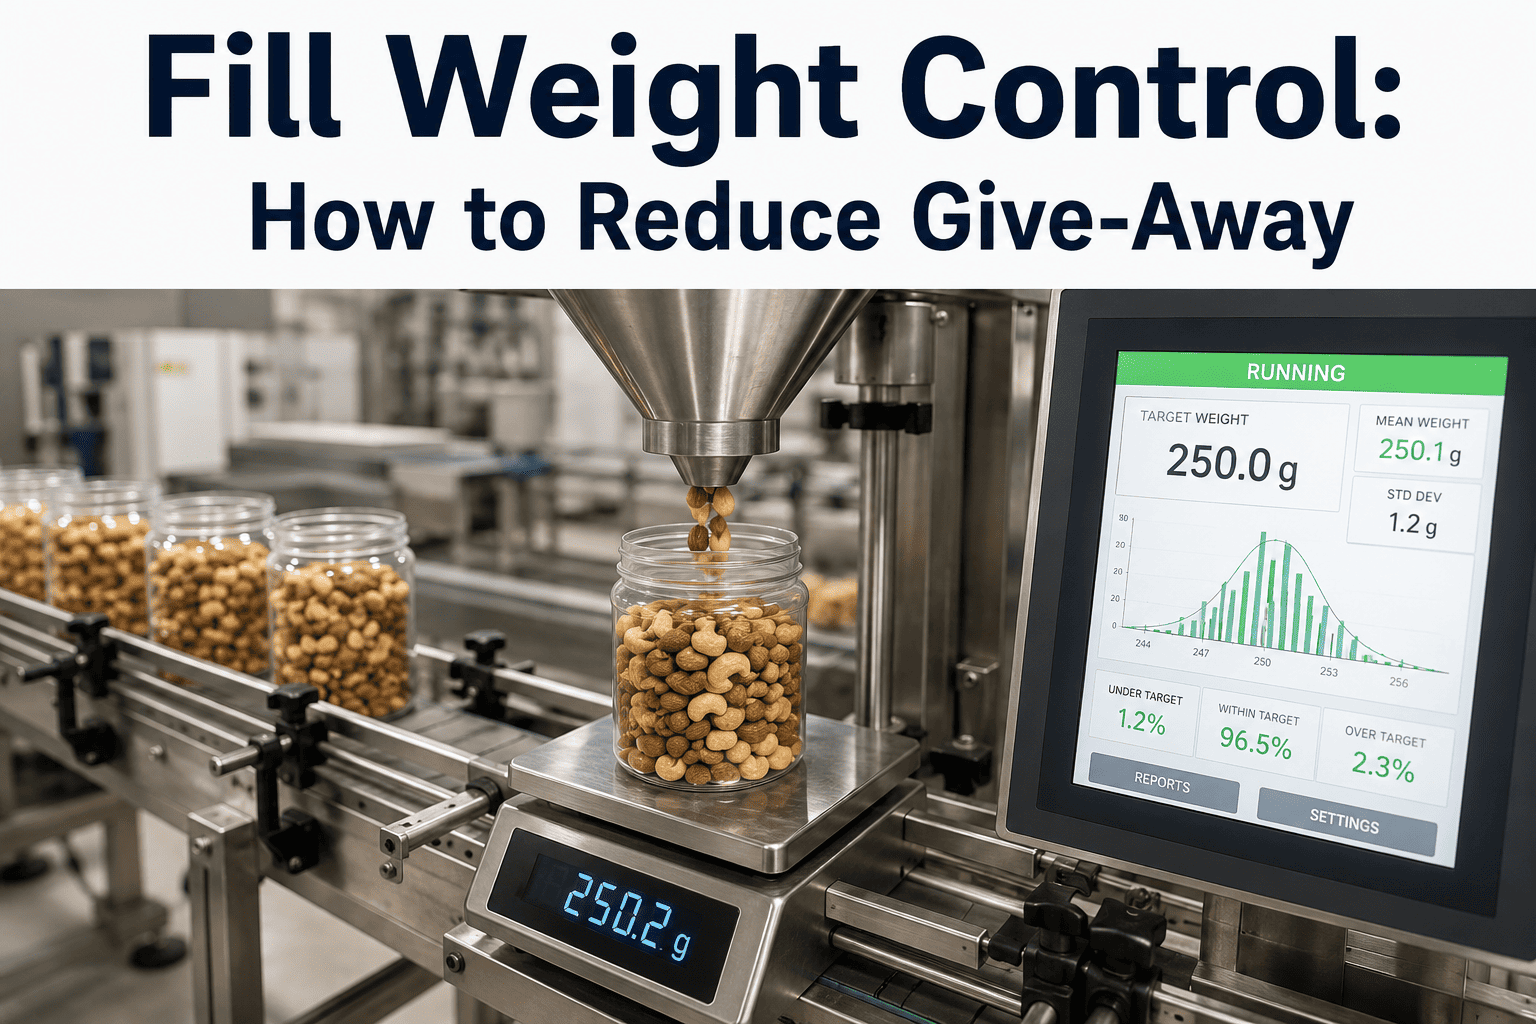
Give-away doesn't show up on any single day's production report — it accumulates silently, a few grams of overfill per package multiplied across hundreds of thousands of units a year, until a margin review finally surfaces just how much product has been given away for free. Most fill weight programs are built to avoid underfill violations, since that's where regulatory risk lives, but the overcorrection that avoids underfill often costs far more in consistent overfill than an occasional violation would. iFactory helps packaging lines hold fill weight tight to target on both sides of the distribution, with the complete methodology at iFactory support.
Fill Weight Control · Packaging Compliance & Cost
Fill Weight Control: The Give-Away You Don't See Until the Margin Review
iFactory monitors checkweigher data continuously to hold fill weights tight to target, reducing give-away while keeping every package safely within regulatory net content requirements.
Why Fill Control Is a Cost Issue, Not Just Compliance
What Excess Overfill Actually Costs
1–3%
Typical average overfill margin lines run to avoid underfill risk
Compounding
Effect of small per-unit give-away multiplied across high production volumes
Hidden
Give-away rarely appears as its own line item in standard production reporting
Both directions
A tightly controlled process reduces both give-away and violation risk simultaneously
What Causes Fill Weight Drift
Four Common Sources of Weight Variation on a Filling Line
Product Density Changes
A change in ingredient particle size or moisture can shift bulk density, affecting fill volume even when the filler settings remain unchanged.
Filler Mechanical Wear
Auger or piston wear on volumetric fillers gradually changes dispensed volume per cycle in ways that aren't obvious until a checkweigher trend is reviewed.
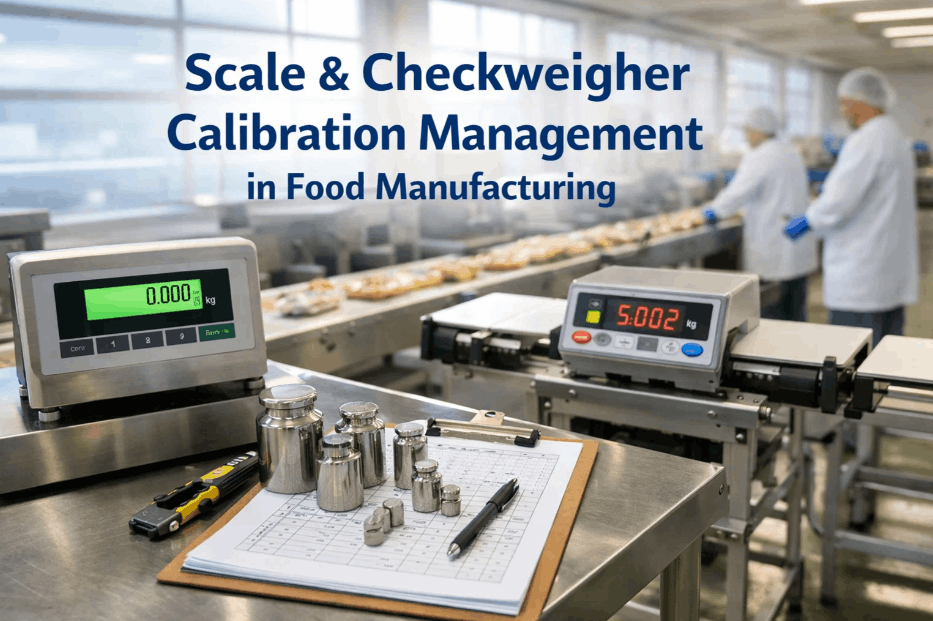
Checkweigher Calibration Drift
A checkweigher that hasn't been recalibrated recently can report inaccurate weights, masking a real fill problem or flagging a false one.
Line Speed Changes
Adjusting line speed to meet a production target can affect fill consistency on certain filler types if not compensated for in the fill parameters.
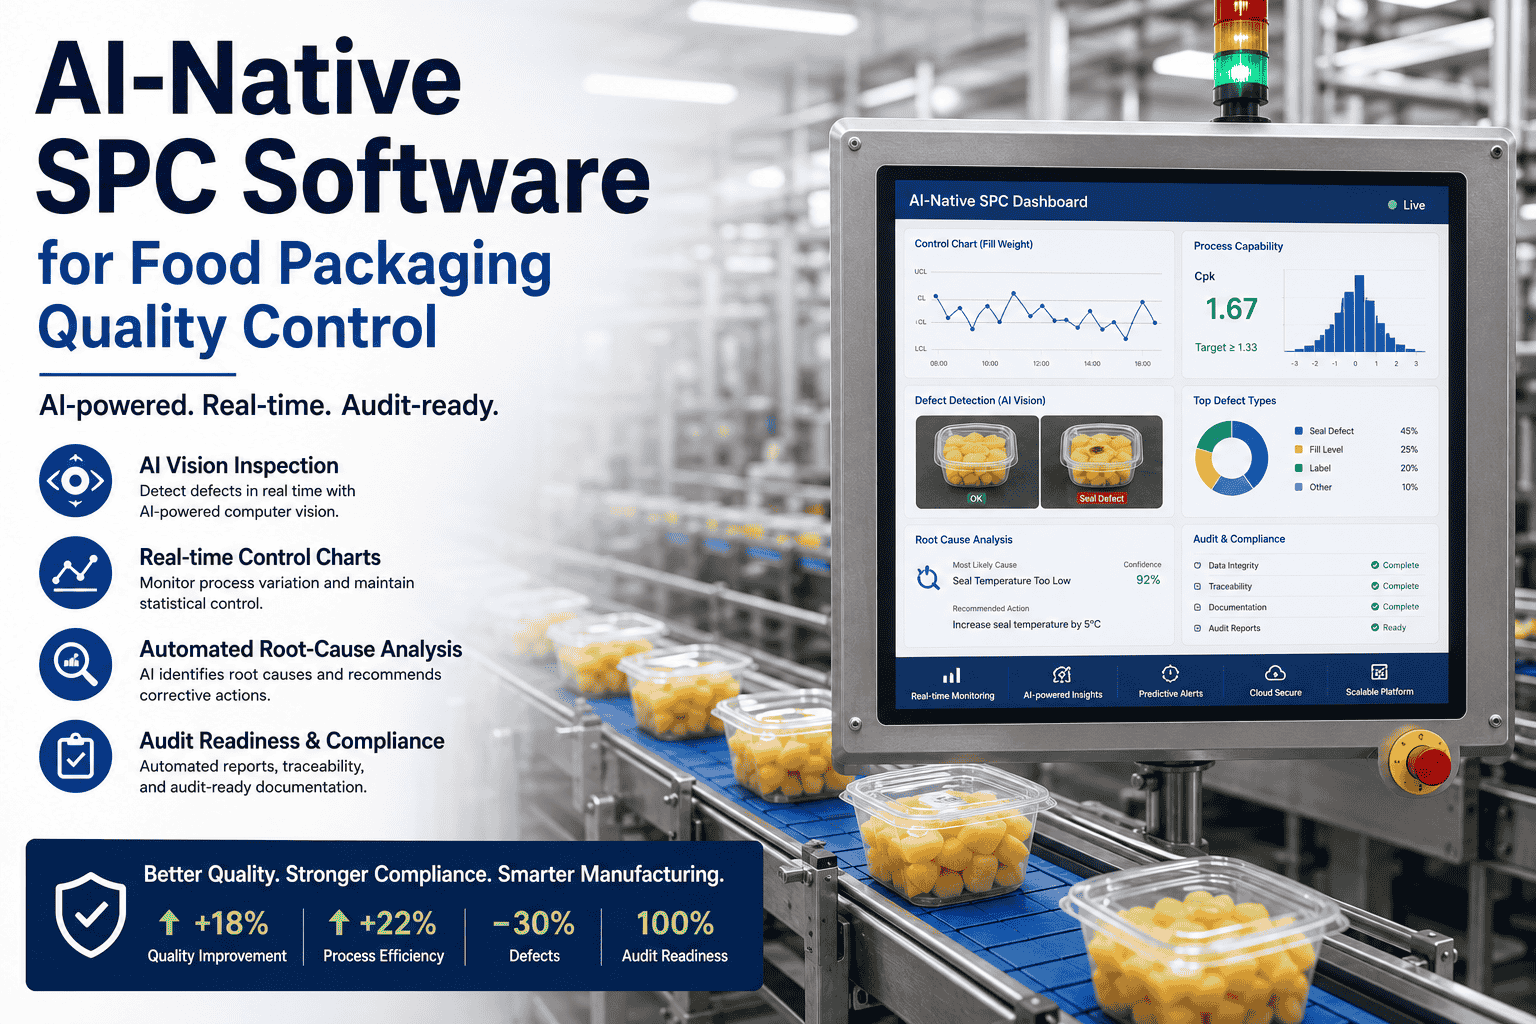
Statistical Process Control Catches Drift Before It Becomes Either a Violation or a Loss
Continuous checkweigher trend monitoring flags drift toward either underfill risk or excess give-away before it accumulates into a real cost.
Reactive vs. Statistical Process Control
What Changes When Fill Weight Is Actively Managed
Factor
Reactive Spot-Checking
iFactory Continuous SPC
Drift Detection
Found after enough units have shipped to notice a pattern
Flagged as soon as trend crosses a control limit
Average Overfill Margin
Padded generously to avoid underfill risk
Tightened toward target as confidence in control improves
Compliance Documentation
Periodic spot-check logs
Continuous statistical record ready for inspection
Field Case
Cutting Overfill Margin in Half Without Increasing Violation Risk
A snack food producer had run its primary filling line with a roughly 2.5 percent average overfill margin for years, a level operations had settled on informally after a past underfill finding during a state inspection. Continuous checkweigher trend monitoring showed the actual process variation was tight enough to safely target a much smaller margin while still maintaining a comfortable statistical buffer above the legal minimum. Tightening the target reduced average overfill to just over 1 percent without a single underfill flag in the following two quarters, representing a meaningful reduction in given-away product across the line's annual volume.
~60%Reduction in average overfill margin
0Underfill flags in two quarters
2 quartersSustained tighter target
Frequently Asked Questions
Fill Weight Control — Common Questions
How much can we safely reduce our overfill margin?
The safe margin depends entirely on your process's actual variation, which is exactly what continuous statistical monitoring reveals. A line with tight, consistent variation can safely run closer to target than one with wider variation, and the right approach is to reduce the margin gradually while watching the statistical control limits, rather than guessing at a new target.
Book a Demo to review your current process variation.
Does this replace our checkweigher, or work with the one we have?
In most cases the existing checkweigher continues operating exactly as it does today, with continuous monitoring layered on top to trend the data it already produces, rather than requiring new weighing hardware. Facilities with outdated or poorly calibrated checkweighers may need a hardware refresh identified during the initial review.
How does this support NIST Handbook 133 compliance specifically?
Continuous statistical records demonstrate ongoing control over the fill process, which aligns well with the kind of documentation weights-and-measures inspectors look for during a facility review, beyond simply passing a spot-check on the day of inspection.
Contact support for documentation formats aligned to your state's requirements.
Can this work across multiple filling lines with different product types?
Yes — each line and product combination carries its own control limits and target based on its specific fill characteristics, so a single facility with multiple product types running different fillers can manage all of them under the same monitoring program without forcing a one-size-fits-all target across dissimilar products.
How long does it take to see a measurable reduction in give-away?
Most facilities establish reliable baseline process variation within two to four weeks of continuous monitoring, after which margin reduction can begin incrementally. Measurable give-away savings typically become visible in cost reporting within the following one to two months.
Book a Demo for a timeline specific to your production lines.
Find Out How Much Product Your Overfill Margin Has Been Quietly Giving Away
Continuous checkweigher trend monitoring and statistical process control, live in as little as two weeks.