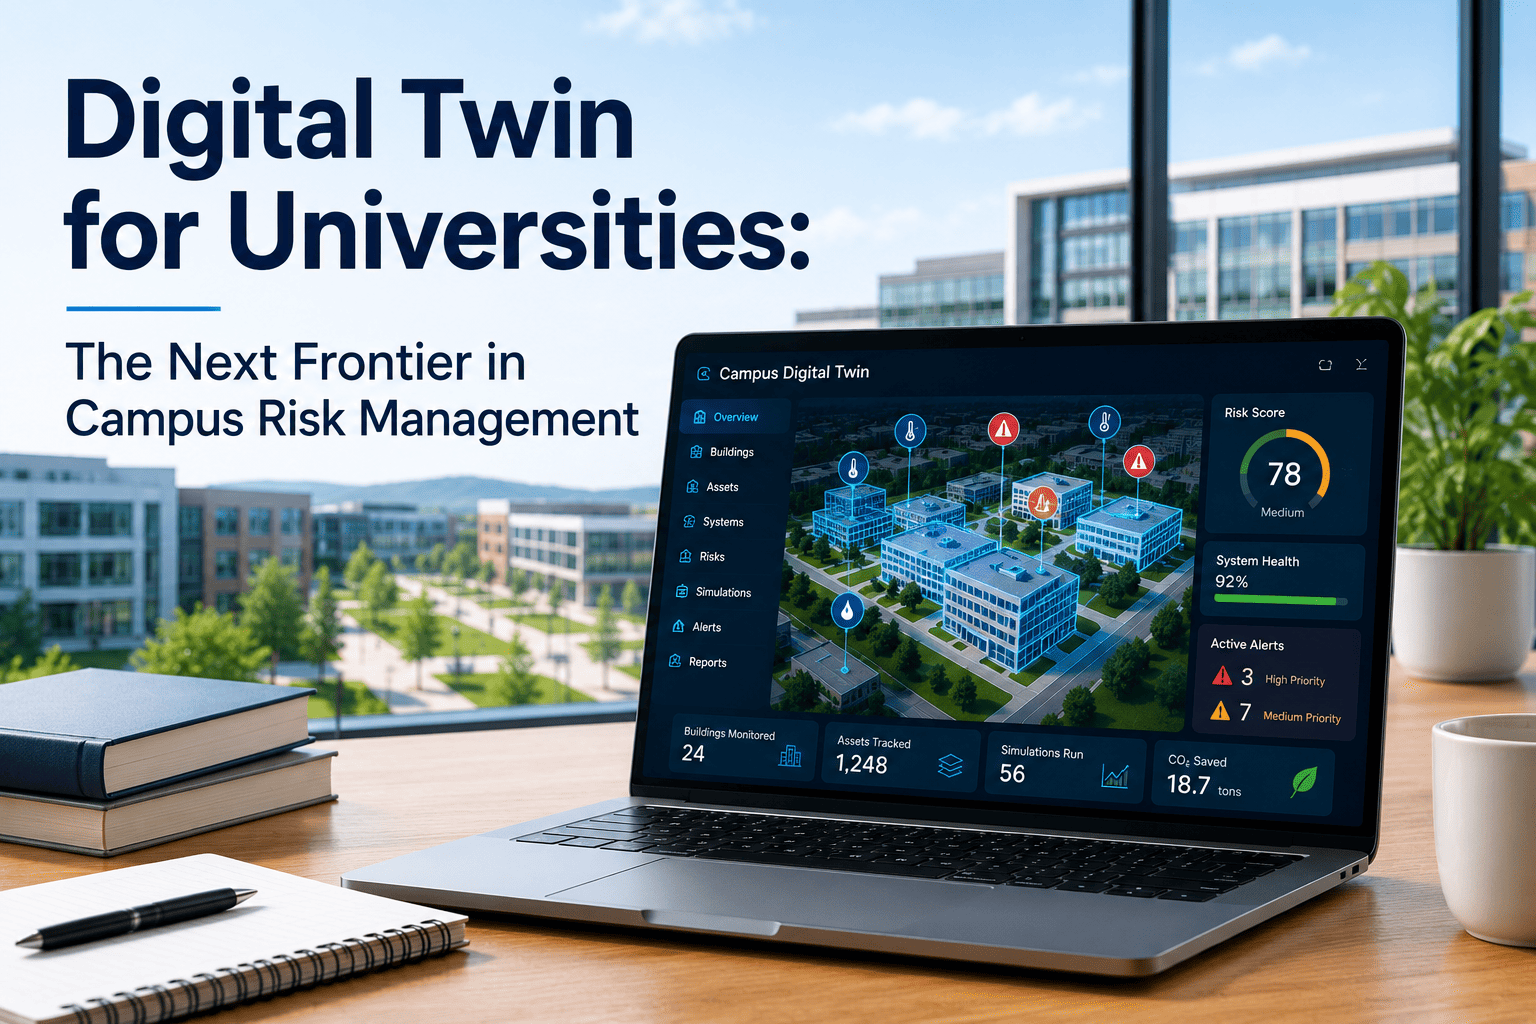
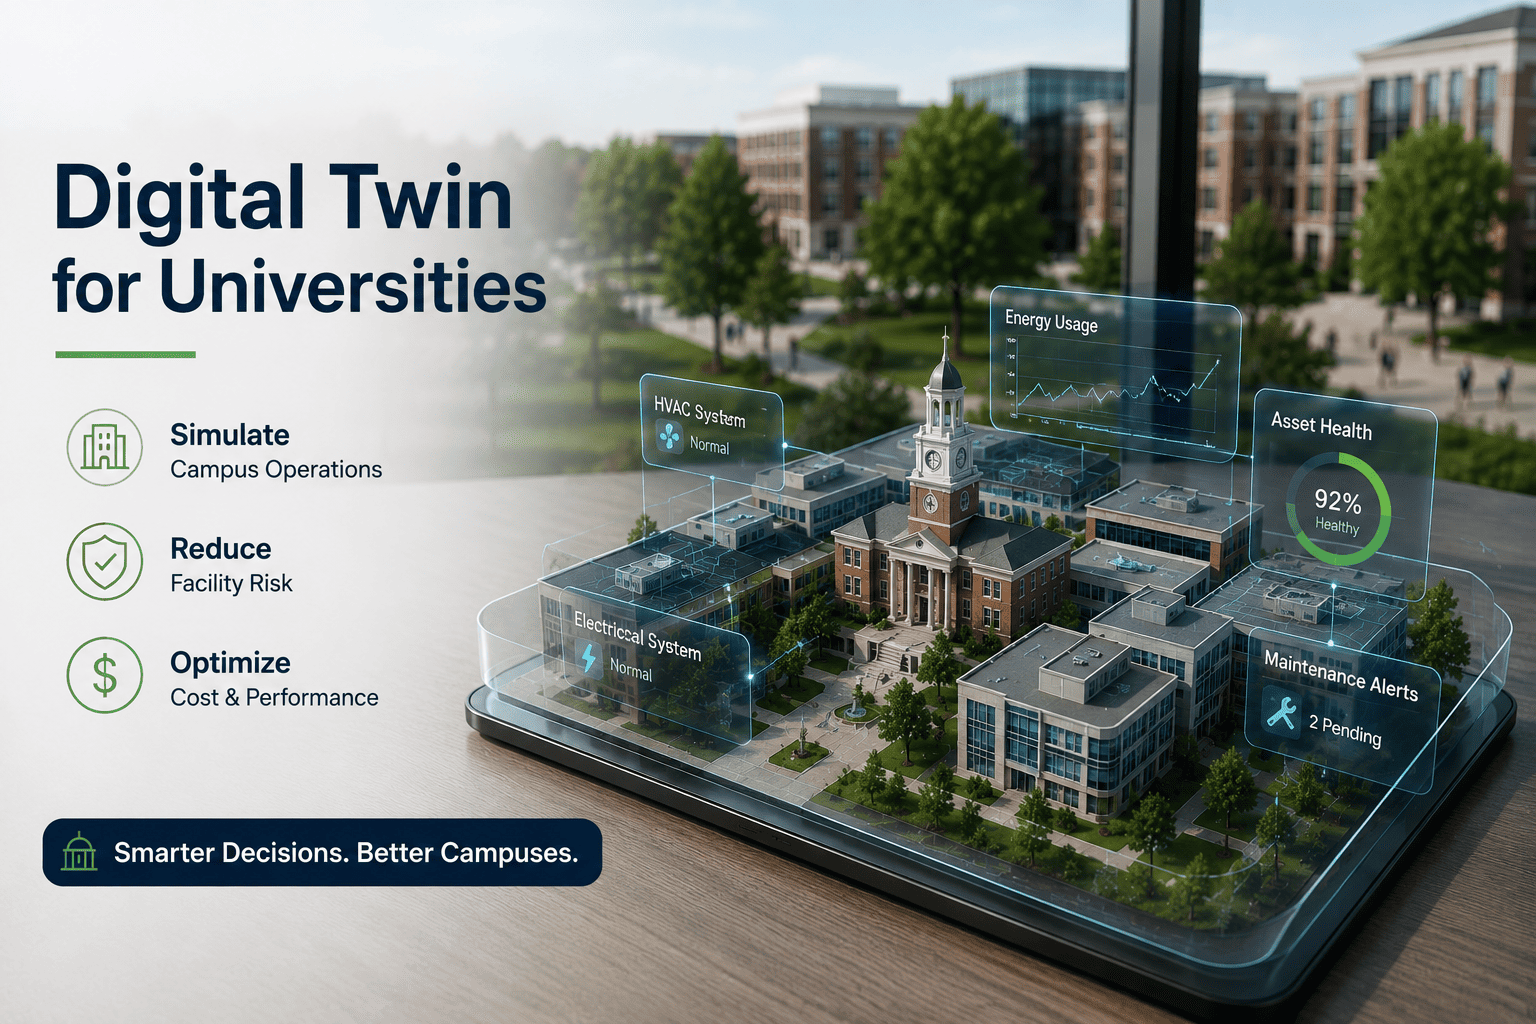
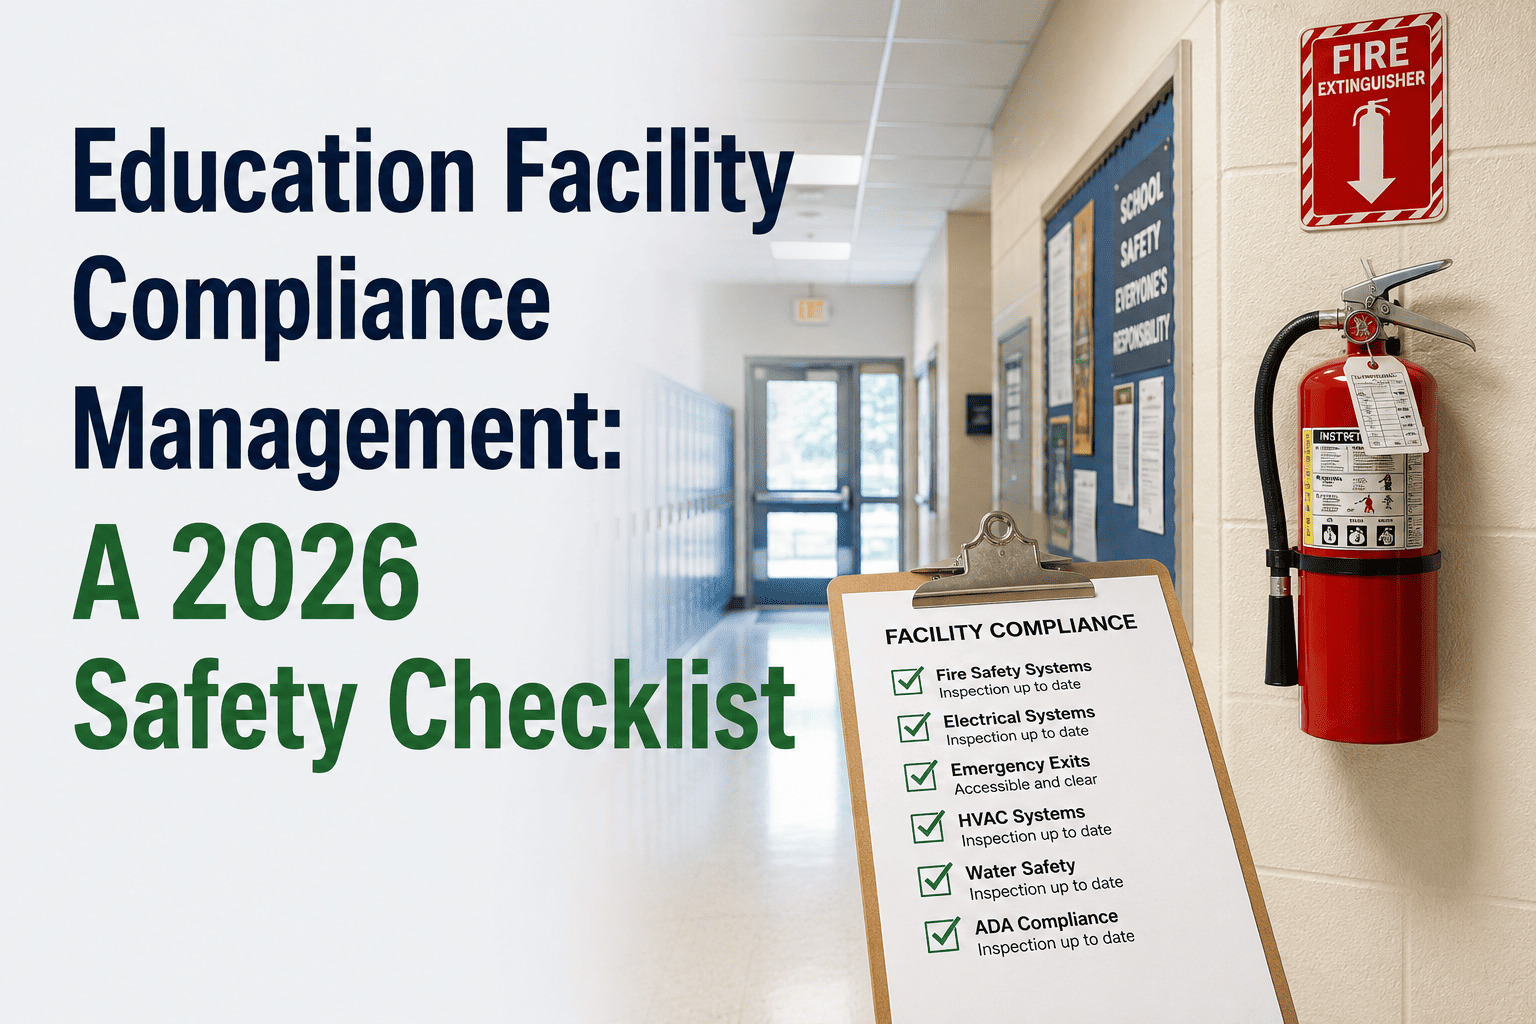
University facility teams in 2026 are managing a risk environment that has expanded faster than most institutions have adapted. Aging infrastructure, a $112 billion deferred maintenance backlog, tightened federal compliance mandates, credit agency scrutiny of facility documentation, and technician vacancy rates exceeding 18% have combined to create compounding exposure across every campus portfolio in the country. The institutions that understand their specific risk profile — and have deployed data systems to monitor, document, and mitigate it continuously — are separating from those that are accumulating liability they cannot yet measure. This report identifies the ten highest-impact facility risks facing universities in 2026, what drives each, and how AI-powered analytics platforms reduce exposure before risks become incidents. Assess your campus risk profile against this framework — Book a Demo.
Top 10 Risks Facing University Facilities in 2026 — And How to Mitigate Them
From infrastructure failure to compliance penalties, explore the biggest risks universities face in 2026 and how AI-powered analytics reduces exposure across every risk category simultaneously.
The 2026 University Facility Risk Landscape
Three forces are converging to elevate facility risk exposure at universities in 2026 beyond any prior period. The enrollment cliff — declining traditional-age student populations — is reducing revenue while fixed facility costs remain constant. Federal regulatory expansion under OSHA 2026, EPA, and tightened accreditor standards is adding compliance obligations that manual documentation systems cannot satisfy at scale. And the deferred maintenance backlog accumulated over years of underfunding is reaching the point where reactive repair costs exceed what planned investment programs could have prevented at a fraction of the price. The institutions that quantify and monitor these risks continuously make fundamentally different decisions than those that discover them during audits.
The Top 10 University Facility Risks in 2026
The single highest-consequence facility risk at universities in 2026 is catastrophic failure of aging infrastructure — chillers, roofing systems, electrical distribution, and plumbing — that has deteriorated beyond safe operating threshold without detection. At institutions where condition assessments occur every two to three years, assets can move from degraded to failure-critical in the interval between inspections. A chiller failure during a summer research period can displace $2-5 million in grant-funded experiments. A roof failure in a dormitory during the academic year triggers displacement costs, liability exposure, and accreditation scrutiny simultaneously.
AI deterioration modeling continuously updates asset condition scores between physical inspections. Alert triggers dispatch maintenance when modeled deterioration reaches a threshold — before failure probability becomes critical. Documented deployments show 60-75% reduction in unplanned failures within 18 months of continuous monitoring deployment.
The new 2026 OSHA Heat Illness Prevention rule creates a documentation obligation that most university facilities teams are structurally unprepared to satisfy. The rule requires ongoing documented HVAC maintenance schedules and temperature monitoring records for all occupied spaces — not a one-time compliance filing, but continuous operational documentation. Institutions without automated compliance systems face two failure modes: the records do not exist, or the records exist in manual formats that cannot be assembled and produced on the timeline an OSHA inspection requires.
Automated compliance documentation generates OSHA-required HVAC maintenance records and temperature monitoring logs continuously from live operational data. All documentation is instantly retrievable — not assembled under inspection pressure. The compliance record exists before the inspector arrives.
Capital projects scoped from condition data that is 18-26 months old routinely miss actual scope by 20% or more. The source of variance is not estimating error — it is that the physical condition of the asset changed between the assessment and the project approval, and no one had current data to reflect the change. Mid-project reauthorizations erode board confidence, consume contingency reserves, and delay other capital investments waiting in the queue. At institutions managing 50-100 simultaneous capital initiatives, this variance compounds into a structural budget reliability problem that undermines the facilities team's credibility with leadership.
Continuous FCI scoring keeps condition data under 30 days old for all assets. Capital projects scoped from current condition data reduce variance from 22% to 6% average. Board capital requests supported by live FCI data achieve single-session approval rather than deferrals for additional evidence.
Expanded EPA testing mandates in 2026 cover lead in drinking water under LCRR 2024, Legionella water management under ASHRAE 188, radon in ground-contact spaces, and asbestos management under AHERA. Each requires ongoing documentation, not just initial compliance. Universities with large pre-1978 building inventories face the highest exposure. A positive lead result that is not communicated to building occupants within the required timeframe creates legal liability that exceeds the cost of the compliance infrastructure that would have prevented the gap.
Automated EPA compliance documentation tracks testing schedules, flags overdue assessments, and maintains notification records for all required frameworks. Corrective action workflows launch automatically on any threshold breach, creating the documented response chain that demonstrates compliance intent even when results are adverse.
Credit agencies reviewing institutional creditworthiness now explicitly factor deferred maintenance documentation into ratings assessments. An institution that cannot produce a Facility Condition Index report showing the scope, trajectory, and remediation plan for its deferred maintenance backlog is assessed higher risk than one that can — regardless of the actual physical condition of the buildings. The institution that manages the same backlog with documented data pays lower borrowing rates than the one that manages it invisibly. Every bond issuance at a higher rate represents a direct financial cost of inadequate facility documentation.
Continuous FCI scoring produces the per-building condition reports, multi-year cost-of-deferral projections, and capital replacement schedules that credit agencies require in lender-ready formats. Institutions with documented remediation trajectories demonstrate stewardship that supports favorable borrowing rate assessments.
Regional accreditation bodies — HLC, SACSCOC, WASC, and MSCHE — require documented evidence of systematic facility condition management, capital planning adequacy, and maintenance program sufficiency as part of institutional self-study. Universities that cannot produce inspection histories, FCI data, and capital replacement schedules referenced in self-study facility sections face findings that trigger monitoring or sanctions. As enrollment pressure increases scrutiny of institutional sustainability, accreditation bodies are elevating the documentation bar for physical plant stewardship.
Inspection histories, FCI data, maintenance completion rates, and capital replacement schedules are produced in accreditation-ready format from live operational data. The facility section of every self-study draws from documented evidence rather than institutional narrative.
Research universities carry a facility risk category that general higher education discussions underweight: grant-funded research disruption from facility failures. A power quality event that compromises a $500,000 electron microscope, a HVAC failure in a controlled-environment laboratory that destroys six months of cell culture work, or a roof leak that floods a data storage room — these events generate losses that are not recoverable from facilities budgets. They cascade into grant reporting failures, PI departures, and reputational damage with federal funding agencies that affects future award competitiveness.
Per-asset environmental monitoring tracks temperature, humidity, power quality, and vibration continuously in research labs and equipment rooms. Deviations alert facilities teams before thresholds are breached — not after damage occurs. Documented deployments show 85% of previously unplanned equipment-environment failures converted to planned interventions.
University energy costs have risen 34% over five years while campus square footage grew only 8%. Most institutions manage energy at the aggregate bill level with no per-building consumption data, no system-level fault detection, and no way to isolate which buildings are driving 40-60% of recoverable waste. As enrollment revenue declines and energy costs continue rising, the gap between aggregate bill management and building-level intelligent management translates directly into budget pressure that competes with instructional investment.
Per-building AI energy monitoring identifies waste sources building by building — unoccupied space conditioning, HVAC degradation, scheduling failures, and simultaneous heating and cooling conflicts. Documented deployments show 15-19% energy cost reductions from existing infrastructure with no capital equipment replacement required.
Technician vacancy rates exceeding 18% at large campuses create compounding risk across every other risk category. Deferred inspections increase infrastructure failure risk. Incomplete compliance documentation increases regulatory risk. Reactive rather than preventive maintenance increases cost risk. And when experienced technicians retire or depart, institutional knowledge of building-specific quirks, historical failure patterns, and system interdependencies leaves with them unless it has been systematically captured in a data system. Paper-based and manual maintenance systems lose this knowledge permanently with every departure.
Automated work order routing, AI scheduling, and digital inspection records capture institutional knowledge in the platform rather than in individual staff members. Every maintenance history, failure pattern, and building-specific configuration is preserved and accessible regardless of team composition. Documented deployments show 12-80 staff hours reclaimed per role per month through automation.
ADA transition plan obligations, elevator inspection certifications, accessible route maintenance, and mass notification system testing each require ongoing documentation that is distinct from the regulatory frameworks already discussed. Institutions receiving federal funding must annually update ADA self-evaluation and transition plans with documented barrier removal progress. An OCR complaint filed against an institution that cannot produce its current transition plan and remediation history creates legal exposure and federal funding risk that is disproportionate to the cost of maintaining current documentation.
ADA transition plan documentation, barrier removal progress records, elevator inspection certificates, and accessible route inspection histories are maintained in a centralized platform updated in real time. Any record is retrievable instantly for OCR response — not assembled under complaint pressure from distributed files and binders.
Risk Severity Summary: All Ten Risks at a Glance
| # | Risk | Severity | Category | With AI Analytics Platform |
|---|---|---|---|---|
| 01 | Catastrophic infrastructure failure | Critical | Operations | 60-75% unplanned failure reduction |
| 02 | OSHA 2026 Heat Illness Prevention non-compliance | Critical | Compliance | Automated continuous documentation |
| 03 | Capital project cost overruns | High | Financial | 22% variance reduced to 6% |
| 04 | EPA environmental testing gaps | High | Compliance | All frameworks automated, zero gaps |
| 05 | Credit rating pressure from undocumented backlog | High | Financial | FCI reports in lender-ready format |
| 06 | Accreditation risk from facility deficiencies | High | Compliance | Self-study evidence automated |
| 07 | Research disruption from equipment failures | High | Operations | 85% failure events prevented |
| 08 | Energy cost escalation without visibility | Medium-High | Financial | 15-19% cost reduction documented |
| 09 | Workforce capacity risk from vacancies | Medium-High | Operations | 12-80 hrs/role/month reclaimed |
| 10 | ADA and life safety compliance gaps | Medium-High | Compliance | All records centralized, instant retrieval |
AI-driven facility analytics platforms address every risk category in this report from a single unified data layer. No system replacement. Core integration live in 60-90 days. Book a Demo to map your campus risk profile against these ten categories.
Frequently Asked Questions
AI-driven facility analytics is proven, deployable, and built for universities operating under real infrastructure, compliance, and financial risk pressure in 2026. The first step is a 30-minute conversation about your campus risk profile.