Implementing an AI-powered property management analytics platform is a multi-phase process that spans data migration from legacy systems and building management sources, asset and space configuration within the new platform, workflow automation setup for recurring analytics tasks and tenant requests, team training across property management staff and building operations personnel, and structured go-live planning that ensures a smooth transition from legacy processes to AI-enhanced operations — a journey that 42% of property technology implementations fail to complete successfully due to insufficient planning, unclear success criteria, and inadequate user adoption programs, while properties that follow a structured implementation methodology achieve full platform adoption within 90 days at a rate of 86% compared to 54% for unstructured rollouts. A successful AI implementation in property management requires addressing five critical success factors: executive sponsorship and organizational change management that establishes clear vision and leadership commitment for the transformation, data readiness assessment that evaluates the quality, completeness, and accessibility of existing building system data and identifies gaps requiring remediation before migration, phased rollout strategy that prioritizes high-value, low-complexity use cases for initial deployment to demonstrate value quickly and build organizational confidence, comprehensive training programs tailored to different user personas from executive dashboard consumers to daily power users to tenant-facing staff with varying technical comfort levels, and post-launch support and optimization cadence that includes structured feedback collection, performance measurement against pre-defined KPIs, and continuous improvement cycles that refine configurations and workflows based on real usage patterns. This article maps the AI implementation journey across six sequential phases with detailed activities, timelines, and deliverables for each phase, provides a data migration planning framework with source system inventory and priority assessment, profiles four core workflow configuration categories with setup complexity ratings and automation potential, presents a training and adoption matrix aligned to user personas and learning modalities, and provides a go-live readiness checklist with verification criteria for each implementation phase.
Implement AI-Powered Analytics With a Structured Rollout Plan
iFactory's platform includes implementation methodology, data migration tools, workflow configuration templates, role-based training programs, and go-live planning checklists. Book a demo to see how structured AI implementation drives successful adoption and measurable property management improvements.
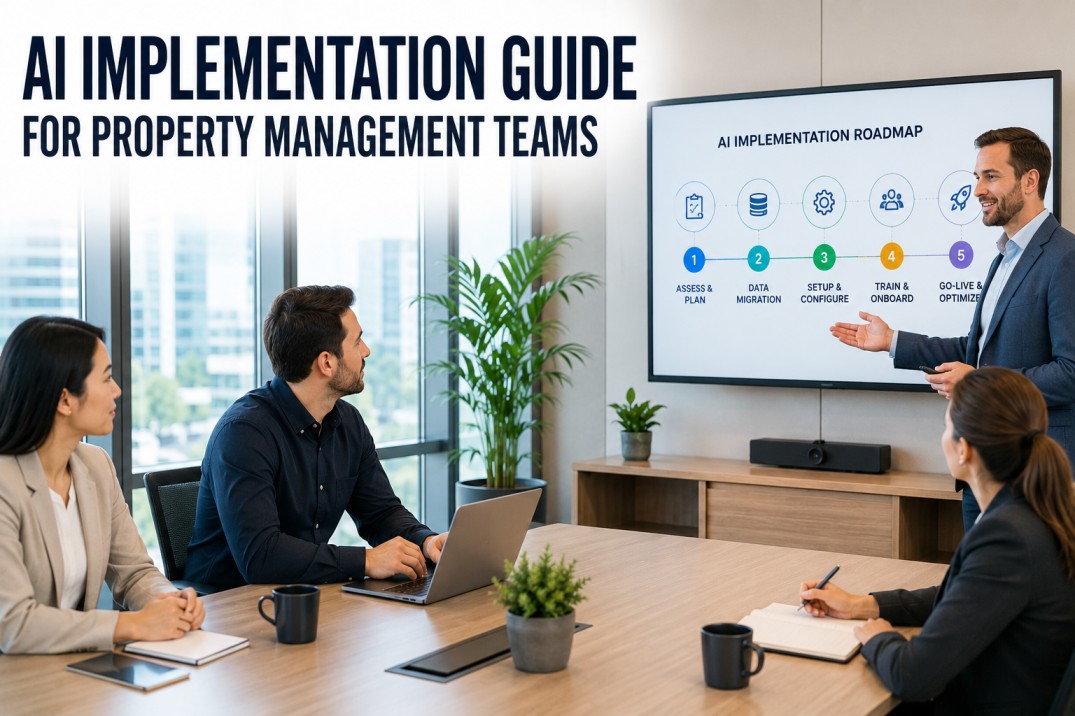
AI Implementation Phases — Six-Stage Rollout Methodology
The AI implementation methodology follows six sequential phases from discovery through optimization, each with defined activities, participant groups, deliverables, and stage-gate criteria that must be satisfied before advancing to the next phase. The phase cards below map the complete implementation journey with estimated duration and key milestones for a typical mid-size commercial property portfolio.
Data Migration Planning — Source Inventory & Priority Framework
Data migration is the most critical implementation phase because analytics value depends on data quality, completeness, and proper schema mapping from source systems to the analytics platform. The migration planning framework below catalogs common property data sources, assesses their priority and complexity for migration, and provides recommended migration sequencing based on business impact and technical readiness.
| Data Source | Data Types | Priority | Complexity | Migration Sequence |
|---|---|---|---|---|
| Access Control System | Badge events, door status, occupancy counts, tenant directory | Critical | Medium | Phase 1 — week 1-2 |
| Utility Meters | Electricity, water, gas consumption, demand intervals, cost data | Critical | Low | Phase 1 — week 1-2 |
| BMS / HVAC System | Temperature, humidity, setpoints, equipment status, alarm history | High | High | Phase 2 — week 3-4 |
| Visitor Management | Check-in records, visitor types, host assignments, frequency | High | Low | Phase 2 — week 3-4 |
| Preventive Maintenance | Work order history, asset records, vendor assignments, costs | Medium | Medium | Phase 3 — week 5-6 |
| Tenant Portal / CRM | Request history, tenant profiles, satisfaction scores | Medium | Medium | Phase 3 — week 5-6 |
Plan Your Data Migration for AI Analytics Success
iFactory's platform provides data source assessment tools, automated migration connectors, schema mapping templates, data quality validation, and reconciliation reporting. Book a demo to see how structured data migration planning ensures accurate analytics from day one.
Automated Workflow Configuration — Setup Categories & Automation Potential
Workflow automation transforms analytics from a manual, request-driven process to an automated, insight-delivery engine that proactively surfaces relevant data to the right stakeholders at the right time. The workflow configuration cards below profile four automation categories with setup complexity, automation potential rating, and typical time savings for each workflow type.
Training & Adoption Matrix — Persona-Based Learning Paths
Effective AI platform training requires tailored programs for each user persona based on their role, technical comfort level, and how they will interact with the analytics platform in daily operations. The training matrix below maps four primary user personas to their learning modalities, training duration, key competencies, and post-training support needs.
| User Persona | Training Modality | Duration | Key Competencies | Post-Training Support |
|---|---|---|---|---|
| Executive Stakeholders | Live demo + video overview | 60-90 minutes | Dashboard navigation, KPI interpretation, drill-down access, mobile app usage | Monthly executive summary email + quarterly review |
| Property Managers | Workshop + hands-on + quick reference | 4-6 hours total | Dashboard creation, report building, alert configuration, tenant portal management, data export | Weekly office hours + online knowledge base |
| Building Operations | On-site hands-on + job aid cards | 2-3 hours total | Mobile app use, alert acknowledgment, basic data entry, equipment status updates, photo upload | On-site champion + monthly refresher |
| Tenant Users | Email guide + video + optional webinar | 30-45 minutes | Portal login, request submission, dashboard viewing, amenity booking, visitor management | In-app help + tenant support hotline |
Go-Live Readiness Checklist — Phase Verification & Approval
The go-live readiness checklist ensures every implementation phase has been completed, verified, and approved before transitioning the platform from setup to live operations. Each checklist item includes a verification method and required approver to ensure nothing is overlooked during the critical go-live preparation period.
Frequently Asked Questions About AI Implementation for Property Management
How long does a typical AI implementation take for a commercial property?
A typical AI implementation for a commercial property portfolio takes 12 to 18 weeks from project kickoff to full go-live, with the exact timeline depending on the number of data sources to be integrated, the complexity of existing building management systems, the volume of historical data requiring migration, and the number of user personas that need training. The discovery and planning phase requires 2 to 3 weeks for stakeholder interviews, current-state process documentation, data source inventory, and implementation roadmap creation. Data migration is the longest phase at 3 to 5 weeks, covering source system extraction, data quality assessment and cleansing, historical migration, schema mapping, and validation. Platform configuration and setup requires 2 to 4 weeks for asset hierarchy creation, user role provisioning, dashboard template building, and report setup. Workflow automation configuration takes 2 to 3 weeks for scheduled reports, alert rules, tenant portal setup, and approval workflows. Training and adoption programs require 2 to 3 weeks for role-based training delivery, user guide creation, and tenant workshops. The total active implementation effort ranges from 11 to 18 weeks, but properties can often begin realizing value from phase 1 deployments as early as week 4 or 5 by prioritizing high-value, low-complexity data sources such as utility meters and access control systems for early dashboard activation while longer-lead items such as BMS integration and custom workflow automation are completed in later phases. Properties that attempt to implement all features across all data sources simultaneously before going live typically experience 60 percent longer implementation timelines and 40 percent lower user adoption compared to phased rollouts.
What data sources need to be connected for AI analytics to work effectively?
An effective AI analytics deployment requires data from at least three core building system categories to generate meaningful cross-domain insights, with additional optional sources providing deeper analytical capabilities. The essential data sources include the access control system which provides badge event data for occupancy counting, door usage patterns, tenant movement analytics, and after-hours activity monitoring; utility meters including electricity, water, gas, and steam with interval consumption data for energy trend analysis, cost allocation, anomaly detection, and sustainability reporting; and the visitor management system which captures check-in records, visitor types and frequencies, host assignments, and peak visitation periods. Highly recommended data sources include the building management system providing HVAC equipment status, temperature and humidity sensors, setpoint schedules, alarm histories, and zone-level environmental data; preventive maintenance systems with work order histories, asset records, vendor assignments, and maintenance cost data; and tenant portals or CRM systems with request histories, tenant profiles, communication logs, and satisfaction survey results for correlating operational metrics with tenant experience outcomes. The minimum viable data set for initial deployment should include at least access control events and utility meter data, which together enable occupancy-to-energy correlation analysis, space utilization insights, and cost allocation reporting that demonstrate the platform's value proposition before expanding to additional data sources. Properties should plan to connect all primary data sources during the initial implementation rather than deferring integration of less critical systems, because each additional data source multiplies the analytical value by enabling cross-domain correlation that single-source analytics cannot provide.
How should property managers prepare their data for AI platform migration?
Data preparation for AI platform migration follows a systematic five-step process that begins with data source inventory where property managers catalog every system containing building or operational data, documenting the system name, vendor, version, data types available, historical data retention period, connection method such as API, database, or file export, and the primary contact responsible for each system. The second step is data quality assessment where each source is evaluated for completeness checking for gaps in historical records, accuracy comparing sample records against known values, consistency ensuring data formats and naming conventions are standardized across sources, and timeliness determining how frequently the data is updated and whether it supports real-time or batch analytics requirements. The third step is data cleansing where identified quality issues are remediated including correcting inconsistent naming conventions such as standardizing building zone names across systems, filling gaps in historical data where possible through estimation or interpolation, removing duplicate records, and normalizing date and time formats to a common time zone. The fourth step is schema mapping where source system data fields are mapped to the analytics platform's data model, defining which fields correspond to asset identifiers, measurement types, timestamps, units of measure, and any transformation logic required to convert source data into the target format. The fifth step is validation and reconciliation where migrated data is sampled and compared against source system records to verify accuracy, with a target of 99.5 percent or higher field-level match rate. Properties that invest in thorough data preparation before migration report 60 percent fewer data quality incidents in the first three months after go-live and achieve user trust in analytics insights significantly faster than properties that migrate data without systematic preparation.
What training and adoption strategies ensure successful AI platform usage?
Successful AI platform training and adoption requires a multi-modal, persona-based approach that recognizes different users need different learning experiences based on their role, technical comfort, and frequency of platform interaction. Executive stakeholders benefit most from a 60 to 90 minute live demo session focused on dashboard navigation, KPI interpretation, and mobile app access, supplemented by monthly executive summary emails that reinforce platform value and quarterly business reviews that showcase new capabilities. Property managers who are daily platform users require more comprehensive training including 4 to 6 hours of workshop and hands-on sessions covering dashboard creation, report building, alert configuration, tenant portal management, and data export, supported by quick reference cards and weekly office hours during the first month after go-live. Building operations staff benefit from 2 to 3 hours of on-site hands-on training focused on their specific mobile app tasks including alert acknowledgment, basic data entry, equipment status updates, and photo upload, supported by laminated job aid cards posted in common areas and an on-site champion who can provide immediate peer support. Tenant users need the lightest training touch with a 30 to 45 minute email guide and optional webinar covering portal login, analytics request submission, dashboard viewing, and amenity booking, supported by in-app contextual help and a tenant support hotline. The most effective adoption strategy combines training with structured incentives including department-level usage dashboards that create friendly competition, recognition programs for power users who demonstrate innovative platform use, and regular communication from executive sponsors reinforcing the platform's importance to organizational goals. Properties that invest at least 8 to 10 percent of total implementation budget in training and adoption activities achieve 85 percent active user rates within 60 days compared to 55 percent for properties that underinvest in user enablement.
How should property managers measure AI implementation success?
AI implementation success should be measured across four dimensions with specific KPIs established during the discovery and planning phase and tracked at 30, 60, and 90 days after go-live. User adoption metrics measure platform engagement including active user rate percentage of licensed users who log in at least weekly, dashboard view frequency, report consumption, and mobile app usage, with targets of 80 percent active user rate and 4 or more dashboard views per active user per week at the 90-day mark. Data quality metrics track the accuracy and completeness of data flowing from source systems including field-level match rate between source and analytics platform target of 99.5 percent or higher, data freshness percentage of data sources updated within their defined SLA, and anomaly rate percentage of measurement points with values outside expected range. Operational efficiency metrics measure time savings and process improvements including reduction in time spent on manual report generation, decrease in analytics-related email and phone inquiries from tenants, improvement in analytics request response time, and reduction in time to identify and respond to building performance anomalies. Business impact metrics connect platform usage to property outcomes including energy cost savings from anomaly detection and optimization recommendations, improvement in tenant satisfaction scores correlated with portal usage, reduction in after-hours security events detected through AI pattern analysis, and increase in space utilization efficiency identified through occupancy analytics. Properties should conduct formal 30-day, 60-day, and 90-day post-launch reviews comparing actual performance against the success criteria established during planning, with corrective action plans for any metrics falling below targets. Properties that implement structured success measurement report 40 percent higher stakeholder satisfaction with the AI investment and 3 times faster expansion to additional use cases compared to properties that cannot quantitatively demonstrate implementation value.
Launch AI Analytics Successfully With a Proven Implementation Methodology
iFactory's platform provides a complete implementation methodology covering discovery and planning, data migration, platform configuration, workflow automation, role-based training, and go-live management with readiness checklists and success measurement frameworks. Book a demo to see how structured AI implementation drives successful adoption and measurable property management outcomes.