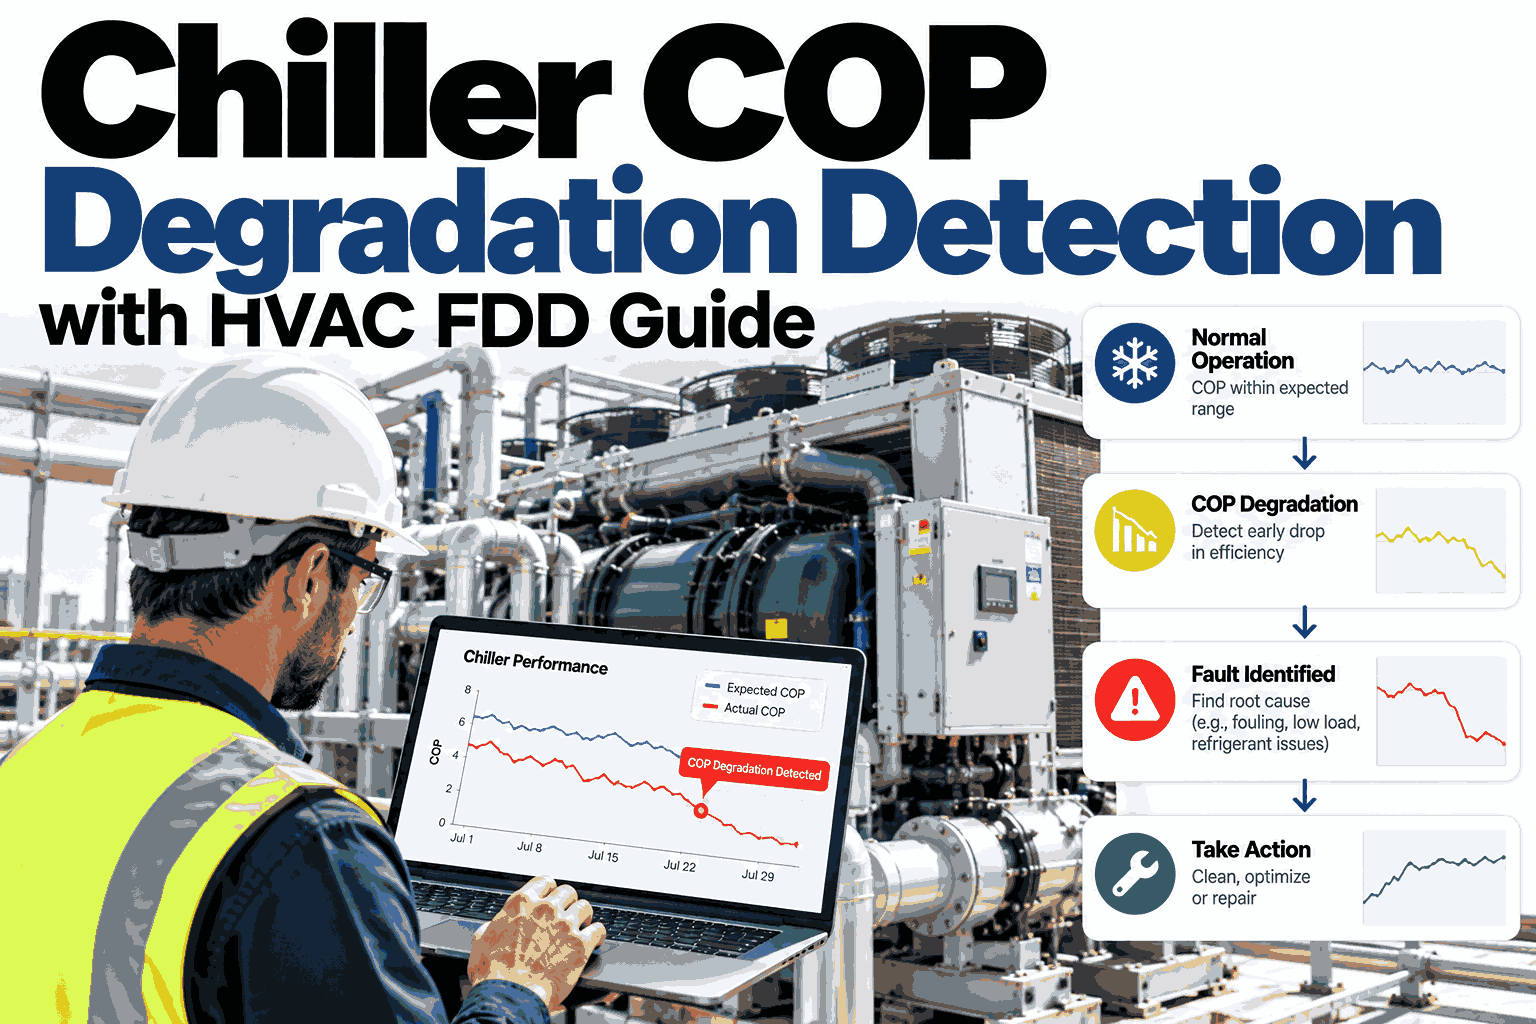
Chillers rarely fail outright, they drift, shedding a fraction of a percentage point of coefficient of performance every week until a plant that used to run at 0.55 kW/ton is quietly burning 0.70 kW/ton with nobody able to point to the day it happened, because log sheets capture a snapshot once a shift and nobody is charting the trend against the load the chiller was actually serving. Most facilities only notice once the utility bill jumps or a technician happens to pull a refrigerant chart during an unrelated service call, by which point the root cause could be fouled condenser tubes, refrigerant undercharge, or a failing economizer valve, and tracing it back after the fact is slow and expensive. The fix is treating COP as a monitored signal rather than a once-a-year audit number, and booking a demo is the fastest way to see what that looks like against your own chiller plant's data.
P3 · AI HVAC FAULT DETECTION & DIAGNOSTICS · COP TRACKING
Catch Chiller Efficiency Loss Before the Utility Bill Does
iFactory's HVAC FDD platform builds a load-normalized COP baseline for every chiller, tracks weekly drift against that baseline, and alerts your team the moment efficiency starts slipping, not months after it already has.
THE SILENT COST
Why Chiller Efficiency Loss Goes Unnoticed for Months
A chiller's coefficient of performance is sensitive to a dozen slowly changing conditions at once, and none of them trip a hard alarm on their own, which is exactly why plants can run degraded for an entire cooling season before anyone connects the dots.
Manual Log Sheets
Readings taken once or twice a shift can't capture a gradual drift, and nobody is plotting kW/ton against tons of cooling delivered over time.
Load Masks Loss
A chiller always looks worse at part load, so a real efficiency loss gets dismissed as normal seasonal behavior instead of flagged.
No Baseline Comparison
Without a reference model of what this chiller should be doing at this load and condenser water temperature, there is nothing to measure drift against.
Root Cause Buried
By the time degradation is obvious, fouling, undercharge, and valve wear have usually compounded together, making diagnosis slower and costlier.
THE METRIC
What COP Actually Measures, and Why Raw Numbers Lie
Coefficient of performance is the ratio of cooling output to electrical input, but a raw COP reading taken in isolation tells you almost nothing about whether the chiller is healthy, because the number swings naturally with load and outdoor conditions.
1%
drop in COP per degree of condenser approach fouling typically adds
10-15%
efficiency loss common from undetected refrigerant undercharge
30-60
days degradation often runs unnoticed between manual log reviews
THE MODEL
Building an Energy Baseline Your Chiller Can Be Measured Against
A baseline model learns how this specific chiller behaves across its real operating range, so every new reading has an honest reference point rather than being judged against a generic spec-sheet number.
01
Historical Data Ingestion
Months of load, kW, condenser water temperature, and chilled water supply data are pulled from the BMS to establish a starting pattern.
02
Load-Normalized Curve Fit
A performance curve is fit across the chiller's full load range, so part-load and full-load behavior are both represented accurately.
03
Condition Adjustment
The model adjusts expected COP for condenser water temperature and ambient wet bulb, so weather swings don't get mistaken for degradation.
04
Live Baseline Output
Every new reading is compared against what the model expects for that exact load and condition, producing a continuous drift signal.
See your own chiller's baseline curve built live
iFactory can run a baseline model against your plant's recent trend data in a working session, not a slide deck.
RAW VS NORMALIZED
Why Load-Normalized Tracking Changes the Answer
Comparing this week's raw COP to last week's raw COP is close to useless if the load profile shifted, which is almost always, so the comparison has to happen on a load-adjusted basis instead.
| Factor |
Raw COP Comparison |
Load-Normalized Tracking |
| Load Sensitivity |
Swings with every change in building load |
Adjusted so load swings don't register as false drift |
| Weather Sensitivity |
Condenser water temperature changes are read as efficiency loss |
Expected COP shifts with condition, isolating true degradation |
| Trend Clarity |
Noisy week-to-week readings hide a slow, real drift |
A clean drift line emerges against the live baseline |
| Actionability |
Technician has to guess whether a dip is real or seasonal |
Alert only fires when the deviation is condition-adjusted and real |
DRIFT ALERTING
Turning a Quiet Trend Into a Timely Alert
Degradation detection only matters if it reaches a technician before the loss compounds, so drift is scored on a simple severity scale that maps directly to what action it should trigger.
Within 3% of baseline
3-8% below baseline
8%+ below baseline
Fouling Signature
A rising condenser approach temperature alongside falling COP points toward tube fouling well before a full inspection would catch it.
Undercharge Signature
Falling evaporator pressure with a widening approach on the chilled water side is a common refrigerant charge signature the model flags.
Economizer Fault
A free-cooling valve stuck partway open shows up as unexpected COP loss during shoulder-season weather windows specifically.
Control Drift
Setpoint or staging logic drifting from design intent produces a steady, slow COP decline that's easy to mistake for mechanical wear.
WHAT YOU GET
Weekly Efficiency Reporting Your Team Can Act On
A drift alert is only useful if it comes with enough context to act on immediately, so each weekly report ties the number back to a likely cause and a next step.
Included Every Week
Load-normalized COP trend chart for every monitored chiller
Drift percentage against the live baseline, condition-adjusted
Likely root-cause signature flagged from the sensor pattern
Recommended inspection or service action, ranked by impact
Rollout Timeline
Weeks 1-2: BMS integration and historical trend data ingestion
Weeks 3-4: Baseline model calibration per chiller
Weeks 5-6: Drift alerting go-live and technician training
FREQUENTLY ASKED QUESTIONS
What Facilities Teams Ask Before Rolling Out COP Monitoring
How much chiller data history does the baseline model need?
A useful starting baseline can typically be built from a few months of trend data covering a reasonable spread of load and condenser water conditions, though the model keeps refining itself as more seasonal data accumulates. A full cooling season of history produces the most accurate condition-adjusted baseline.
Book a demo to see how much of your existing trend history is usable.
Does this replace the annual chiller efficiency audit?
It doesn't replace a full mechanical audit, but it changes what that audit finds, since continuous drift tracking usually means issues get caught and addressed long before the next scheduled audit rolls around. Many teams use the weekly trend data to prioritize which chillers actually need the audit's deeper inspection.
Contact our support team to discuss how it fits alongside your existing audit cycle.
Can this tell the difference between fouling and refrigerant charge issues?
The model looks at the combination of condenser approach temperature, evaporator pressure, and COP drift together, and each root cause tends to leave a distinct signature across those readings. It won't replace a technician's diagnostic confirmation, but it narrows down which fault is most likely before anyone opens a panel.
Book a demo to see sample fault signatures from real plant data.
What if our chillers already have a factory-installed diagnostics package?
Factory diagnostics packages are usually built around fixed thresholds on a single chiller in isolation, while this layer builds a condition-adjusted baseline and can compare performance across your whole plant, including chillers from different manufacturers side by side. It works alongside existing packages rather than requiring their removal.
Contact our support team to discuss your specific chiller lineup.
How early can a developing fault actually be caught?
Because the baseline comparison runs continuously rather than waiting for a scheduled check, drift that would otherwise take months to notice on a log sheet typically shows up as a flagged trend within a few weeks of it starting. The exact lead time depends on how fast the underlying fault develops.
Book a demo to walk through real detection timelines from existing deployments.
CATCH THE DRIFT BEFORE THE BILL DOES
Give Your Chiller Plant a Baseline It Can Be Measured Against
iFactory's HVAC FDD platform builds a load-normalized COP baseline, tracks weekly drift, and flags the likely root cause before efficiency loss becomes an unplanned repair.