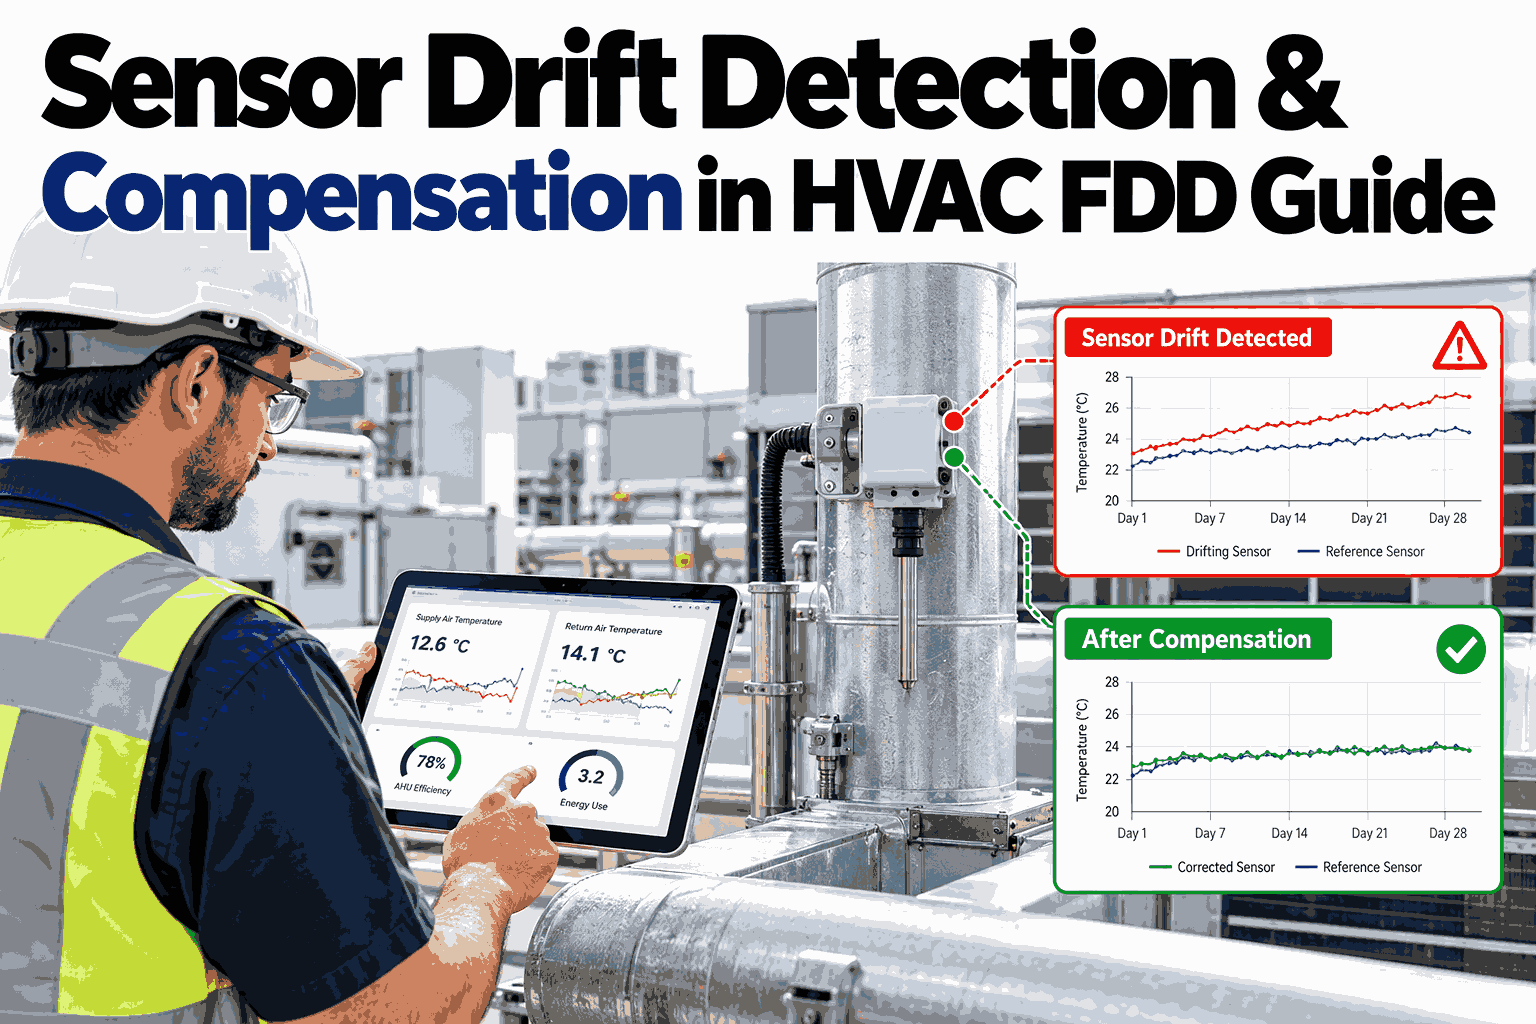
A temperature sensor that reads three degrees high rarely triggers an alarm, which is exactly why it is dangerous. The economizer, the cooling reset and the fault detection model all keep trusting the number, and the building quietly pays through wasted energy, comfort complaints and technician visits that find nothing wrong. Sensor drift is the silent cause behind many false alarms and missed faults in HVAC fault detection and diagnostics (FDD), and it grows as a fleet ages. Teams that want to see how drift is caught and corrected can watch drift cross-checks run on live HVAC data with the iFactory AI team.
Catch Sensor Drift Before It Teaches Your FDD the Wrong Normal
iFactory AI cross-checks critical HVAC sensors against their physical partners and virtual sensors, flags slow drift early and compensates for it, so fault detection stays trustworthy year after year.
A Failed Sensor Is Loud, a Drifting Sensor Is Silent
A dead sensor throws an obvious error and gets fixed within days. A drifting sensor keeps sending believable numbers, so every system downstream treats them as fact.
The last link is the most expensive one. Once operators learn that alerts are often wrong, they start ignoring them, and the next real fault gets the same treatment.
For portfolios with hundreds of rooftop units and air handlers, nobody can check sensors by hand on a regular cycle. That is why many teams review how portfolio-wide drift scoring works before a drift problem becomes an energy problem.
Five Ways a Sensor Goes Wrong, and What Each One Looks Like
Each failure pattern leaves a different shadow in the data. The dashed line below is the expected value, and the solid line is what the sensor reports.
Noise and stuck values usually get caught by simple range and flatline rules. Offset and ramp drift pass every one of those rules, which is why they need cross-checks.
Three Pair Tests That Expose Drift Without Taking a Sensor Offline
Pair testing compares a sensor with another measurement that must agree with it under known conditions. It needs no ladder and no reference instrument, only physics and good timing.
Test A is easiest to turn into a number, because mixing air follows a simple balance between the two incoming streams.
The outside air fraction can be estimated from damper position or from the temperatures themselves. Treat the result as an estimate with a tolerance, because real air stratifies and never mixes perfectly.
Most teams find that the tests work best when tuned to each unit type, so it helps to try the pair checks on your own unit data before setting alert limits.
How a Three-Degree Mixed Air Drift Shows Up in the Data
Numbers make the method easier to trust. Here is one rooftop unit in steady cooling conditions, checked the way the software does it in the background.
The arithmetic is short: 75 + 0.3 x (45 − 75) gives 66°F, and the sensor reports 69°F. One reading like this proves nothing, since mixing is imperfect.
What matters is the trend. A gap that creeps from under one degree to about three across similar conditions is drift, and the system raises a drift flag instead of a fault, because the unit itself may be healthy.
See Drift Flags on Your Own Rooftop Units and Air Handlers
Share a few typical units and see how pair tests and drift scoring would treat your sensors, your tolerances and your building types.
When No Partner Sensor Exists, Build One From the Physics
A virtual sensor estimates what a reading should be by using other measurements the unit already reports. It gives you a second opinion on points that have no physical twin.
Two families of virtual sensors are common. Physics-based ones use energy balances, mixing equations and fan relationships, while learned ones fit a model to healthy operating history.
That dependence is the main trap. A model trained on data that already contains drift will happily predict the drifted value, so training windows should be anchored to periods where sensors were verified.
Teams that already collect trend data from their building automation system can often start quickly, and a short call helps to map which of your points can get a virtual twin.
Give Every Sensor a Trust Score, Then Decide How to Respond
A trust score blends the size of the residual, how long it has persisted, how many tests agree and how long it has been since the last calibration. The map below shows the idea for one unit.
The score then decides the response. Small drift gets watched, moderate drift gets compensated, and large or unstable drift gets a work order.
These limits are only an example. Real limits depend on the sensor type, the decision that relies on it and the tolerance your buildings can accept.
Applying a correction to control signals is a bigger step that should involve the controls team. If you want to see how corrections are logged and reversed, ask for a compensation audit trail walkthrough during a session.
Where Each Sensor Tends to Drift and How to Cross-Check It
Every sensor family ages differently, so the best cross-check changes with the measurement. This table is a practical starting point rather than a fixed rulebook.
| Sensor | Common drift pattern | Best cross-check partner | Usual first action |
|---|---|---|---|
| Outside air temperature | Slow bias from sun exposure or a poorly placed probe | Nearby units and a local weather reference | Compare against the fleet and review the mounting |
| Mixed air temperature | Offset plus noise from stratified airflow | Return air, outside air and damper position | Run the physical bound test and widen tolerance |
| Supply air temperature | Gradual offset, sometimes after coil cleaning or repair | Coil energy balance and downstream duct sensor | Run the redundant pair test |
| Space and return air temperature | Step offset from wall disturbance or relocation | Neighbouring zones and idle convergence | Check during unoccupied periods |
| Relative humidity | Gradual drift as the element ages or gets contaminated | Outdoor conditions and other units on the same site | Trend against the fleet, then schedule calibration |
| Carbon dioxide | Baseline creep over months | Unoccupied hours, when readings should fall near outdoor levels | Check the baseline and recalibrate if it has moved |
| Duct static pressure | Zero offset that shows up when the fan is off | Fan speed and pressure relationship | Zero check at shutdown |
Notice that several of these checks rely on quiet periods such as unoccupied hours or fan-off windows. Good drift software learns when those windows occur on each unit and uses them automatically.
A Four-Step Path to Drift-Aware FDD and a Readiness Checklist
Most teams start with the sensors that drive the most expensive decisions, then widen the net as trust in the scores builds.
Before starting, a short readiness check keeps the pilot focused and the results easy to read.
A pilot on a handful of units is usually enough to see the pattern, and teams often plan a drift pilot scope with a specialist before committing to a wider rollout.
What Facility Teams Ask Before Adding Drift Detection to FDD
See Sensor Drift Detection Working on Your Own HVAC Fleet
Book a session with iFactory AI to review your sensors, tolerances and trend data, and see how drift-aware fault detection can keep your HVAC alerts accurate.