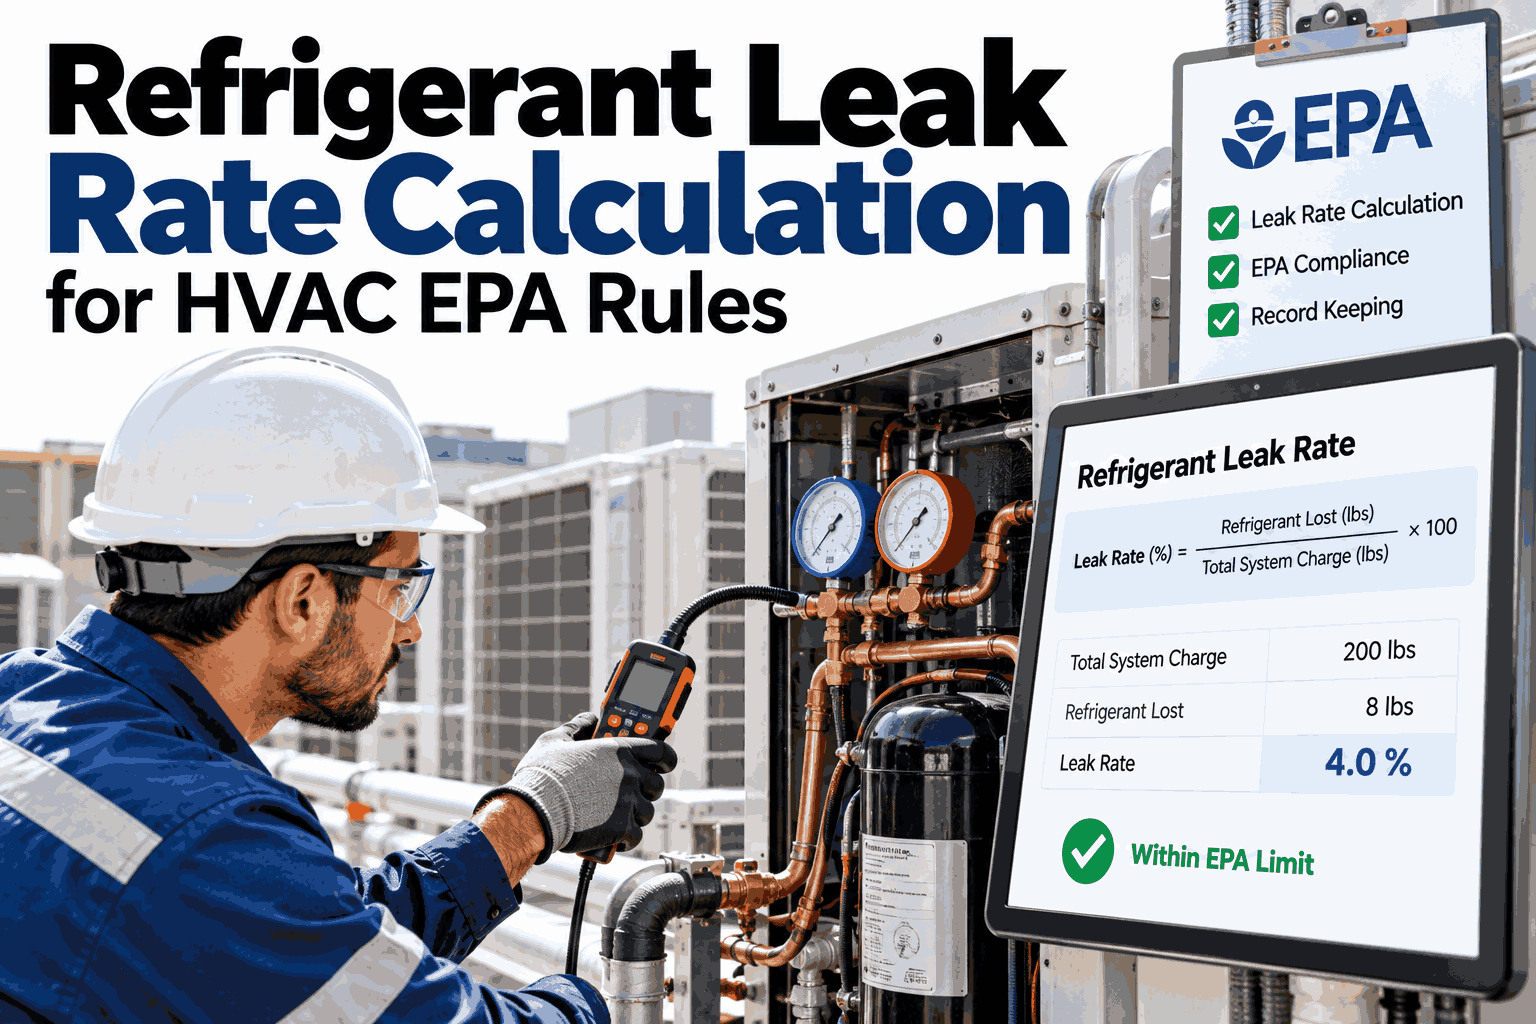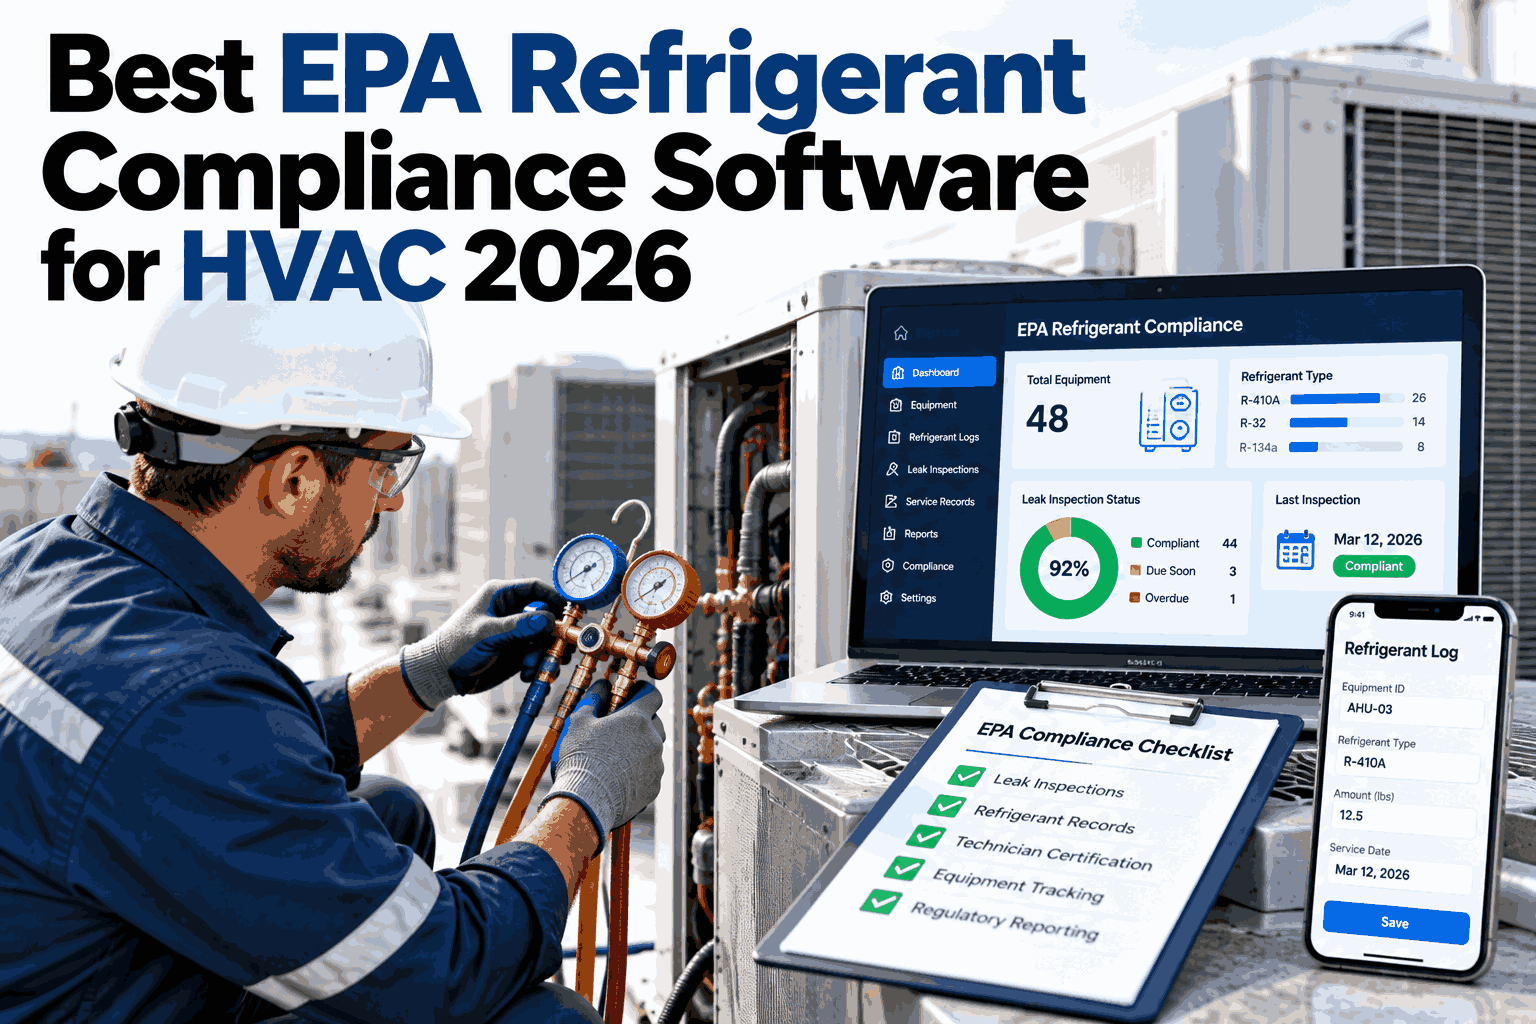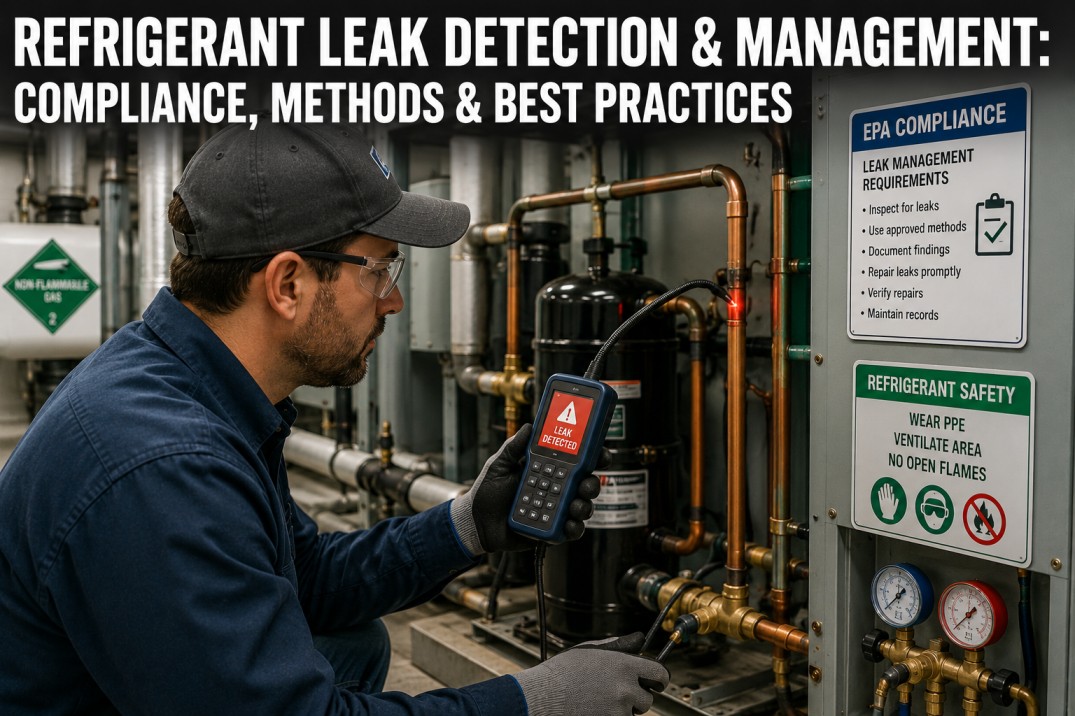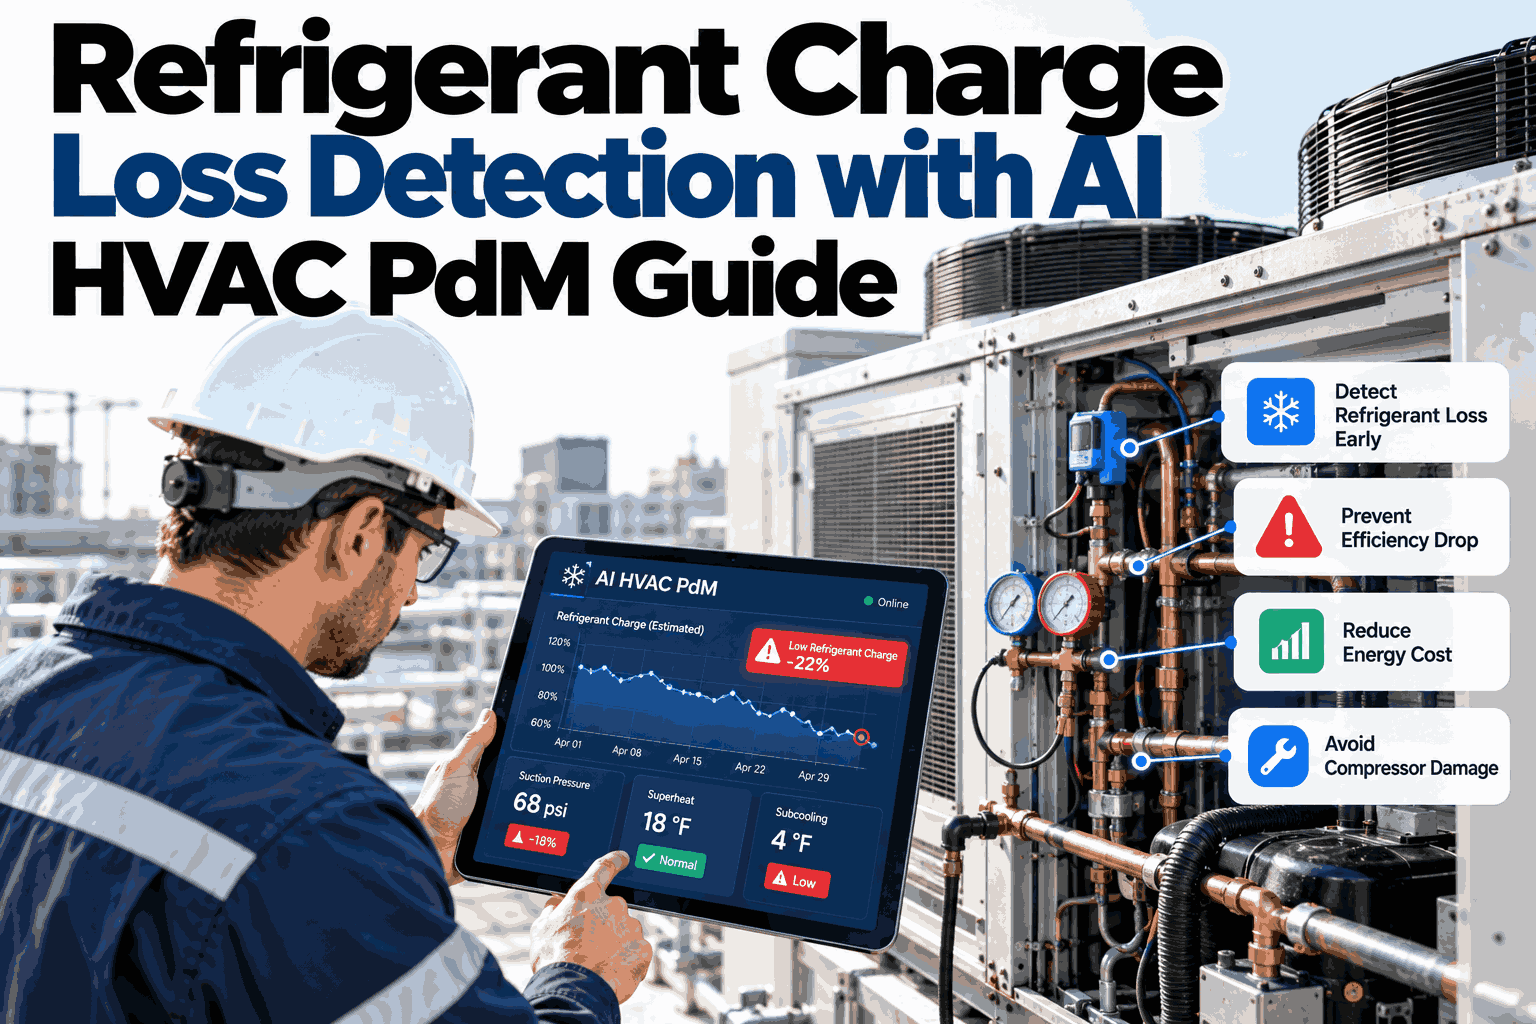
A rooftop unit that is a little low on refrigerant still cools the building, which is exactly why nobody notices. The compressor runs longer, the energy bill creeps up, and the coil temperatures drift a few degrees at a time while comfort complaints stay quiet. By the time a technician finds the leak, the unit has often been wasting energy for months and sometimes the compressor has already been stressed. Charge loss leaves a clear fingerprint in superheat, subcooling and pressure data long before the failure. This guide explains those patterns and how AI reads them, and if you want to see it on your own equipment, you can review slow leak detection for your HVAC fleet with our team.
Refrigerant Charge Loss Detection with AI: An HVAC PdM Guide
How superheat, subcooling and pressure ratio patterns reveal a slow leak months before efficiency collapses or a compressor trips.
Why a Slow Leak Costs More Than a Sudden One
A burst is obvious and fixed fast. A slow leak is quiet and keeps costing money every hour the unit runs.
Because the loss grows gradually, it is easy to mistake for a hot summer or a dirty filter, which delays the real fix.
Superheat, Subcooling and Pressure Ratio in Plain Terms
Each signal is a simple calculation from readings most units already have or can easily add.
Diagnostic Matrix: Low Charge Looks Different From Other Faults
Several faults raise or lower the same readings. The combination is what separates a leak from a dirty coil or a restriction.
| Condition | Superheat | Subcooling | Suction pressure | Discharge pressure |
|---|---|---|---|---|
| Low charge | High | Low | Low | Low |
| Overcharge | Low | High | High | High |
| Dirty condenser | Normal to low | Normal to high | Slightly high | High |
| Low evaporator airflow | Low | Normal | Low | Low |
| Liquid line restriction | High | High | Low | Low to normal |
These are general patterns. Systems with thermostatic or electronic expansion valves can hold superheat steady until the charge is quite low, so subcooling and trend direction matter most.
See Slow Leak Patterns on Your Own Chillers and RTUs
Share your equipment types and available sensor data, and we will show which charge loss signals can be tracked today.
Six Months of Quiet Subcooling Decline
This illustrative chart shows monthly average subcooling on a unit with a slow leak. No single month looks alarming, but the trend is clear.
A technician checking once a year would see only one point on this line. Continuous data shows the slope, and the slope is the warning.
What the Model Does That a Fixed Alarm Cannot
Fixed limits trigger late and fire falsely when weather changes. AI compares each unit against its own normal for the same conditions.
A Sample Notification a Technician Would Receive
The message names the evidence and the next step, so the technician arrives with a plan rather than a vague warning.
Six Readings That Make Charge Loss Visible
Many modern units already expose some of these through their controls. The rest can be added with clamp-on probes and low cost transducers.
A Simple Three-Level Response Playbook
Charge added after a repair also feeds your leak rate records for compliance. You can ask support how alerts link to refrigerant records in one workflow.
What Facilities Teams Ask About AI Charge Detection
Bring AI Charge Loss Detection to Your HVAC Fleet
Book a session with iFactory AI to see how superheat, subcooling and pressure patterns can warn you about slow leaks before energy waste and compressor damage set in.