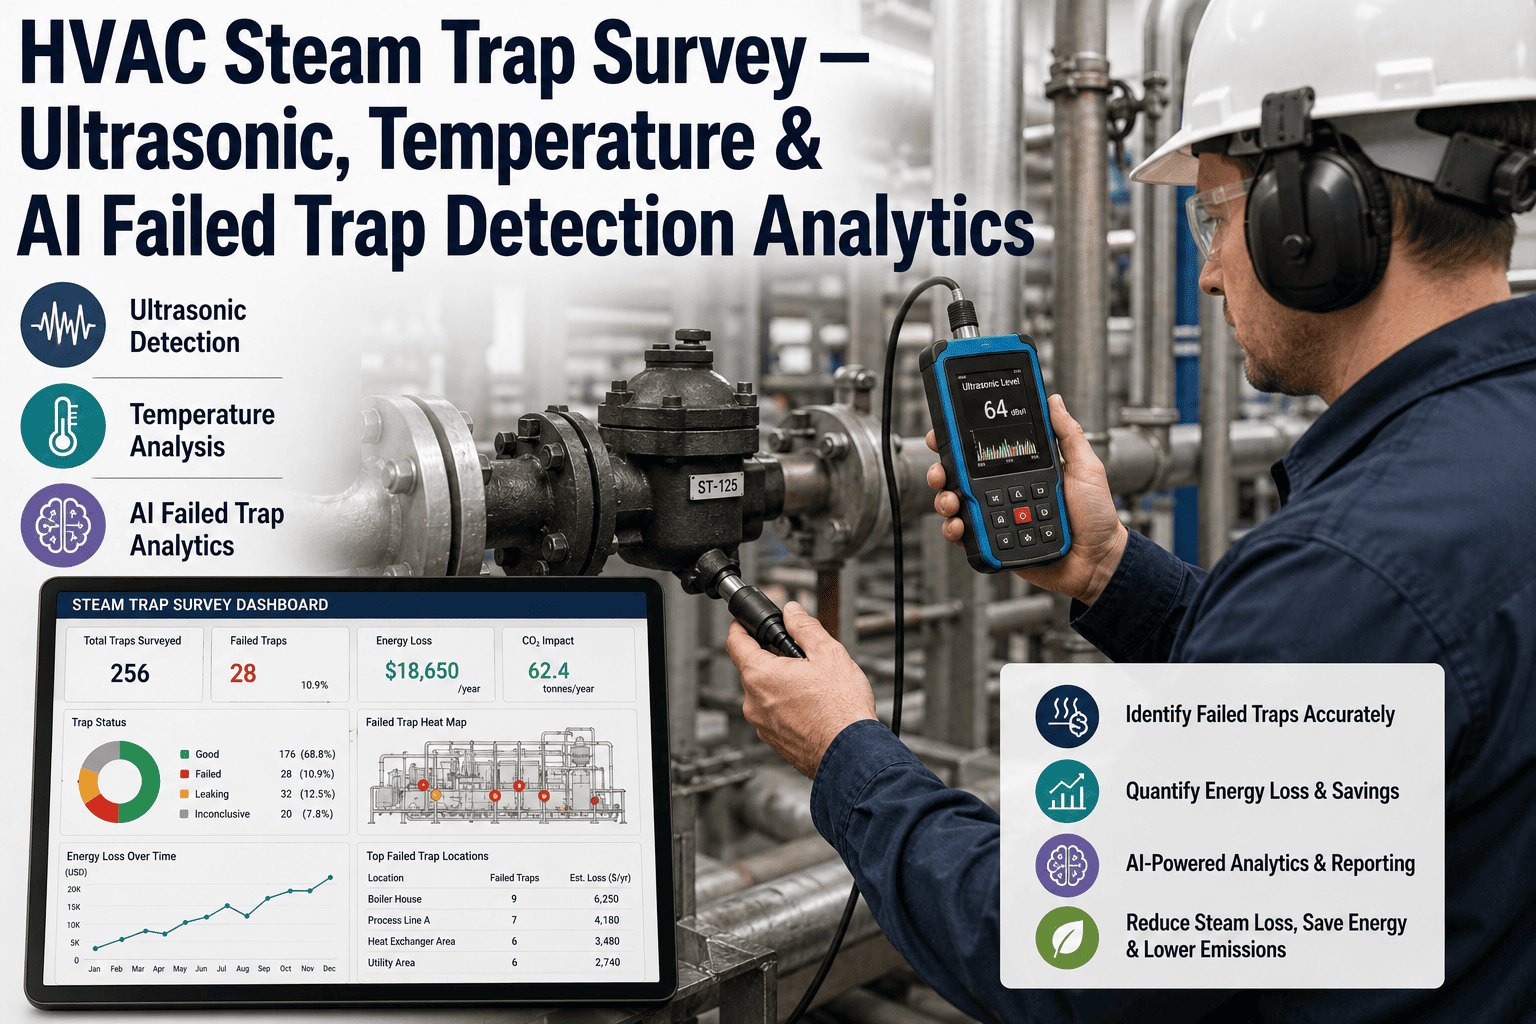
Somewhere in a typical commercial or institutional steam heating system, right now, there is almost certainly a steam trap stuck open, silently venting live steam into a condensate line, and nobody knows it. A failed-open trap makes no unusual noise a passing engineer would notice, trips no alarm, and often keeps the building comfortable while wasting fifteen to twenty-five percent of total steam energy across the system. Manual surveys with handheld ultrasonic and temperature instruments only happen once or twice a year, leaving months of undetected waste between checks. AI-driven continuous trap monitoring closes that gap. iFactory's building energy engineering team deploys ultrasonic and temperature-based AI trap failure detection across steam heating systems of any scale.
Predictive Maintenance · Steam System AI
HVAC Steam Trap Survey — Ultrasonic, Temperature, and AI Failed-Trap Detection
AI-driven analytics on ultrasonic acoustic signatures and temperature differential data identify failed-open, failed-closed, and leaking steam traps continuously, catching the fifteen to twenty-five percent steam energy waste that manual annual surveys miss for months at a time.
Steam Trap Failure Impact
15–25%
Typical steam energy wasted
3 Types
Failed-open, failed-closed, leaking
Annual
Typical manual survey frequency
AI
Continuous acoustic + thermal analysis
Why Trap Monitoring Matters
The Steam Energy Loss That Never Shows Up on a Comfort Complaint
A steam trap's job is simple in principle: allow condensate and air to pass through while blocking live steam. When a trap fails open, it stops doing that job selectively and instead passes live steam continuously into the condensate return system, where that steam energy is either lost entirely or has to be recovered at significant additional cost and complexity compared to using it for heating in the first place. Because the building on the other end of the distribution system is often still receiving adequate heat from the rest of the system, a failed trap produces no comfort complaint, no occupant call, and no obvious signal that anything has gone wrong.
The scale of the waste is the reason steam trap management gets so much attention from energy managers once they understand it. Industry studies consistently put the fraction of steam traps in a typical uninspected system that have failed at somewhere between fifteen and thirty percent, and each failed-open trap represents continuous, unmetered steam loss for as long as it goes undetected. Across a large distribution system with hundreds of traps, even a modest failure rate translates into a meaningful fraction of total steam generation cost, month after month, invisible on any single energy bill line item.
The opposite failure mode — a trap failed closed — causes a different but equally costly problem. A closed-failed trap blocks condensate from draining, which can cause waterlogging in the steam space, reduced heat transfer, and in some configurations, water hammer that damages piping and fittings over time. Both failure modes are acoustically and thermally distinguishable from normal operation, which is exactly what makes ultrasonic and temperature-based AI detection effective at identifying not just that a trap has failed, but which type of failure has occurred.
Survey Method Comparison
Annual Manual Survey vs. Continuous AI Trap Monitoring
The core detection physics — ultrasonic acoustic signature and temperature differential across the trap — hasn't fundamentally changed in decades. What has changed is the frequency and consistency with which that data can be collected and analyzed.
| Factor |
Annual Manual Survey |
Continuous AI Monitoring |
| Detection frequency |
Once or twice per year |
Continuous or high-frequency scanning |
| Time-to-detection after failure |
Up to 12 months |
Hours to days |
| Consistency across surveys |
Dependent on technician skill and route |
Standardized, repeatable analysis |
| Failure type classification |
Manual judgment, variable accuracy |
AI pattern classification across signature library |
| Documentation for energy claims |
Point-in-time report |
Continuous trend history and savings verification |
The time-to-detection gap is the single biggest driver of unnecessary energy cost. A trap that fails the week after an annual survey can waste steam energy continuously for up to eleven months before anyone notices, and across a large facility that failure pattern repeats across dozens of traps every year, compounding into a substantial recurring cost that continuous monitoring is specifically designed to eliminate.
See Trap Failure Detection Live
Watch AI Classify a Steam Trap Failure From Acoustic and Temperature Data
Book a walkthrough with iFactory's building energy engineering team and see AI trap failure detection running against real steam distribution data — acoustic signature classification, temperature differential analysis, and energy loss quantification.
Failure Classification
The Three Steam Trap Failure Modes AI Detection Identifies
Not every trap failure looks the same acoustically or thermally, and the corrective action differs by failure type. AI classification distinguishes between them rather than issuing a single generic alarm.
Failure 1
Failed Open — Continuous Steam Loss
The trap passes live steam continuously rather than intermittently, producing a sustained ultrasonic signature and elevated downstream temperature approaching supply steam temperature. This is the highest-cost failure mode, wasting steam energy around the clock until repaired.
Failure 2
Failed Closed — Blocked Condensate
The trap stops passing condensate entirely, producing a cold downstream temperature signature and risk of waterlogging in the connected steam space. Less costly in direct energy terms but risks equipment damage and reduced heating performance.
Failure 3
Leaking — Intermittent or Partial Loss
The trap passes some steam intermittently or continuously at a reduced rate, producing a partial acoustic signature that's easy to miss on a single manual inspection but shows clearly as a persistent anomaly across continuous monitoring data.
Detection Methodology
How Ultrasonic and Temperature Data Become a Failure Classification
Reliable trap failure detection depends on combining two complementary data sources rather than relying on either one alone, since each has blind spots the other compensates for.
01
Ultrasonic Acoustic Capture
Ultrasonic sensors, either permanently mounted or deployed on a scanning route, capture the high-frequency acoustic signature produced by steam and condensate flow through the trap body, distinguishing normal cycling operation from continuous flow.
02
Upstream and Downstream Temperature Differential
Temperature sensors on either side of the trap measure the differential that indicates whether the trap is properly blocking live steam or allowing it to pass through into the condensate line, confirming what the acoustic signal suggests.
03
AI Pattern Classification
Machine learning models trained on a large library of known trap failure signatures classify each reading against normal operation, failed-open, failed-closed, and leaking patterns, reducing false positives that would otherwise generate unnecessary maintenance visits.
04
Energy Loss Quantification
Each detected failure is translated into an estimated steam energy loss based on trap orifice size, system pressure, and time since likely failure onset, giving facility teams a dollar figure to prioritize repair scheduling.
05
Repair Prioritization and Verification
Detected failures are ranked by energy cost impact, and once repaired, the same monitoring confirms the trap has returned to normal cycling behavior, closing the loop on the maintenance action with verified data rather than a completed work order alone.
Deployment Roadmap
From Trap Inventory to Continuous Failure Detection
Deploying AI-driven steam trap monitoring typically runs six to ten weeks, shaped primarily by the size of the trap population and whether the deployment uses permanently mounted sensors, a scanning route, or a hybrid approach.
Phase 1
Trap Inventory and Criticality Mapping
Every trap in the distribution system is inventoried by type, size, and location, with criticality assigned based on steam pressure, connected load, and estimated failure cost to prioritize monitoring coverage.
Phase 2
Sensor Deployment Strategy
High-criticality traps receive permanently mounted ultrasonic and temperature sensors for continuous monitoring, while lower-criticality traps are covered through a periodic AI-assisted scanning route using handheld instrumentation.
Phase 3
Baseline Signature Capture
Normal operating signatures are captured for each monitored trap to establish the baseline against which future deviations are measured, accounting for the specific trap type and application.
Phase 4
Classification Model Validation
Detected failures are cross-verified against physical inspection during the initial deployment period to confirm classification accuracy before the system becomes the primary detection method for the facility.
Phase 5
Go-Live With Prioritized Repair Workflow
Live detection feeds directly into the maintenance work order system, with energy loss quantification driving repair prioritization rather than a first-come-first-served maintenance queue.
Phase 6
Ongoing Savings Verification
Continuous monitoring data supports ongoing energy savings documentation, useful for utility incentive programs and internal energy management reporting that requires verified rather than estimated savings.
Field Perspective
"
Steam trap management has always been considered basic energy hygiene, but in practice most facilities do it badly, not because the concept is hard but because an annual survey with a handheld ultrasonic gun on a large campus is genuinely difficult to execute thoroughly and consistently. I've reviewed survey reports where the same trap gets a different pass or fail judgment two years running from two different technicians, simply because failure signatures on some trap types are subtle and judgment-dependent. Continuous monitoring removes that inconsistency entirely, and what surprises facility teams most isn't the individual failures it catches — it's how much total steam loss was accumulating across dozens of traps that all failed quietly between survey cycles, completely invisible until the data made it visible.
Marguerite Solheim-Osei
Building Energy Systems Engineer · 19 years in steam distribution efficiency and industrial energy auditing
Common Questions
Frequently Asked Questions
Do we need to instrument every steam trap in the facility for this to be worthwhile?
No. Most facilities get the majority of the value by prioritizing continuous monitoring on higher-pressure, higher-criticality traps where a failure has the greatest energy cost impact, while covering lower-priority traps through a periodic AI-assisted scanning route that still improves on manual-only surveys through more consistent classification. The criticality mapping performed during onboarding is specifically designed to identify where continuous sensors deliver the strongest return relative to their deployment cost.
Talk to energy engineering to review a phased approach for your trap population.
How accurate is AI classification compared to an experienced technician using a handheld instrument?
AI classification trained on a large signature library is generally more consistent than manual judgment, since it applies the same analysis criteria to every reading regardless of technician experience or fatigue late in a long survey route. Experienced technicians remain valuable for physical inspection, confirming trap type and installation condition, and handling edge cases the model flags as ambiguous, but the classification consistency of continuous or high-frequency AI monitoring generally exceeds what an annual manual survey can achieve across a large trap population.
Can this monitoring approach work on older steam systems with traps of unknown age and type?
Yes, though the initial trap inventory step is more involved on systems without complete documentation. Field verification of trap type and size during the inventory phase establishes the baseline needed for accurate classification, and this verification step often surfaces additional value on its own by identifying traps that were undersized, oversized, or mismatched to their application at some point in the system's history.
Book a demo to discuss inventory approaches for legacy steam systems.
How quickly do facilities typically see documented energy savings after deployment?
Most facilities identify at least several failed-open traps within the first month of monitoring that had gone undetected since the last manual survey, and the associated energy savings from prompt repair are typically the fastest-realized value in the deployment. Because failed-open traps waste steam continuously and prompt detection allows immediate repair scheduling, the savings curve is generally steepest in the first quarter after go-live before settling into the ongoing, lower-magnitude value of catching new failures quickly as they occur throughout the year.
Does the system distinguish trap failures from other steam system issues like pressure regulation problems?
Yes. Because the classification model analyzes the specific acoustic and thermal signature at each individual trap location rather than a system-wide pressure or flow metric, it distinguishes a localized trap failure from broader system issues such as pressure regulating valve drift or boiler cycling irregularities, which produce different signature patterns and typically require investigation of separate equipment entirely rather than trap repair.
Steam System Ready for Continuous Trap Monitoring
Stop Losing Steam Energy to Traps Nobody Knows Have Failed
iFactory's AI-driven ultrasonic and temperature trap monitoring platform catches failed-open, failed-closed, and leaking traps continuously, classifies the failure type, quantifies the energy loss, and verifies the repair — closing the months-long detection gap left by annual manual surveys.