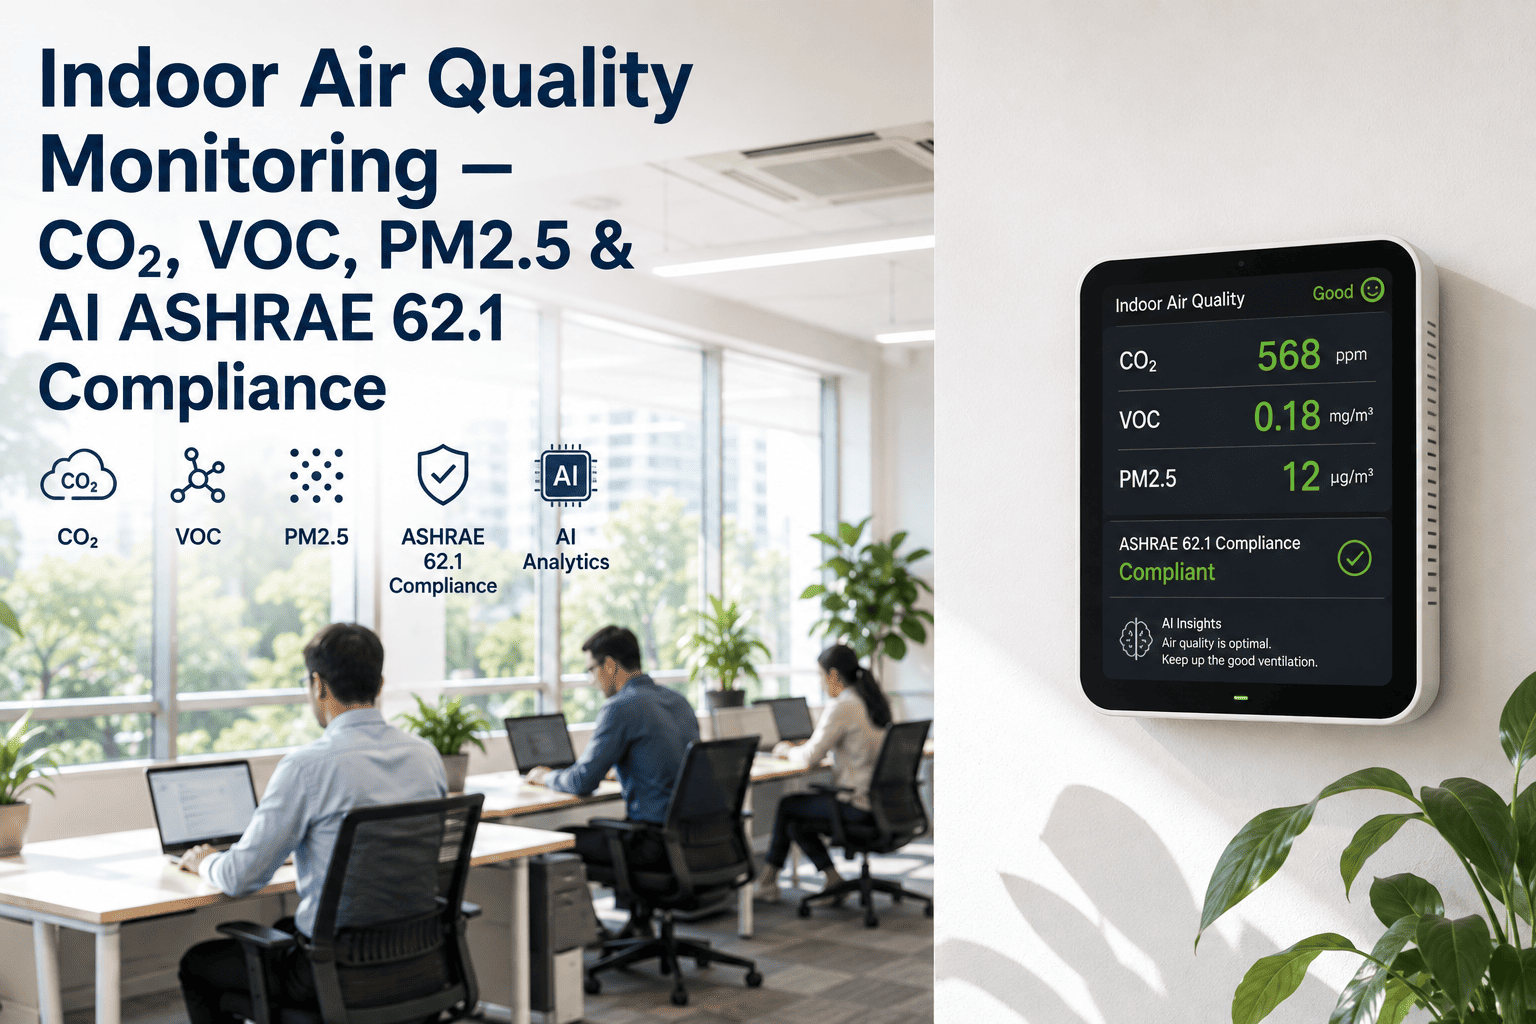
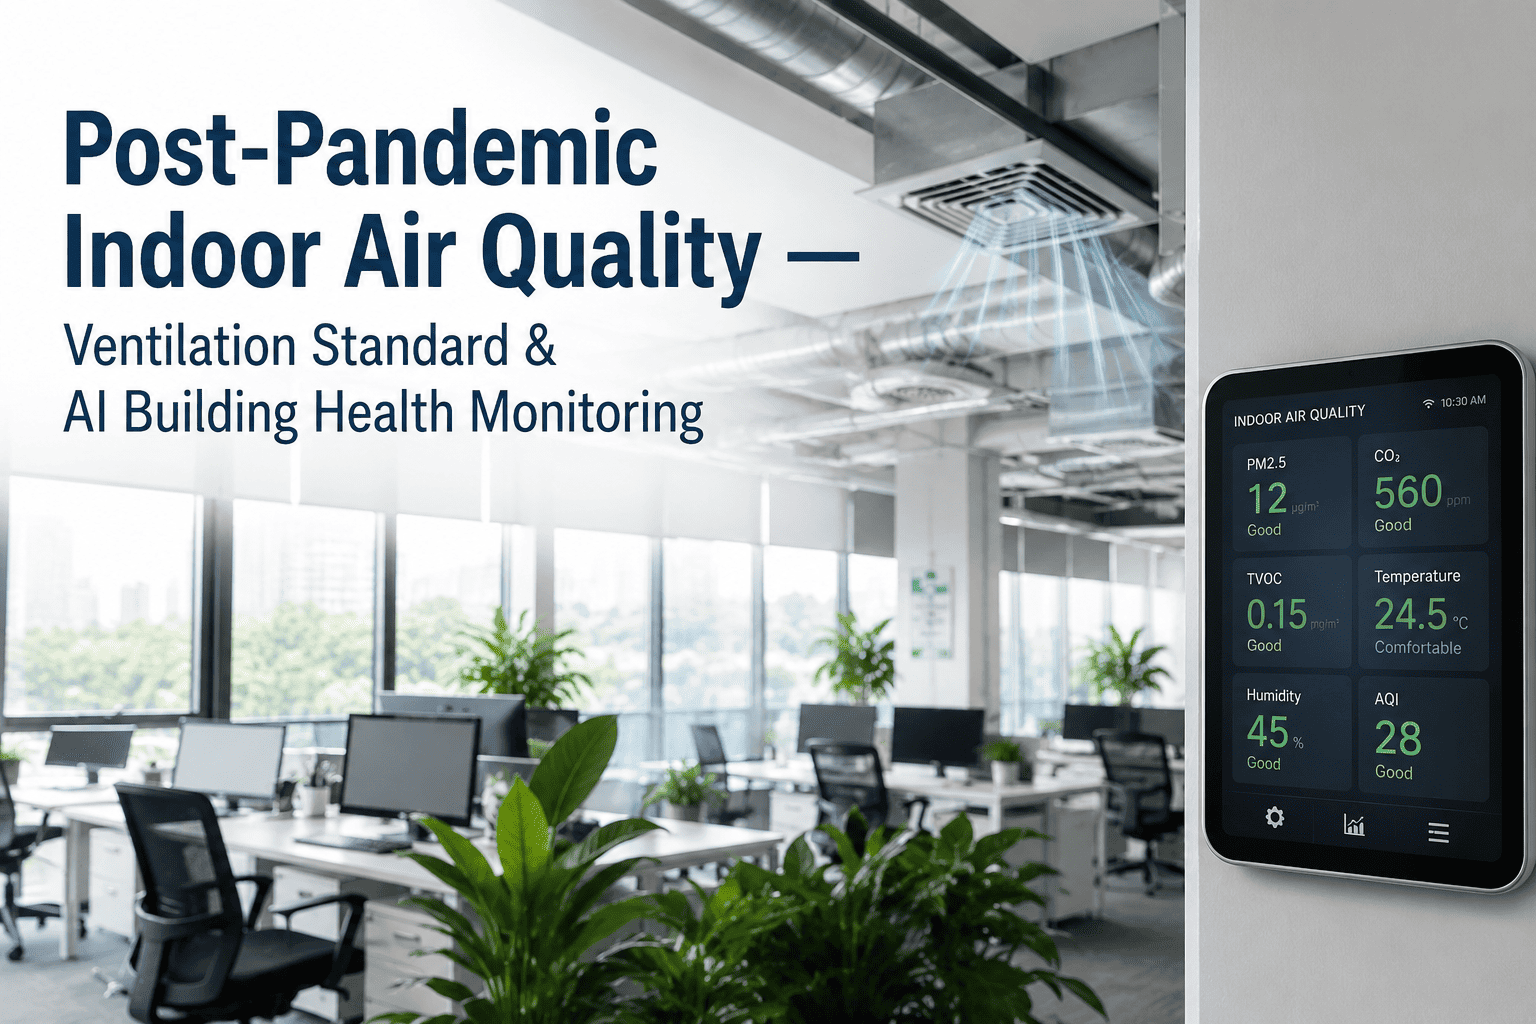
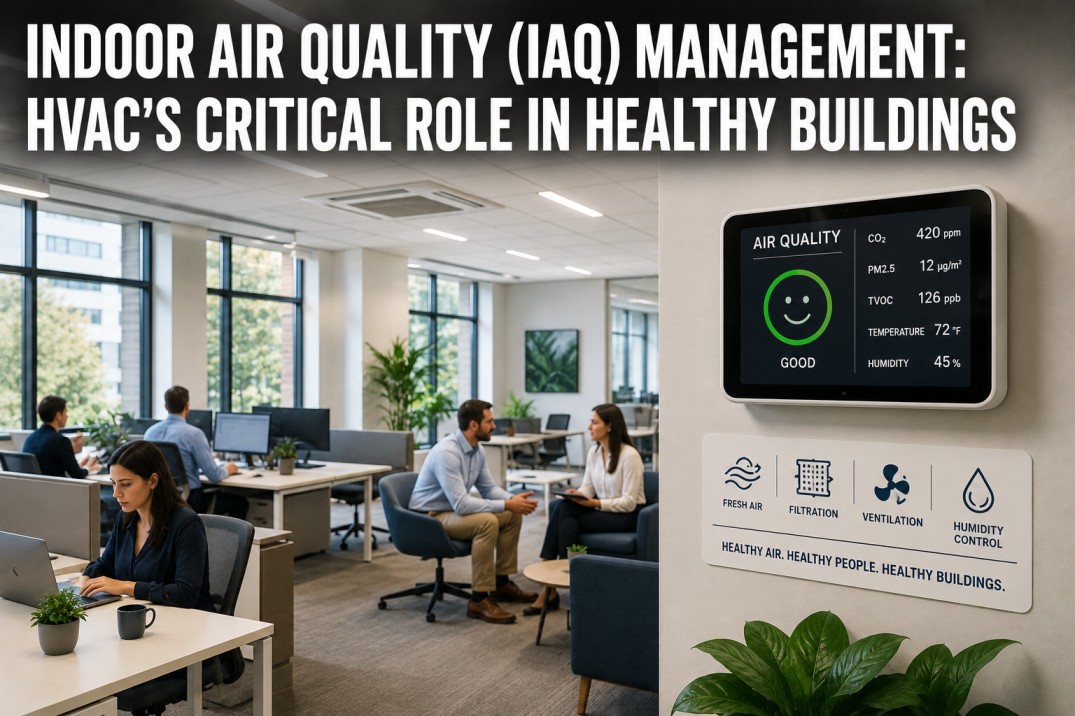
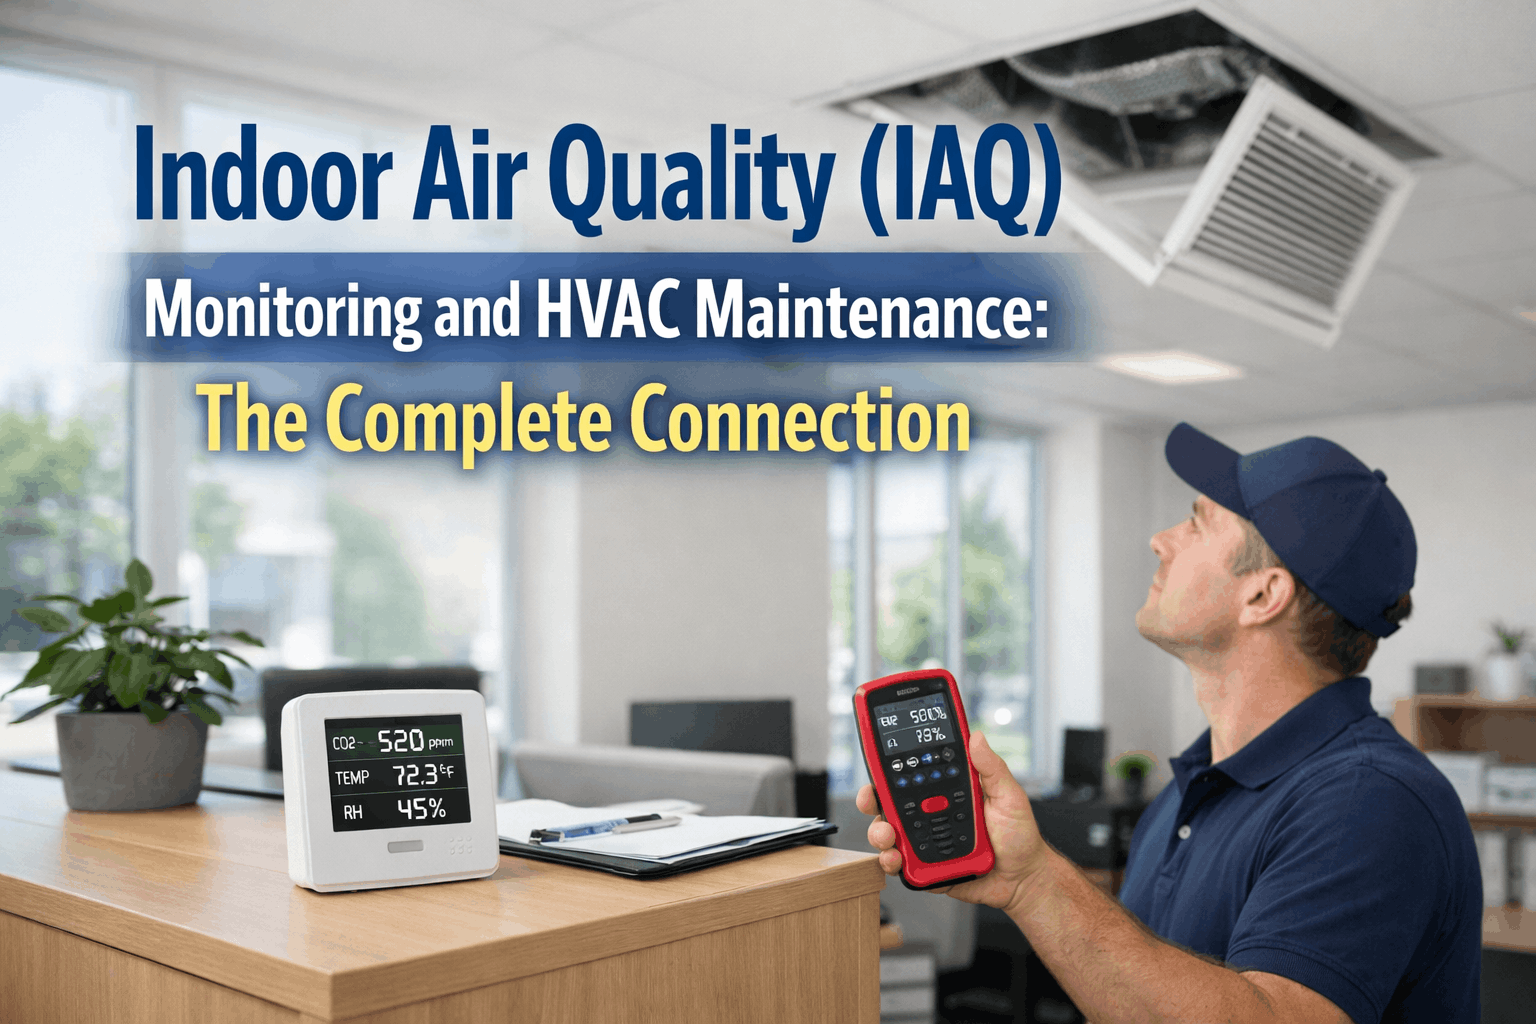
CO2 levels in a packed third-floor conference room climb past 1,200 ppm forty minutes into a two-hour meeting, and everyone in the room feels it as sluggishness and difficulty focusing long before anyone thinks to check a sensor or open a window. That same pattern repeats in classrooms, open offices, and retail floors every day, mostly invisible because indoor air quality doesn't announce itself the way a broken chiller does. It just quietly costs attention, comfort, and occasionally compliance with a ventilation standard nobody's actively tracking. AI-driven indoor air quality monitoring tracks CO2, VOCs, PM2.5, temperature, and humidity continuously across every space, flags conditions before they become a complaint, and keeps your ventilation rates aligned with ASHRAE 62.1 without over-ventilating spaces that don't need it. Book an IAQ monitoring demo with iFactory to see how continuous air quality tracking protects occupant health while keeping ventilation energy spend under control.
Indoor Air Quality & Ventilation
Indoor Air Quality Monitoring: CO2, VOC & PM2.5 Tracking Built Around ASHRAE 62.1 Compliance
Continuous monitoring across every occupied space, with AI-driven ventilation recommendations that protect occupant health and comfort while avoiding the energy cost of blanket over-ventilation.
The Four Signals That Matter
What Continuous Monitoring Tracks in Every Occupied Space
CO2
The most direct proxy for ventilation adequacy relative to occupancy. Levels climbing past roughly 1,000 ppm signal that fresh air delivery isn't keeping pace with the number of people in the space.
ASHRAE guidance: keep below ~1,000 ppm in occupied spaces
VOCs
Volatile organic compounds from cleaning products, furnishings, and building materials can accumulate in poorly ventilated spaces and contribute to headaches and reduced concentration.
Tracked as a trend against space-specific baseline
PM2.5
Fine particulate matter, whether infiltrating from outdoor air or generated indoors, is small enough to reach deep into the respiratory system and is a key marker of overall air cleanliness.
Monitored continuously against outdoor comparison baseline
Temp & Humidity
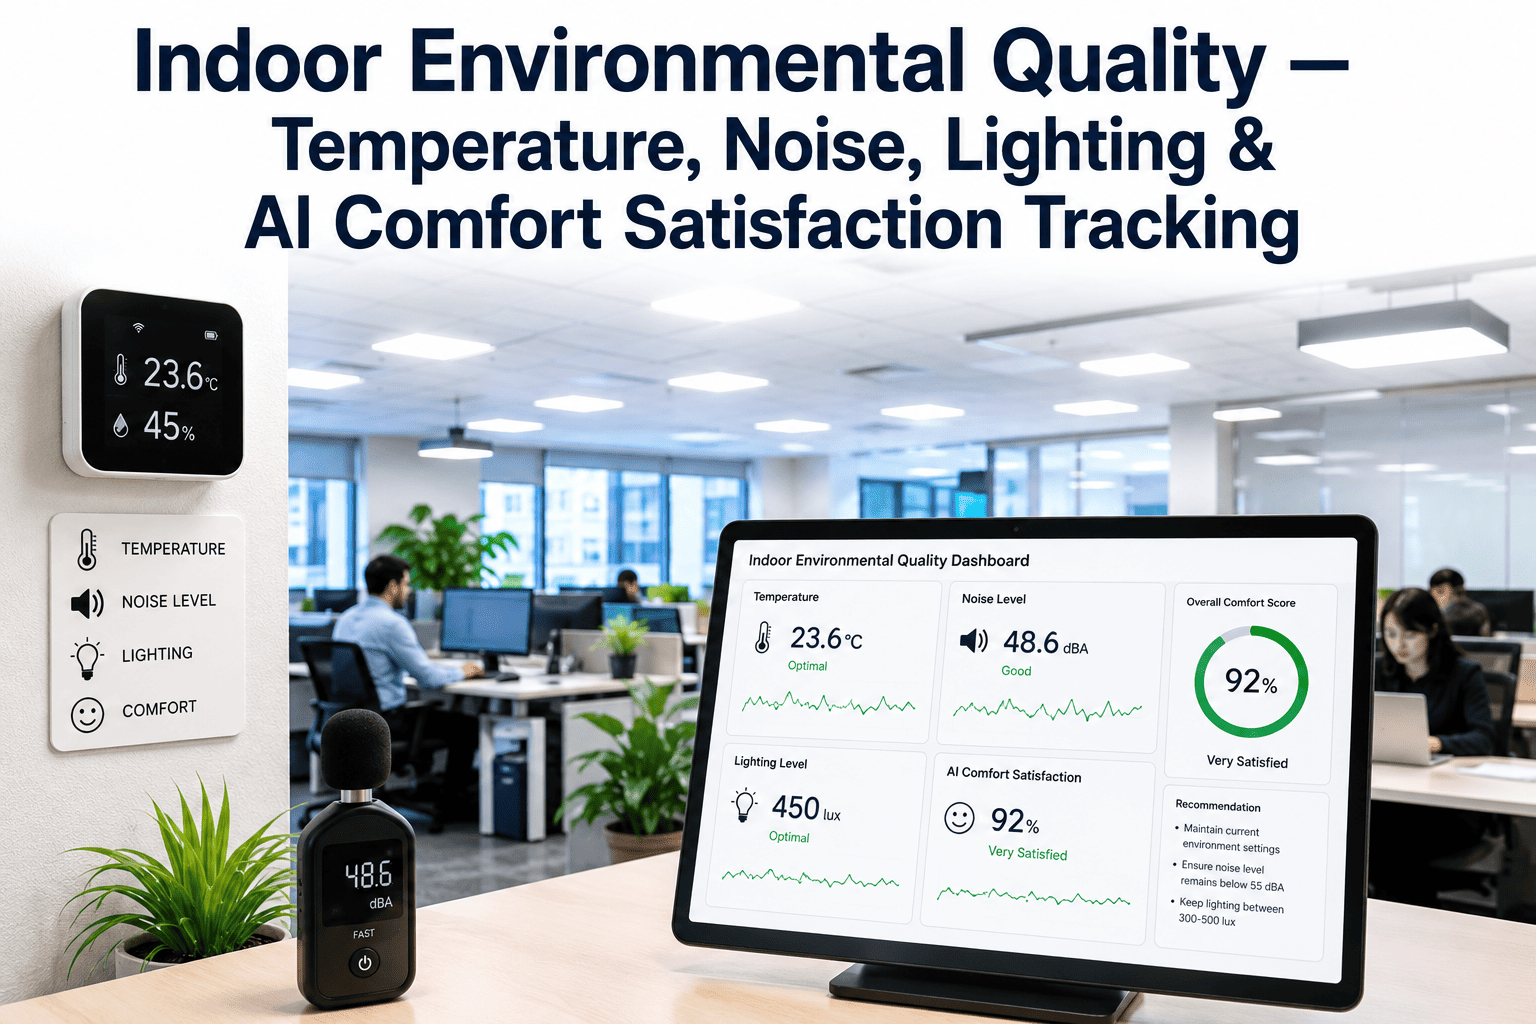
Beyond comfort, humidity outside the recommended band affects both perceived air quality and the survival rate of airborne pathogens, making it a meaningful IAQ variable in its own right.
Target range: roughly 30-60% relative humidity
The Real Challenge
Balancing Occupant Health Against Ventilation Energy Cost
The simplest way to guarantee good indoor air quality is to run maximum outdoor air ventilation continuously, and the simplest way to minimize energy spend is to run minimum ventilation continuously. Neither approach is right, because occupancy and pollutant generation vary by space and by hour, and a fixed ventilation rate is either wasting energy conditioning air nobody needs or under-ventilating a packed room during peak occupancy.
Demand-controlled ventilation, informed by real-time CO2 and occupancy data rather than a fixed schedule, is the practical middle path, and it only works well when the underlying air quality data is trustworthy and continuous rather than a snapshot from an annual test-and-balance report.
Fixed Ventilation
Same rate regardless of occupancy
Wastes energy in low-occupancy hours
Can under-ventilate during peak periods
Demand-Controlled
Adjusts to real-time CO2 and occupancy
Reduces energy during quiet periods
Ramps up automatically before levels climb
See Live Air Quality Data From Your Own Spaces
iFactory Deploys Sensors Fast and Connects to Your Existing BAS for Ventilation Control
Wireless sensors go up without disrupting occupied spaces, and readings integrate with your existing air handling controls to enable demand-based ventilation within weeks.
Compliance Reference
ASHRAE 62.1 Ventilation Rates by Common Space Type
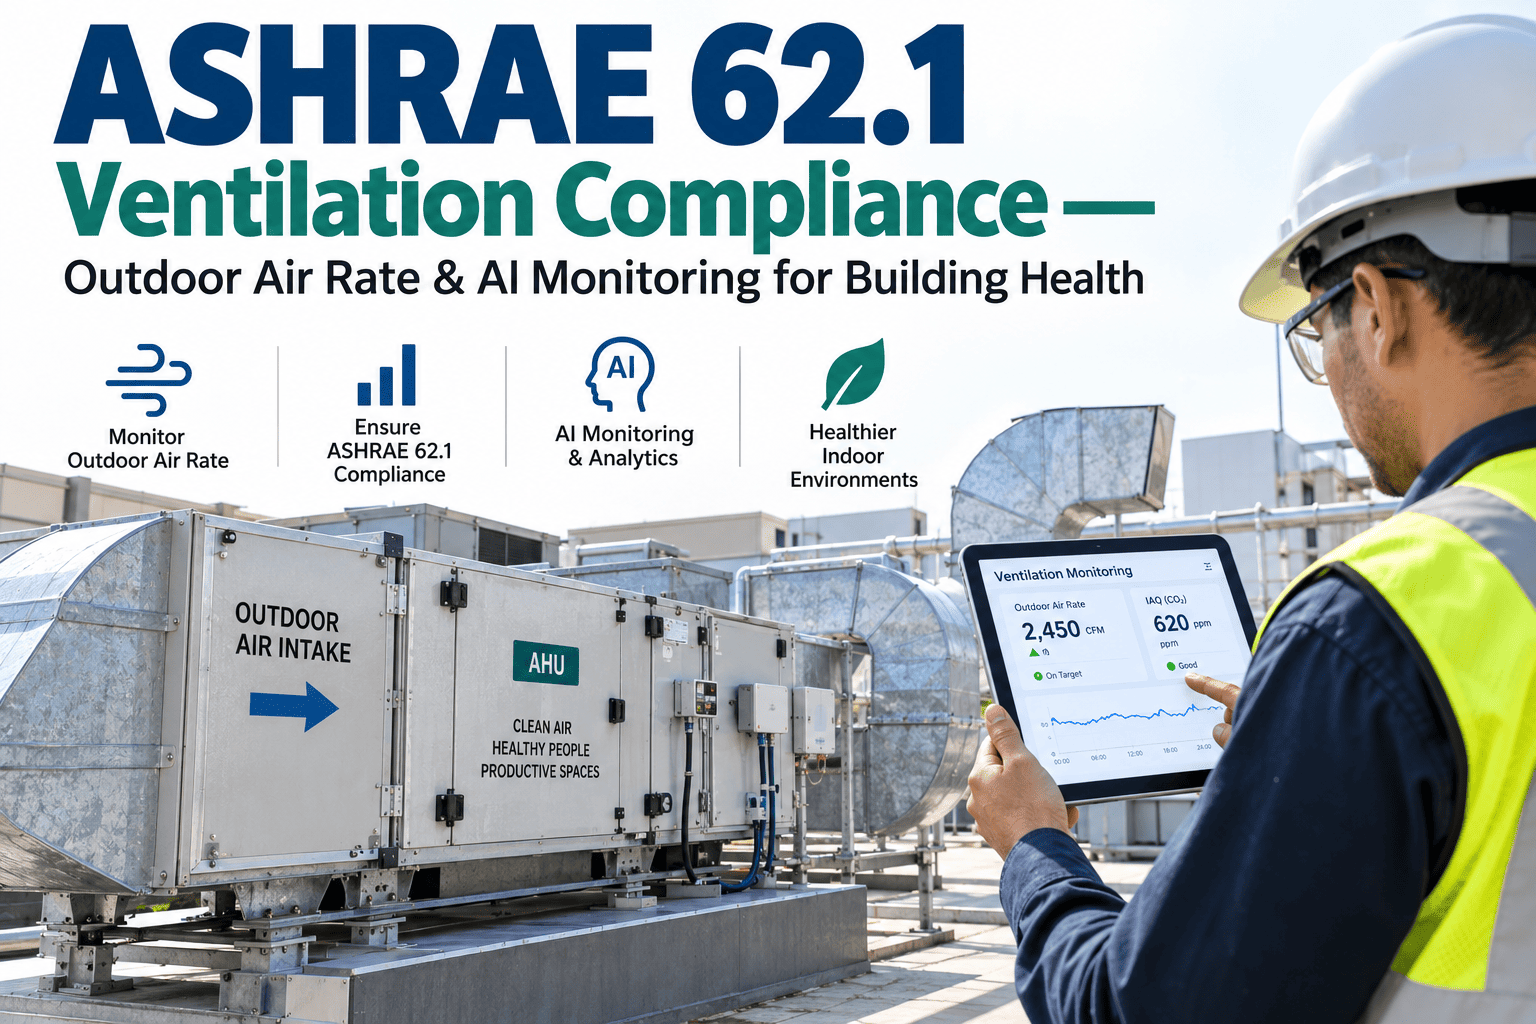
ASHRAE 62.1 sets minimum outdoor air ventilation rates based on space type and occupant density, and the required rate for a densely occupied conference room is meaningfully different from a lightly occupied private office. Tracking actual occupancy alongside air quality data is what makes it possible to verify compliance rather than just assume it from a design-day calculation.
| Space Type | Occupant Density | Typical Concern |
|---|
| Open Office | Moderate, variable by day | CO2 buildup during peak hours |
| Conference Room | High, short duration | Rapid CO2 rise, needs quick response |
| Classroom | Very high, sustained | Consistent ventilation critical |
| Retail Floor | Variable, foot-traffic driven | PM2.5 from outdoor infiltration |
Getting Started
From Sensor Deployment to Demand-Controlled Ventilation
Week 1
Space Assessment
Identify priority spaces by occupancy density and existing complaint history to sequence sensor deployment.
Weeks 2-3
Sensor Deployment
Wireless sensors are installed across occupied spaces without disrupting daily operations or requiring rewiring.
Weeks 4-5
Baseline Collection
Several weeks of data establish normal patterns per space before ventilation control adjustments are made.
Week 6+
Demand-Controlled Rollout
Ventilation rates adjust automatically to real-time occupancy and air quality signals, with compliance logged continuously.
The facility managers who get the most value from IAQ monitoring are the ones who stop treating it as a compliance checkbox and start treating it as an operations tool. A CO2 sensor in a conference room isn't just proving you meet a ventilation standard, it's telling you in real time that the room is about to feel stuffy and sluggish twenty minutes before anyone in the meeting notices consciously. That's the difference between reacting to a complaint and preventing one from ever happening.
Solomon Achterberg
Indoor Environmental Quality Consultant · 12 years in commercial ventilation design and IAQ compliance
Facility Manager Questions
Indoor Air Quality Monitoring — Frequently Asked
Do we need wired sensors, or can this be deployed without rewiring occupied spaces?
Wireless sensor deployment is standard for most spaces, using battery power and existing wireless network infrastructure, which means installation happens without cutting into walls or disrupting occupied areas during business hours. This matters especially in leased spaces or occupied buildings where downtime for rewiring isn't practical, and it significantly shortens the time between deciding to monitor a space and having live data from it.
Contact support to discuss deployment options for your specific building type.
How does demand-controlled ventilation actually reduce energy without risking compliance?
Demand-controlled ventilation doesn't reduce the minimum rate required by ASHRAE 62.1, it eliminates the waste of running above that minimum during hours when occupancy is lower than the design assumption used to size the system. A conference room designed for twenty people that typically holds six for most meetings can safely ventilate at a lower rate most of the time, ramping up automatically the moment CO2 or occupancy signals indicate it's needed, which keeps compliance intact while cutting unnecessary conditioning of outdoor air.
What's a realistic CO2 threshold that should trigger a ventilation response?
While guidance varies, keeping occupied spaces below roughly 1,000 ppm is a commonly referenced target associated with maintaining good cognitive performance and comfort, with levels climbing toward 1,500 ppm or higher associated with more noticeable drowsiness and reduced concentration in occupants. The right response threshold for a specific space depends on its ventilation design and typical occupancy pattern, which is why continuous monitoring per space is more useful than applying one blanket number across an entire building.
Can this data help us respond to occupant complaints about stuffy air more effectively?
Yes, having a continuous data trail for the specific space and time an occupant complaint references turns a vague "the air feels off" report into an actionable diagnosis, whether that's a CO2 spike during a packed meeting, a VOC event from recent cleaning, or a PM2.5 elevation tied to outdoor conditions. Without that data, most complaints get resolved by assumption rather than evidence, and the underlying cause often repeats.
Book a demo to see how the complaint correlation view works in practice.
How many sensors does a typical floor or building need for reliable coverage?
Sensor placement is generally driven by space type and occupancy pattern rather than a fixed ratio to square footage, with denser priority given to conference rooms, classrooms, and other high-occupancy variable spaces compared to lightly used private offices or storage areas. A typical commercial floor might need meaningfully fewer sensors than the total room count once spaces are prioritized by where air quality risk and complaint history actually concentrate.
Stop Guessing Whether Your Air Quality Meets Standard
Get Continuous IAQ Visibility Across Every Occupied Space
iFactory tracks CO2, VOCs, PM2.5, and humidity continuously, keeps your ventilation aligned with ASHRAE 62.1, and cuts the energy waste of running maximum outdoor air around the clock.