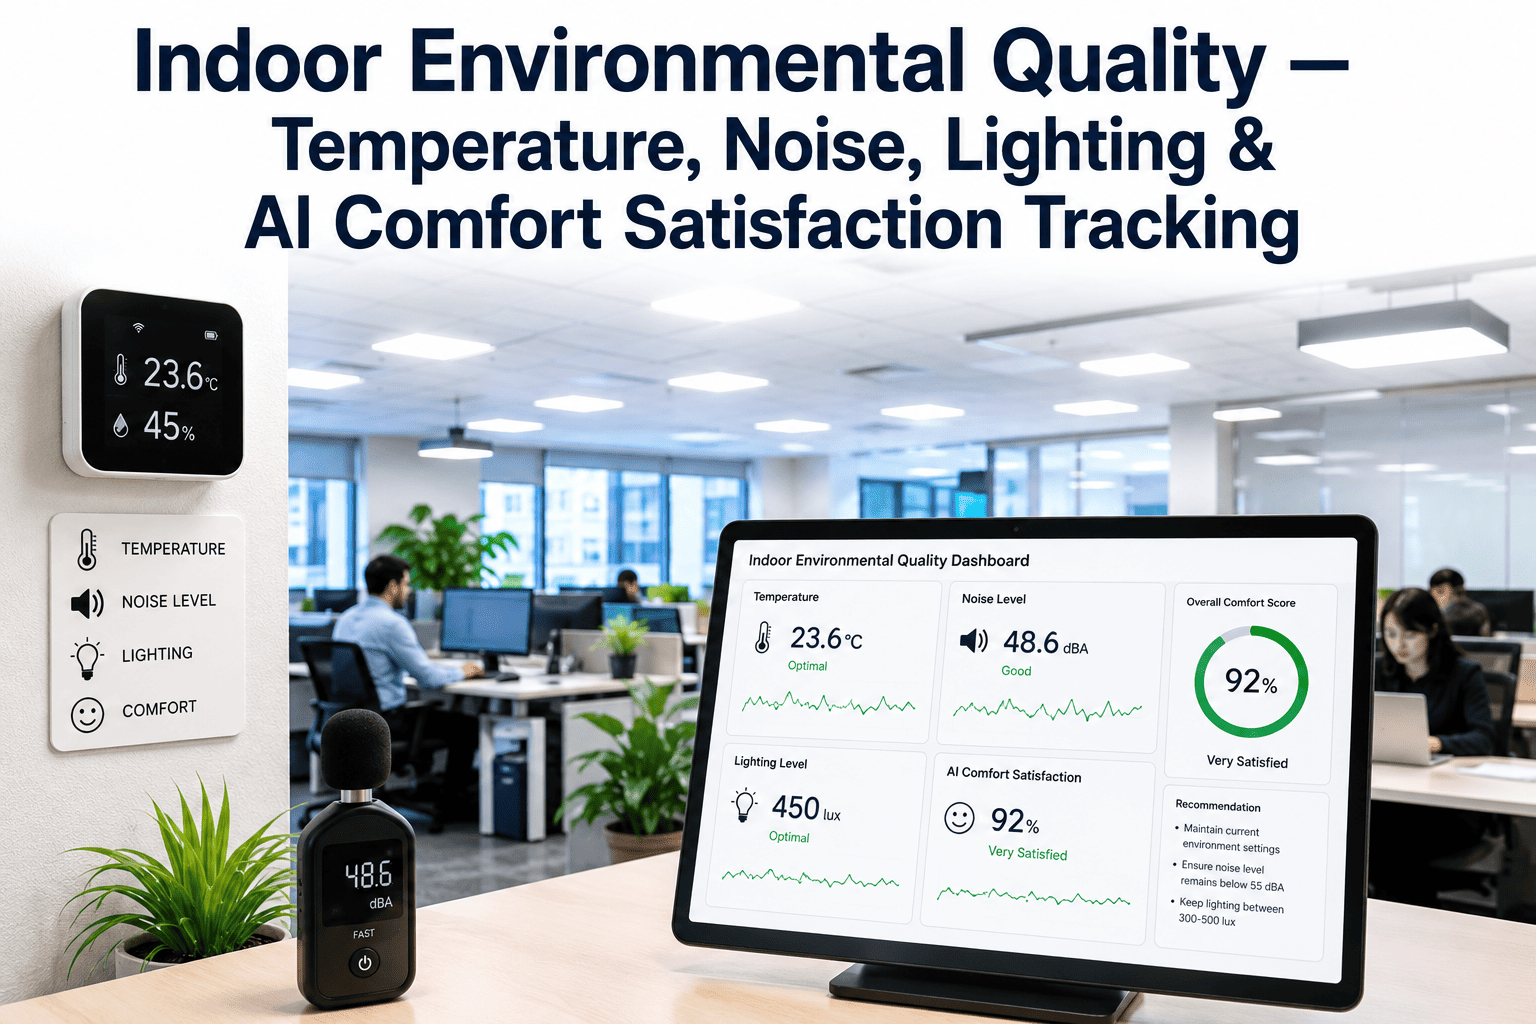
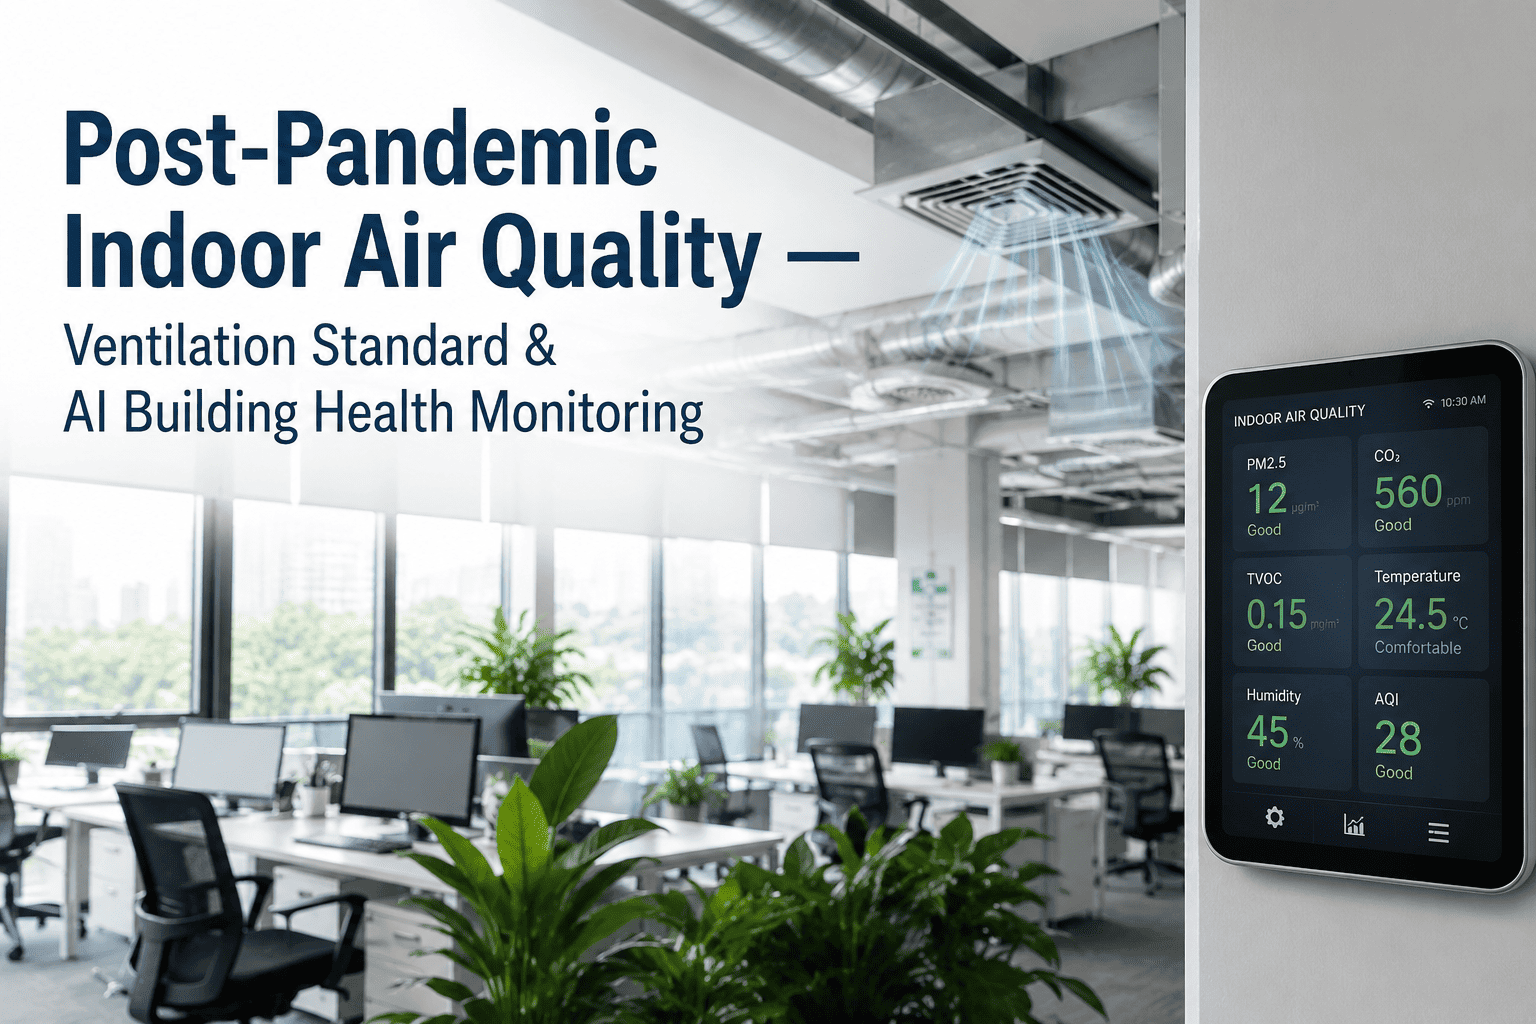
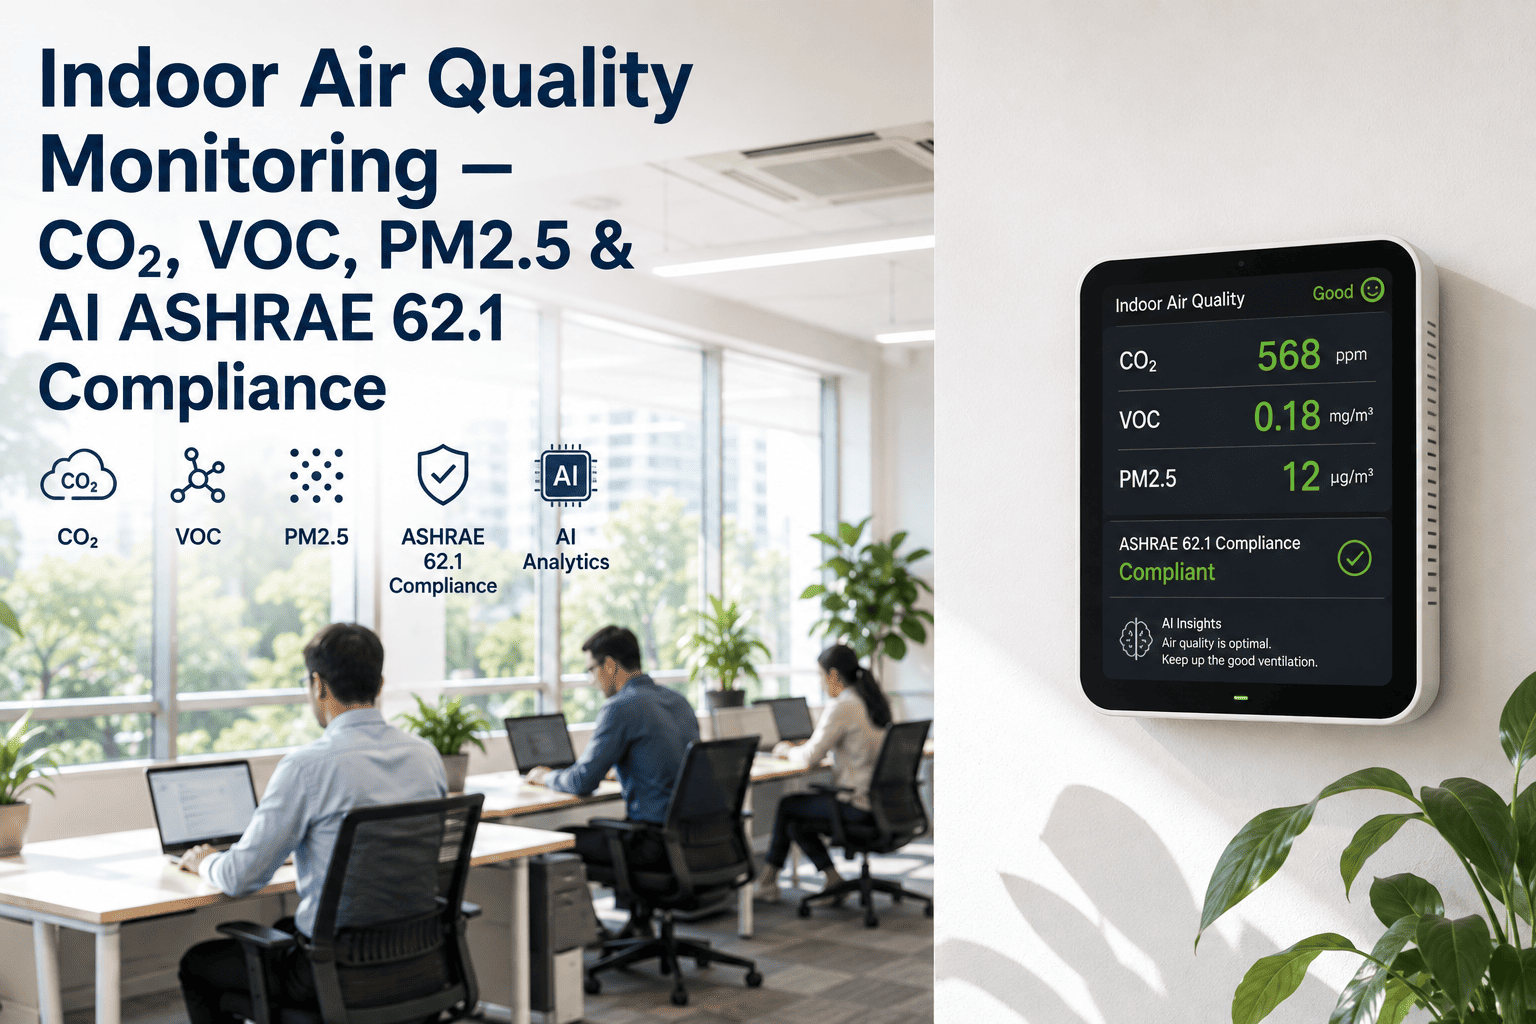
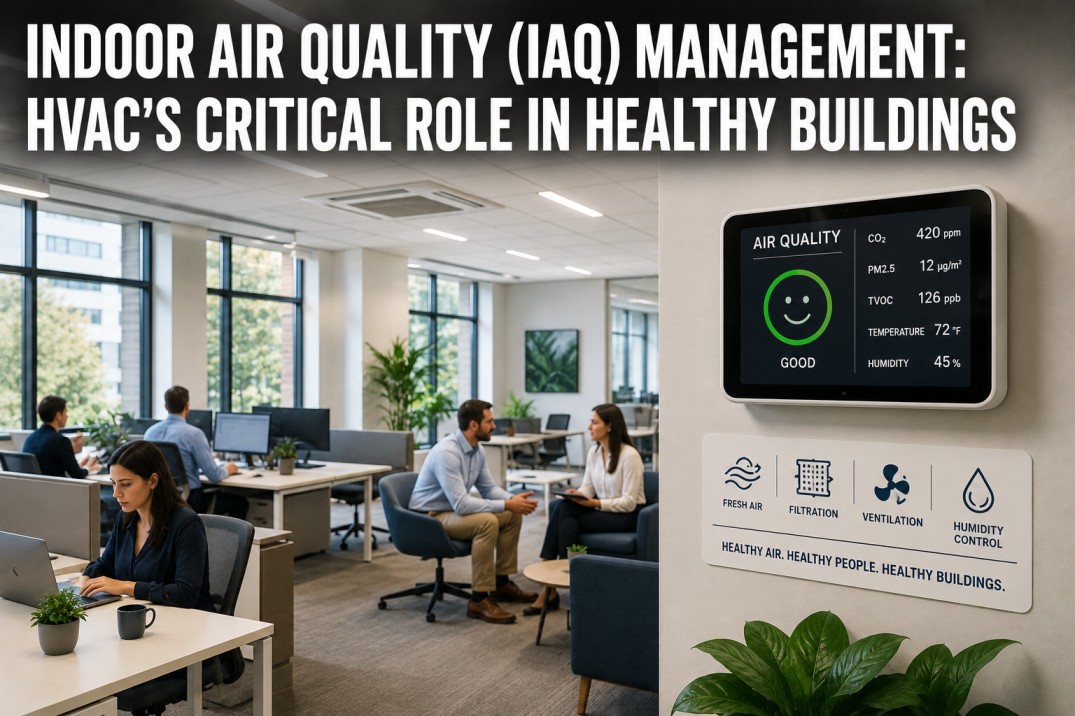
Occupant comfort complaints rarely arrive with a clear diagnosis attached. Someone says a conference room feels stuffy, another says the open office is too loud, and a facility manager is left guessing whether the cause is temperature, humidity, noise, lighting, or some combination that only shows up at certain times of day. Indoor environmental quality monitoring turns that guesswork into measured data, tracking the specific conditions driving comfort and correlating them directly against HVAC system behavior. To see what an IEQ monitoring dashboard would surface in your own building, book a demo.
IEQ MONITORING · COMFORT AS DATA
Indoor Environmental Quality: Turning Comfort Complaints Into Measured Data
Temperature uniformity, noise levels, lighting quality, and occupant satisfaction, tracked continuously and correlated against HVAC performance — so comfort stops being a guessing game.
THE FOUR METRICS THAT DEFINE IEQ
What an IEQ Dashboard Actually Tracks
Indoor environmental quality is not one number, it is a composite of several measurable conditions that each affect comfort differently and each require a different sensor approach to track accurately over time.
TEMPERATURE UNIFORMITY
±1.5°F
Typical acceptable variance across a zone before occupants report inconsistent comfort between seats or rooms.
HUMIDITY RANGE
30–60%
Relative humidity band generally associated with comfort and reduced risk of mold or static-related complaints.
AMBIENT NOISE
≤45 dB
Common target for open office background noise, above which concentration and comfort complaints rise sharply.
LIGHTING CONSISTENCY
300–500 lux
Typical target range for general office lighting, tracked alongside HVAC since lighting load affects zone temperature.
WHY HVAC IS OFTEN THE HIDDEN CAUSE
How HVAC Performance Drives Three of the Four IEQ Metrics
Facility teams sometimes treat temperature, humidity, and noise as three separate problem categories, but HVAC system behavior is frequently the common thread linking all three. A single malfunctioning VAV box can simultaneously cause temperature swings, humidity drift, and mechanical noise in the same zone, which is why correlating IEQ data against HVAC telemetry, rather than treating comfort complaints as isolated events, tends to reveal the actual root cause faster.
VAV Box Malfunction
→
Temperature swings, airflow noise, and humidity drift in the affected zone simultaneously
Undersized Dehumidification
→
Elevated humidity readings that correlate with occupancy spikes and outdoor dew point conditions
Fan or Damper Wear
→
Rising ambient noise readings that track mechanical vibration signatures over time
Sensor Calibration Drift
→
Zones reading as in-range on the BMS while occupants report genuine discomfort
Correlate Your Own Comfort Complaints Against HVAC Data
See how an IEQ dashboard would surface the root cause behind your building's most frequent comfort tickets.
FROM COMPLAINT TICKETS TO A MEASURED SIGNAL
Replacing Anecdote With a Continuous Baseline
Comfort complaint tickets are a lagging indicator, arriving only after an occupant has already been uncomfortable long enough to report it, and they are heavily biased toward whoever happens to complain rather than the full population affected. Continuous IEQ sensing closes that gap by establishing a zone-by-zone baseline that flags a deviation before it generates a ticket at all, and lets a facility manager distinguish a genuine equipment fault from a one-off occupant preference that no system change will resolve.
SATISFACTION TRACKING
Pairing Sensor Data With Occupant Feedback
Sensor data alone tells only half the story, since comfort is ultimately subjective and varies by individual tolerance. Pairing continuous environmental sensing with lightweight, ongoing occupant satisfaction surveys lets a facility team validate whether a zone reading as within-range on paper actually feels comfortable to the people working in it, closing the gap between measured conditions and perceived comfort.
Objective Layer
Continuous temperature, humidity, noise, and lighting sensors provide the measured, always-on baseline for each zone.
Subjective Layer
Periodic occupant satisfaction check-ins capture the perceived comfort experience that raw sensor thresholds alone can miss.
Correlated Insight
Combining both layers reveals zones where the sensor data looks fine but satisfaction is consistently low, pointing to a factor worth investigating further.
TABLE: TYPICAL IEQ TARGET RANGES
A Quick Reference for Common Building Types
Target ranges vary somewhat by building use, and a facility manager benchmarking their own zones should treat the table below as a starting reference rather than a universal standard.
| Space Type | Temperature Range | Humidity Range | Noise Target |
|---|
| Open Office | 70–74°F | 30–60% | ≤45 dB |
| Conference Room | 70–72°F | 30–55% | ≤40 dB |
| Warehouse Floor | 65–78°F | 30–60% | ≤65 dB |
| Data Center Adjacent Office | 68–74°F | 35–55% | ≤50 dB |
FREQUENTLY ASKED QUESTIONS
What Facility Managers Ask About IEQ Monitoring
How many sensors does a typical floor need for reliable IEQ monitoring?
Sensor density depends on zone size and layout complexity, but most open floor plans are covered adequately with sensors placed per HVAC zone rather than per room, supplemented by additional coverage in enclosed conference rooms or spaces with a history of complaints. Over-sensoring an already well-zoned floor tends to add cost without adding meaningful resolution.
Book a demo to get a sensor placement plan for your floor layout.
Can IEQ monitoring actually reduce comfort complaint volume, or does it just document them better?
Both, but the reduction in complaint volume tends to be the larger practical benefit, since catching a zone drifting out of range before occupants notice prevents the complaint from being generated in the first place rather than simply documenting it faster after the fact.
Contact support for examples of complaint volume trends after deployment.
Does IEQ monitoring require a separate platform from our existing BMS?
IEQ sensors and dashboards are typically layered onto existing BMS infrastructure rather than requiring a full replacement, pulling additional resolution the BMS lacks while cross-referencing HVAC setpoint and run-time data the BMS already collects.
Book a demo to check compatibility with your current building systems.
Is noise monitoring really necessary for HVAC-focused facility teams, or is that a separate discipline?
As the correlation examples above show, mechanical noise is frequently an early warning sign of HVAC equipment wear, such as failing bearings or loose ductwork, so tracking it alongside temperature and humidity gives a facility team an additional diagnostic signal rather than an unrelated metric to manage separately.
Reach out to support to discuss integrating noise sensing into your existing monitoring plan.
MEASURE COMFORT INSTEAD OF GUESSING AT IT
Get a Continuous, Correlated View of Your Building's Environmental Quality
iFactory pairs environmental sensing with HVAC telemetry so facility teams can trace a comfort complaint back to its actual mechanical cause.