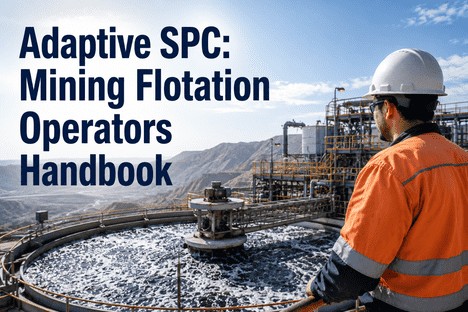
AI-Powered Adaptive SPC for Mining Flotation

By Grace on June 10, 2026

adaptive-spc-limits-mining-flotation-plant-executives-audit-readiness

The three weeks before an ISO 9001 surveillance audit should not be the most stressful period in a flotation plant quality manager's calendar. Yet across the industry, the pattern is consistent: static control limits calibrated to annual average conditions generate control charts that are either so wide they fail clause 8.5.1 (control of production) or so narrow they trigger 25-40 false alarms per shift that must be documented and explained in the audit record. Plant executives in 2026 are discovering that adaptive SPC limits — dynamic UCL and LCL boundaries that adjust to current ore zone, reagent state, and process regime — do not just improve process control. They transform the audit readiness posture of the entire flotation operation, compressing pre-audit preparation from three weeks to three days because the quality documentation is continuous, accurate, and compliant with every clause that matters.

Adaptive SPC Limits · Mining Flotation · Audit Readiness · Plant Executives
AI-Powered Adaptive SPC for Mining Flotation: Dynamic UCL/LCL That Keeps You Audit-Ready Every Shift
Self-adjusting control limits calibrated to current ore zone and process state. Real-time control charts, AI vision integration, and continuous Cpk monitoring for IATF 16949 and ISO 9001 compliance.
8-10x
Signal-to-noise improvement when adaptive UCL/LCL replaces static limits across rougher-scavenger-cleaner circuits
3 wks
Pre-audit preparation time compressed to 3-5 days when adaptive SPC generates ISO 9001-compliant records continuously
25-40
False alarms per shift eliminated when control limits adjust to current ore zone and reagent state rather than annual averages
100%
Audit-ready documentation for clauses 8.5, 8.7, and 10.2 produced as standard output — no post-event reconstruction

What Are Adaptive SPC Limits — and Why They Define Your Audit Readiness

Adaptive SPC limits are dynamic upper and lower control boundaries that calibrate themselves to the current process state rather than remaining fixed at values calculated from annual average data. In a flotation circuit, the difference is structural: static UCL and LCL are computed once from a historical baseline that averages across all ore zones, reagent states, and seasonal water chemistry conditions — producing limits that are simultaneously too wide for stable zones (missing genuine process shifts) and too narrow for transition zones (generating false alarms). Adaptive limits recompute continuously, contracting when the process is stable and expanding appropriately when ore zone chemistry shifts, holding the false alarm rate below five per shift while maintaining detection sensitivity for genuine grade excursions.

The audit readiness connection is direct. ISO 9001 clause 8.5.1 requires the organisation to implement control and monitoring of production processes. Clause 8.7 requires documented evidence of nonconforming output identification and control. Clause 10.2 requires corrective action records with root cause investigation. Under static SPC, these clauses create a compliance tension: tight limits satisfy clause 8.5.1 but generate 25-40 false alarms per shift, each of which must be documented under clauses 8.7 and 10.2 — overwhelming the quality team with records that have no process significance. Wide limits reduce documentation volume but fail clause 8.5.1 because genuine process shifts pass through undetected. Adaptive limits resolve this tension by matching the control band to the actual process capability at every ore zone and reagent state, producing control charts that are both sensitive and stable — and documentation that is complete, accurate, and audit-ready without manual triage.

For a 20,000 tpd copper concentrator with six ore zones in the mine plan, the difference in pre-audit preparation time between static and adaptive SPC is measurable in weeks. The quality team under static SPC spends 15 to 20 working days before each surveillance audit reviewing control chart exceptions, separating genuine process events from false alarms caused by ore zone shifts, reconstructing corrective action records from DCS logs and operator shift reports, and preparing the clause-by-clause evidence package that the auditor will review. Under adaptive SPC, the same documentation is produced continuously, automatically, and in the format the auditor expects — compressing pre-audit preparation to three to five days of validation review rather than reconstruction.

The Core Distinction for Plant Executives

Static SPC limits force you to choose between audit-compliant documentation and useful process control — because limits wide enough to avoid false alarms miss genuine shifts, and limits tight enough to catch shifts generate documentation volume that no quality team can manage without triage. Adaptive SPC limits eliminate the choice by calibrating control bands to the current process state, delivering both sensitivity and stability, and producing ISO 9001-compliant documentation as a standard operating output rather than a pre-audit reconstruction exercise.

How Static SPC Limits Create the Audit Readiness Gap — in Three Dimensions

The audit readiness gap created by static SPC limits in flotation operates across three independent dimensions, each of which generates documentation work that consumes quality team capacity and produces no process improvement value. Understanding these three dimensions is essential for plant executives evaluating the business case for adaptive SPC — because the audit preparation savings alone typically justify the transition within the first audit cycle.


False Alarm Documentation Volume
25-40
False alarms per shift under static SPC

Each false alarm under clause 8.7 requires the operator to document the deviation, the investigation, and the conclusion that no corrective action was needed. At 25-40 events per shift across 90 shifts per quarter, static SPC generates 2,250 to 3,600 documented events per quarter — over 95% of which are artefacts of control limits that do not match the current process state. The quality team must review every record to confirm it is non-significant before the auditor reviews the log. This triage consumes 8 to 12 engineering hours per week — hours that produce no process improvement and no quality outcome.

Adaptive SPC reduces false alarm documentation volume by 85-92% — from 2,500+ events per quarter to under 200

Ore Zone Transition Documentation Gap
2-3
Shifts of undocumented process variance per zone transition

When the flotation circuit transitions from one ore zone to another, static control limits calibrated to the previous zone immediately begin generating alerts — not because the process is out of control, but because the process baseline has shifted. Operators, knowing these alerts are artefacts, ignore them. The shift log records the transition, but no formal SPC documentation captures the zone-specific control limits that should have applied. When the auditor reviews the control chart for the transition period, it shows three shifts of out-of-control signals that the operator did not respond to — a compliance gap that requires extensive explanation and supporting documentation to close.

Adaptive SPC pre-loads zone-specific limits at each transition — zero documentation gap, zero compliance exposure

Corrective Action Record Reconstruction
2-6
Engineering hours per event for post-event root cause reconstruction

Clause 10.2 requires documented corrective action records that include root cause investigation, action taken, and verification of effectiveness. Under static SPC, when a genuine grade excursion occurs, the root cause investigation does not begin until after the event — because the operator spends the deviation period responding to the immediate process condition, and the quality engineer reviews the historian data the following shift. The corrective action record is reconstructed from DCS logs, operator recall, and LIMS assay results, producing a record that is inherently incomplete and requires 2 to 6 engineering hours per event to assemble. Under adaptive SPC with integrated root cause ranking, the corrective action record — including ML-ranked root cause, variable readings at detection time, recommended intervention, and outcome — is generated automatically at the moment the event closes.

Adaptive SPC cuts corrective action record time from 2-6 hours per event to under 15 minutes
Calculate Your COPQ Reduction ROI
How Much Quality Team Capacity Is Static SPC Consuming Every Quarter?
iFactory's free COPQ and audit readiness assessment maps your current SPC configuration against your ISO 9001 documentation requirements — identifying exactly where static control limits are creating the audit readiness gap and what adaptive SPC would save in quality team hours per quarter. Built from your DCS historian and LIMS records.

How Adaptive UCL and LCL Work — the Mechanism That Eliminates the Trade-Off

Adaptive UCL and LCL in iFactory's quality platform are not simple moving averages or rolling standard deviation calculations. They are built on a multi-factor calibration engine that ingests three independent signal streams — ore zone classification, reagent state assessment, and process regime detection — and computes control limits that reflect the actual variance structure of the current operating condition rather than the historical average across all conditions.

O
Ore Zone Classifier
Identifies the current ore zone from froth vision, feed grade, and density signals

Each ore zone in the mine plan has a characteristic froth and process variance signature. The adaptive limit engine pre-computes the expected variance structure — mean bubble size distribution, grade range, density variability, and airflow response curve — for every ore zone boundary in the mine plan. When the ore zone classifier detects a transition from historical froth vision, feed grade, and pulp density trend inputs, the control limits for the new zone are loaded from the pre-computed library within one to three minutes of the transition onset. The zone-specific limits remain in effect until the classifier detects the next transition. This is what eliminates the two to three shift documentation gap that characterises static SPC at every ore zone boundary.

R
Reagent State Monitor
Tracks collector, frother, and modifier dosage relative to current pulp conditions

Reagent dosage — collector, frother, and modifier rates — shifts the baseline of froth behaviour and recovery performance independently of ore zone. A circuit running at 85% of optimum collector dosage has a different variance structure than the same circuit at nominal dosage, even within the same ore zone. The adaptive limit engine incorporates real-time reagent dosage as a calibration input, widening control bands when dosage deviates from the nominal range for the current zone and narrowing them when dosage returns to the optimum window. This prevents the false alarm cascade that occurs when an operator makes a deliberate dosage adjustment for feed conditions and static SPC interprets the resulting process shift as an out-of-control event.

P
Process Regime Detector
Classifies current throughput, density, and airflow operating regime

Flotation circuits operate across multiple process regimes — high-throughput vs low-throughput periods, seasonal water chemistry states, maintenance-by-pass configurations — each with a distinct variance structure that static SPC cannot accommodate. The process regime detector classifies the current operating condition from throughput rate, pulp density, airflow distribution, and water chemistry trend inputs, applying the appropriate variance scaling factor to the base control limits. When the circuit enters a high-throughput period with elevated pulp density, the adaptive limits expand by the historical variance factor for that regime — preventing the false alarm surge that static SPC would generate — and contract when the regime returns to the nominal operating band.

C
Continuous Cpk Monitor
Tracks process capability in real time against adaptive baseline

The continuous Cpk monitor calculates process capability indices in real time against the adaptive control limits rather than against static specification-based limits. This distinction is critical for audit readiness: clause 8.5.1 requires evidence that the process is capable of meeting specifications, and a Cpk calculation against static limits that do not reflect the current operating condition is meaningless to the auditor. Cpk computed against adaptive limits that are calibrated to the current ore zone, reagent state, and process regime demonstrates that the process is capable within the actual operating envelope — not within an annual average that never exists on any given shift. The Cpk trend is recorded continuously and is available for auditor review at any time, not just after a pre-audit calculation exercise.

ISO 9001 Compliance Coverage: Which Clauses Adaptive SPC Serves as Standard Output

Adaptive SPC limits in iFactory's platform are not a process monitoring feature that happens to produce audit-relevant data. The platform is designed from the quality management system layer downward, with each clause of ISO 9001:2015 that applies to production and quality control served by a specific system output — generated continuously, stored immutably, and formatted for auditor review without custom preparation.

ISO Clause Requirement Adaptive SPC Output
8.5.1 Control of production processes under controlled conditions Continuous control charts with adaptive UCL/LCL per ore zone, per reagent state, per process regime — demonstrating that control limits match actual process conditions
8.5.2 Identification and traceability of process outputs Every froth image, process variable reading, and control limit state is timestamped and traceable to the specific ore zone and shift condition at the time of recording
8.7 Control of nonconforming outputs Automatic event record for every control limit breach and near-breach — containing froth condition state, variable readings, adaptive limit values at detection time, and disposition
10.2 Corrective action with root cause investigation ML-ranked root cause, SHAP causal weights, recommended intervention, corrective action taken, and outcome verification — generated at event closure without post-event reconstruction

How Adaptive SPC Changes the Audit Preparation Cycle

The most immediate and measurable impact of adaptive SPC limits on a flotation operation is not in the control room — it is in the quality office three weeks before the audit. The shift from static to adaptive limits transforms the pre-audit preparation cycle from a resource-intensive reconstruction exercise to a validation review, compressing the timeline and freeing quality engineering capacity for improvement activities that actually produce value.

Static SPC Pre-Audit Cycle (3-4 Weeks)

Export 90 days of control chart exceptions from DCS historian

Triage 2,000+ false alarm records — identify the 50-80 genuine events

Reconstruct root cause records for genuine events from operator logs and DCS trends

Prepare zone transition documentation explaining out-of-control periods at each ore boundary

Compile clause-by-clause evidence package for auditor review
Adaptive SPC Pre-Audit Cycle (3-5 Days)

Export complete event log from adaptive SPC system — pre-filtered to genuine events only

Validate 50-80 event records against operator logs and LIMS — no triage needed

Review ML-ranked root cause and corrective action records — already complete

Confirm zone transition records — adaptive limits applied automatically at each boundary

Clause-by-clause evidence package generated by the system — review and submit

Our ISO 9001 auditor had been issuing the same observation for three consecutive surveillance audits: our SPC control charts did not reflect the actual process because the limits were calculated from annual data and did not adjust for ore zone transitions. We tried explaining that the process was in control — the limits were just wrong for the zone we were in. The auditor was correct. After deploying adaptive SPC limits, the observation was closed in the first surveillance audit review. Our quality manager went from spending three weeks preparing for each audit to three days. The clause 8.7 and 10.2 records were complete, accurate, and formatted for auditor review without any manual intervention.

— Quality Manager, Copper Concentrator, Six-Ore-Zone Operation, 28,000 tpd

Deployment: Read-Only Integration, No Control Logic Changes, Live in 4-8 Weeks

Adaptive SPC limits deploy as a read-only analytics layer above your existing DCS and LIMS infrastructure. No control logic modifications. No SCADA schema changes. No operational risk during or after integration. The DCS continues to manage setpoints. The LIMS continues to manage laboratory records. iFactory reads from both systems to compute adaptive control limits and generate ISO 9001-compliant documentation — and it does not write to either unless the plant has explicitly enabled closed-loop setpoint recommendations as a separate capability.

Week 1-2
Historian and LIMS Integration
Read-only connections to DCS historian and LIMS. Ore zone boundaries mapped. Variance baseline computed per zone. No system modifications.
Week 2-4
Adaptive Limit Calibration
Adaptive UCL/LCL baselines established per ore zone, reagent state, and process regime. Validation against historical data. No operational exposure.
Week 4-6
Parallel Mode Operation
Adaptive SPC runs in parallel with static SPC. Quality team compares false alarm rates and documentation completeness before cutover. Zero risk.
Week 6-8
Live With Audit-Ready Documentation
Adaptive SPC active. Continuous Cpk monitoring live. ISO 9001 clauses 8.5, 8.7, and 10.2 records auto-generating. Pre-audit cycle compressed.

Conclusion: The Audit Readiness Gap Is a Control Limit Gap

Achieving and sustaining ISO 9001 audit readiness in a mining flotation circuit is not a documentation problem. The quality team is skilled, the procedures are defined, and the audit protocol is understood. The gap is a control limit problem — specifically, the structural mismatch between static UCL and LCL boundaries calibrated to annual average conditions and a flotation circuit that changes ore zones every six to twelve shifts, adjusts reagent chemistry for every feed condition, and operates across multiple process regimes within a single week.

Adaptive SPC limits close this gap by replacing static boundaries with dynamic control bands that calibrate themselves to the current ore zone, reagent state, and process regime — producing control charts that are both sensitive to genuine grade excursions and stable enough to generate fewer than five false alarms per shift. The documentation that results is complete, accurate, and compliant with ISO 9001 clauses 8.5, 8.7, and 10.2 without manual triage, reconstruction, or custom formatting. The pre-audit preparation cycle that consumes three weeks of quality team capacity under static SPC compresses to three to five days of validation review because the evidence package is generated continuously as a standard operating output.

The ore zones will continue to change. The reagent chemistry will continue to vary with feed mineralogy. The process regimes will continue to shift with throughput and seasonal conditions. The only variable a plant executive can change is the alignment between the control limits that define process control and the actual process state that exists on any given shift. Adaptive SPC limits are how that alignment is achieved — available now, deployable in four to eight weeks, and operational without a single modification to the DCS, SCADA, or LIMS infrastructure that your quality management system already depends on.

Frequently Asked Questions

Traditional SPC control limits are calculated once from a historical data set — typically 20 to 30 subgroups from a stable operating period — and remain fixed until manually recalculated. In a flotation circuit where ore zones, reagent states, and process regimes shift frequently, the fixed limits are wrong for most operating conditions. Adaptive SPC limits are computed continuously by a multi-factor calibration engine that ingests ore zone classification, reagent state, and process regime signals and applies the appropriate variance structure for each combination. The limits expand when the circuit enters a high-variance state and contract when it returns to stability, maintaining a consistent false alarm rate below 5 per shift while detecting genuine grade excursions with equivalent sensitivity to a zone-calibrated static chart.

Yes, and in practice auditors consistently prefer adaptive SPC charts over static charts for multi-zone flotation operations because the adaptive charts accurately reflect the process state at the time of recording. The ISO 9001 standard requires evidence that production processes are carried out under controlled conditions — it does not prescribe a specific method for calculating control limits. Adaptive limits, where the calibration methodology is documented and the ore zone transitions are visible on the chart, provide stronger audit evidence than static limits that are demonstrably wrong for the current process state. The adaptive limit system generates a complete audit trail for every limit change — including the ore zone identifier, reagent state, and process regime that triggered the adjustment — which provides the auditor with the evidence they need to confirm that the control method is appropriate for the actual operating condition.

iFactory deploys as a read-only analytics and documentation layer above your existing DCS and quality management system. No control logic modifications are required. No SCADA schema changes are needed. The DCS continues to execute its control strategies independently. The LIMS continues to manage laboratory records as the source of truth. iFactory reads DCS historian data and LIMS assay results through standard industrial interfaces — OPC UA, Modbus TCP, or REST API — and generates adaptive control limits and ISO 9001 documentation as derived outputs. The integration is information consumption only, with no write access to either system unless closed-loop setpoint recommendations have been explicitly configured as a separate capability.

The adaptive limit calibration engine uses a three-factor model. First, the ore zone classifier identifies the current zone from froth vision, feed grade, and density signals, loading the pre-computed variance baseline for that zone from the historical database. Second, the reagent state monitor assesses current collector, frother, and modifier dosage relative to the nominal range for the zone and applies a variance scaling factor based on the historical relationship between dosage deviation and process variance. Third, the process regime detector classifies the current operating condition — high throughput, low throughput, maintenance bypass, seasonal water chemistry state — and applies the appropriate regime-specific variance multiplier. The three factors combine multiplicatively to produce the adaptive UCL and LCL for the current one-minute window. The calibration methodology is documented in the system's quality record and is accessible to the auditor on request.

In the first quarter after adaptive SPC limits go live, the most visible change is the collapse in false alarm documentation volume — from 2,500+ events per quarter to under 200. The quality team spends the first audit cycle validating the adaptive limit calibration against known events rather than triaging false alarms. By the second quarter, the quality team has full confidence in the adaptive documentation output, and pre-audit preparation compresses from three weeks to three to five days. The clause-by-clause evidence package is generated by the system as a standard report, and the quality manager's role shifts from documentation reconstruction to validation and continuous improvement review. Book a demo to see a modelled audit readiness assessment built from your circuit's ore zone profile and current SPC configuration.

Yes, the adaptive limit calibration engine operates on DCS historian data alone — pulp density, airflow per cell, cell level, reagent dosage rates, feed grade, tailings grade, and particle size distribution — which provides sufficient variance signal to compute zone- and regime-appropriate control limits. Froth camera data improves the ore zone classification accuracy and provides an earlier signal for limit adjustments at zone transitions, but the adaptive limit engine does not require cameras to deliver measurable audit readiness improvement. For circuits without existing froth cameras, iFactory can recommend cost-effective camera integration as an accuracy upgrade for the ore zone classifier, but the adaptive SPC layer delivers its primary value — reduced false alarm volume, continuous Cpk monitoring, and audit-ready documentation — from DCS and LIMS data alone.

See What Adaptive SPC Limits Would Do to Your Audit Readiness Posture.
iFactory's free audit readiness assessment maps your current SPC configuration against your ISO 9001 documentation requirements — identifying where static control limits are creating the gap between your audit preparation workload and a continuously audit-ready state. The assessment is site-specific, built from your own DCS historian and LIMS data, and delivered without obligation.

Share This Story, Choose Your Platform!