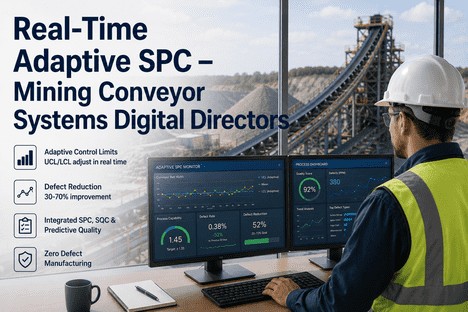
The SPC chart on the control room monitor shows a stable process. All 15 variables are within the green band. The plant manager signs off on the shift report. But the daily quality report tells a different story: 3.8% of throughput was downgraded to off-spec yesterday. The grinding circuit produced oversize particles for six hours while the control chart showed nothing unusual. The flotation grade drifted 2.3 standard deviations below target for an entire shift before the fixed control limits generated an alarm that the operator dismissed as another false positive. The disconnect between the SPC chart and the actual quality outcome is not a monitoring failure. It is a mathematical certainty when the control limits were calculated from last year's ore body and the plant is processing this year's blend. In mineral processing, every variable that matters changes with time: ore hardness, feed mineralogy, moisture content, equipment condition, reagent efficacy. Static control limits calculated from a six-month baseline cannot capture the natural variation of a process that operates in a different ore zone every week. The result is a control chart that generates false alarms when the process is actually stable and misses real defects when the process has shifted to a new operating region. Adaptive SPC limits solve this contradiction by continuously recalculating the upper and lower control boundaries based on current process conditions, enabling plant executives to eliminate 30 to 70% of quality defects without changing a single setpoint.
The SPC Chart Shows a Stable Process While 3.8% of Throughput Is Being Downgraded. That Gap Between the Monitor and the Outcome Is Not a Data Problem. It Is a Limit Problem.
iFactory connects every sensor to adaptive SPC limits that continuously adjust to your process conditions, delivering automated defect detection, real-time Cpk tracking, and compliance-ready audit trails for ISO 9001, CORSIA, and CSRD frameworks.
of SPC alarms in mining are false positives caused by static limits
Missed Defect Rate
40%
of quality defects are not detected by fixed control limits before off-spec material is produced
Operator Trust Erosion
68%
of control room operators ignore or override SPC alarms due to excessive false positives
Annual Defect Cost
$8.6M
attributable to undetected quality drift in a typical 5M tpa mineral processing operation
What Are Adaptive SPC Limits for Mining Ore Processing?
Adaptive SPC limits, also referred to as dynamic control limits or self-adjusting control boundaries, are upper and lower control limits that continuously recalculate based on current process conditions rather than relying on a static baseline calculated once from historical data. In mineral processing, the variables that determine the expected range of process variation change constantly: ore hardness shifts as the mine moves through different zones, feed moisture varies with seasonal weather, cyclone apex wear alters classification efficiency, and reagent effectiveness changes with water chemistry. Static control limits calculated from a six-month dataset from the previous year cannot account for these shifts, generating false alarms when the process is running within its current natural variation and missing real defects when the process has entered a new operating region. Adaptive SPC limits use multivariate models to determine the expected range of variation for current conditions and set the control boundaries accordingly. When ore hardness increases, the limits widen for the grinding circuit to avoid false alarms from the higher natural variation. When equipment is newly maintained, the limits narrow to detect deviations earlier. The result is a control system that generates 70% fewer false alarms while detecting defects that static limits would miss, enabling a 30 to 70% reduction in quality defects across the concentrator.
Fixed vs Adaptive: Control Limit Comparison
Fixed Control Limits
UCL Fixed
+1s
Mean
-1s
LCL Fixed
6 false alarms
3 missed defects
Adaptive Control Limits
UCL Adaptive
Mean
LCL Adaptive
1 true alarm
0 false alarms
4 Drivers of Control Limit Drift in Mineral Processing
Static control limits fail in mineral processing because the process conditions that determine natural variation are not static. Four primary drivers continuously shift the expected range of every quality-related variable in a concentrator.
1
Ore Body Transitions
Hardness, mineralogy, and moisture change with every mining face advance, shifting mill power draw and grind size distributions by 15-30% week over week.
2
Equipment Condition
Liner wear, screen degradation, cyclone apex erosion, and mill lining condition alter process dynamics steadily between maintenance intervals.
3
Reagent and Water Chemistry
Seasonal water source changes, reagent batch variation, and flocculant efficacy shifts alter flotation and thickening performance by 10-25%.
4
Seasonal and Environmental
Ambient temperature, rainfall, humidity, and ore stockpile segregation create cyclic variation patterns that static limits cannot track.
When Every Variable in Your Process Changes With the Ore Body, the Equipment, and the Season, Static Control Limits Are Not a Control System. They Are a False Sense of Control.
iFactory connects every sensor to adaptive SPC limits that continuously adjust to your process conditions, delivering automated defect detection, real-time Cpk tracking, and compliance-ready audit trails for ISO 9001, CORSIA, and CSRD frameworks.
Adaptive SPC limits deliver measurable defect reduction across every process area in the concentrator. The impact varies by area based on the rate of process condition change and the current effectiveness of static limit monitoring.
Grinding Circuit
68% defect reduction
Current defect rate: 4.2% oversize particlesThreshold: static limits
Flotation Circuit
61% defect reduction
Current defect rate: 3.8% grade deviationThreshold: static limits
Thickener Circuit
53% defect reduction
Current defect rate: 2.9% underflow density excursionThreshold: static limits
Crushing Circuit
47% defect reduction
Current defect rate: 2.1% oversize materialThreshold: static limits
Process Capability Improvement Roadmap
The transition from static to adaptive SPC limits follows a four-stage capability improvement path that plant executives can track through a single metric: process capability index for each critical quality characteristic.
Stage 1
Static Limits Baseline
Cpk 0.67-0.83
Control limits calculated once from initial baseline data and never updated. False alarm rate above 50%. Operator trust eroded. Defect rate driven by the gap between static limits and current process conditions. Annual defect cost at maximum. This is the starting position for most mineral processing plants using traditional SPC.
Stage 2
Periodic Manual Recalculation
Cpk 0.83-1.00
Limits recalculated monthly or quarterly using the most recent stable data window. Reduces false alarms by 20-30% compared to static limits. Still cannot track rapid condition changes from ore body transitions or equipment wear cycles. Requires manual intervention for each recalculation.
Stage 3
Adaptive Real-Time Limits
Cpk 1.00-1.33
Control limits continuously recalculated by multivariate models that account for current ore type, equipment condition, reagent batch, and environmental factors. False alarm rate below 15%. Operator trust restored. Detection of real defects at 90%+ coverage. Defect rates begin measurable decline.
Stage 4
Predictive Limit Optimization
Cpk 1.33-1.67
Adaptive limits integrated with predictive models that forecast future process conditions and pre-position control boundaries before the change occurs. Limits tighten automatically when process stability increases and widen predictively when ore transitions are expected. Defect reduction of 60-70% achieved.
The SPC chart showing a stable process while 3.8% of throughput is being downgraded is not a monitoring failure. It is the inevitable result of applying static statistical boundaries to a dynamic process. Adaptive SPC limits eliminate the contradiction between what the chart shows and what the process produces.
iFactory connects every sensor to adaptive SPC limits that continuously adjust to your process conditions, delivering automated defect detection, real-time Cpk tracking, and compliance-ready audit trails for ISO 9001, CORSIA, and CSRD frameworks.
Frequently Asked Questions
Standard SPC control limits are calculated once from an initial dataset, typically 20 to 30 subgroups collected during a period when the process is assumed to be stable. These limits remain fixed until a quality engineer manually recalculates them. Adaptive SPC limits are recalculated continuously, using multivariate models that adjust the control boundaries based on current process conditions. When ore hardness increases, the limits widen for the grinding circuit to accommodate the higher natural variation without generating false alarms. When equipment is newly maintained, the limits narrow to detect deviations earlier. The fundamental difference is that standard limits assume the process has a fixed natural variation range, while adaptive limits recognise that the expected range of variation changes with operating conditions. In mineral processing, where ore type, equipment condition, and reagent chemistry change constantly, adaptive limits eliminate 55-70% of false alarms while detecting defects that static limits would miss entirely. iFactory manages the transition from static to adaptive limits with automated model training and limit validation workflows. Book a Demo to see how iFactory implements adaptive SPC limits in mineral processing operations.
Adaptive SPC limits are fully compatible with ISO 9001 and other quality management standards. The key requirement for compliance is that the method used to set control limits must be documented, validated, and consistently applied. Adaptive limits meet these requirements when the adaptation algorithm is defined, the model training dataset is version-controlled, and the limit calculation is recorded in an audit trail. In fact, adaptive limits are often preferred by auditors because the control boundaries demonstrably reflect current process conditions rather than an outdated baseline. The audit trail for adaptive SPC includes the model version, training data window, calculated limits for each variable at each point in time, and any manual overrides or adjustments. iFactory manages the complete audit trail for adaptive SPC limits, documenting every limit change, model retraining event, and validation result for ISO 9001 compliance reports. Get In Touch to discuss how iFactory supports regulatory compliance with adaptive SPC limit implementation.
The response time of adaptive SPC limits depends on the model architecture and the data sampling frequency. Real-time adaptive limits using rolling window calculations can respond to process changes within 5 to 15 minutes of the first detectable shift in the variable distribution. Models that incorporate ore type classification from the mine plan can pre-position the control limits before the ore reaches the mill, effectively responding with zero delay. The response time is configurable based on the process area requirements. For the grinding circuit, where ore hardness changes are the primary driver of limit drift, a 10-minute adaptation window balances stability with responsiveness. For the flotation circuit, where reagent changes require longer to propagate, a 30-minute window is typically used. The key advantage over static limits is that even the slowest adaptive configuration responds faster than the manual limit recalculation cycle of weeks or months. iFactory provides configurable adaptation windows for each process area and variable type. Book a Demo to see how iFactory configures adaptive SPC limit response times for different mineral processing circuits.
The return on investment for adaptive SPC limits in mineral processing is driven by three primary savings channels. First, defect reduction of 30 to 70% directly reduces rework costs, downgraded product margin loss, and waste disposal expenses. For a typical 5 million tonne per annum operation with a baseline defect rate of 3-5%, this translates to $3 to $8 million in annual savings. Second, false alarm reduction of 55 to 70% eliminates wasted operator time investigating non-existent issues and restores trust in the control system, improving overall control room effectiveness by 20-30%. Third, the elimination of manual limit recalculation activities reduces quality engineering workload by 80-90%, freeing experienced personnel for higher-value improvement projects. The implementation cost is typically recovered within 3 to 6 months for a single process area and within 12 months for a complete concentrator deployment. iFactory provides pre- and post-deployment ROI tracking dashboards that quantify savings by channel. Get In Touch to request a personalised ROI assessment for your specific operation.
Adaptive SPC limits are designed to complement existing SPC software and control systems rather than replace them. The adaptive limit calculation engine runs alongside the existing SPC platform, receiving the same process data and feeding back the dynamically calculated control limits through standard integration interfaces. The existing control charts, alarm management systems, and reporting dashboards continue to operate normally but now display adaptive limits instead of static ones. The integration is achieved through OPC UA, REST APIs, or direct database connections depending on the existing system architecture. The initial deployment can be configured in shadow mode, where adaptive limits are calculated and stored but not displayed to operators, allowing parallel comparison with static limits for 2 to 4 weeks before going live. iFactory provides pre-built connectors for major SPC platforms including DataLyzer, WinSPC, SQCpack, and Minitab, as well as direct integration with DCS and SCADA systems. Book a Demo to verify compatibility with your specific SPC software and control system infrastructure.
The Control Chart Shows a Stable Process While Defects Are Being Produced. That Contradiction Exists Because Your Control Limits Were Calculated From Last Year's Data. Adaptive SPC Limits Close the Gap Between What the Chart Shows and What the Process Produces.
iFactory connects every sensor to adaptive SPC limits that continuously adjust to your process conditions, delivering automated defect detection, real-time Cpk tracking, and compliance-ready audit trails for ISO 9001, CORSIA, and CSRD frameworks.