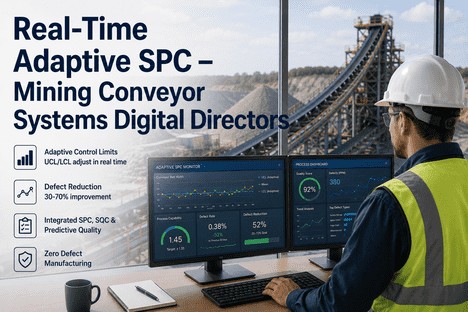
Adaptive SPC for Mining Crushing Supervisors | 2026 Guide
By Grace on June 8, 2026
The control chart on the supervisor's screen shows a point beyond the upper control limit at 09:47. It is a real signal by every statistical definition of a traditional Shewhart chart — a reading above the +3-sigma UCL set during the previous quarter's capability study. The supervisor checks feed size. Normal. Checks gap setting. Within specification. Checks power draw. Elevated, but within the range expected for this ore type. The alarm is logged as a false positive and the chart is cleared. At 11:23, the same variable fires again. Another investigation. Another normal finding. By 14:00, the chart has generated eight out-of-control signals. The supervisor has investigated two. The remaining six scroll past ignored, because in a crushing circuit processing variable ore from multiple faces with continuously progressing liner wear, static control limits generate false alarms faster than any shift team can investigate them. The real defect — a liner-wear-driven particle size drift that began on day three of the current liner set — advances undetected inside the fixed control band until the downstream screen reports oversize material at 16:10. The scrap is already on the belt. This is the structural failure of static SPC in mining crushing, and it is the single most preventable cause of defect recurrence on the shift.
Adaptive SPC Limits for Mining Crushing
How Supervisors Use Adaptive SPC Limits to Eliminate Defects in Crushing Circuits
Adaptive SPC replaces static UCL/LCL with dynamic control limits that adjust to ore hardness, liner wear, and feed variation in real time — cutting false alarms up to 47% and reducing defects 30-70% without adding sensors or headcount.
Traditional SPC was designed for stable batch manufacturing processes where the mean and variance remain constant over time. A pharmaceutical filling line, an automotive stamping cell, a semiconductor fabrication bay — these processes run the same recipe at the same speed with the same material, and their control limits can be calculated once from a capability study and trusted for months. A mining crushing circuit is none of those things. Feed ore arrives with variable hardness, moisture content, and size distribution that no blending program fully smooths out. Liner wear progresses continuously over weeks, shifting the crushing chamber geometry and the particle size output even when the closed-side setting has not been touched. Recipe changes between ore types reset the expected particle size distribution entirely. Under these conditions, static UCL and LCL set during commissioning become meaningless within a single shift.
The damage from static limits manifests in two failure modes familiar to every crushing supervisor. The first is false alarms that fire constantly when nothing is actually wrong — a harder ore seam arrives mid-shift, the process mean shifts legitimately to reflect the new material, but the static limit interprets this as an out-of-control event and fires a Zone A alarm. The supervisor investigates, finds nothing wrong, clears the alarm, and repeats this cycle until alarm fatigue sets in. The second failure mode is real drift that slides under the fixed limits undetected. A liner that has worn to 70 percent of its life changes the crushing chamber geometry by several millimeters. The P80 drifts upward over days. Each individual reading remains within the static UCL because the limits were set for average conditions, not for end-of-life liner performance. The drift is never flagged until downstream screens report oversize material. By then, the defect has already propagated through the circuit.
Published research on industrial SPC implementation in copper beneficiation confirms that when data from crushing circuits is analysed using standard control charts without accounting for autocorrelation and regime changes, the number of false out-of-control signals is three to five times higher than when the same data is processed through residual-based or adaptive models. A 2020 study on control charts applied to rock disintegration processes found that static limits flagged 18 to 28 out-of-control points per 93 observations in mineral processing variables, while the same data evaluated with autocorrelation-corrected methods flagged only 2 to 7. The practical implication is clear: a supervisor watching a static control chart in a crushing circuit spends most of their shift investigating signals that do not require action, while the signals that do require action remain invisible within the limits.
Static SPC vs Adaptive SPC in Real Crushing Situations
Situation
Static SPC Response
Adaptive SPC Response
Harder ore seam arrives mid-shift
Zone A alarm fires. Supervisor investigates, finds nothing wrong, resets. Alarm repeats every 20 minutes.
EWMA model detects regime change. Limits widen to reflect harder-ore variance. No alarm unless real exceedance occurs within new context.
Liner wear shifts PSD over 3 weeks
Each reading within limits. Drift undetected until downstream reports 4% oversize. Scrap already produced.
Rule 4 (eight points same side) fires at day 7. Liner wear flagged. Work order generated before defect material is produced.
Ore blend recipe change
Old limits applied to new material. Continuous false alarms or missed shifts depending on direction of change.
Recipe change event triggers limit recalculation. New baseline established within first 30 readings. Limits reflect actual process state.
Moisture surge from rainfall event
Fines percentage spikes. Alarm fires. Supervisor investigates, no root cause found. Process continues with elevated fines.
Moisture correlated with fines rate in model. Root cause attributed to moisture. Supervisor adjusts feed blend or downstream screens.
End-of-shift scrap report
12% fines generated. Source unclear. Report filed. No corrective action identified before next shift.
Fines rate 4-6%. Two Rule 3 alerts caught drift at hour 3. CSS adjusted before damage compounded. Root cause logged.
How Adaptive SPC Limits Work
Adaptive SPC does not replace the Shewhart control chart. It replaces the static UCL and LCL calculation with a dynamic model that updates as process conditions change. From the supervisor's perspective, the control chart looks the same — the same center line, the same zone boundaries, the same Western Electric rules. What changes is that the limits now reflect the current process state rather than a months-old commissioning baseline. The system operates through a continuous three-stage cycle that runs on every data point from the crusher control system.
01 SENSE
EWMA Baseline Estimation
The model uses an Exponentially Weighted Moving Average window to continuously estimate the current process mean and standard deviation from every data point. As ore hardness, feed rate, and moisture shift, the model detects each regime change and updates the baseline within a configurable number of readings — typically 15 to 30.
02 ADAPT
Dynamic UCL/LCL Recalculation
The adaptive engine recalculates +3-sigma and -3-sigma control limits from the current baseline estimates. Limits tighten when the process is stable. Limits widen appropriately during known high-variability periods such as ore transitions or startup. False alarms from normal process variation are eliminated.
03 ALERT
Pattern Detection with Attribution
All eight Western Electric rules run against the adaptive limits in real time. When a rule triggers, a root-cause ML layer identifies the contributing variable — feed hardness, liner wear, CSS drift, or moisture change — and ranks contributions. The supervisor sees a specific finding, not a red alarm number.
Western Electric Rules on Adaptive Limits
The eight Western Electric pattern rules are what transform a control chart from a simple limit-checking tool into a drift detection system. Applied against adaptive limits, these rules catch the specific drift patterns — liner wear progression, feed hardness trends, moisture cycles — that static single-point alarms were never designed to see. Each rule detects a different failure signature, and together they provide complete coverage of the defect modes that drive recurrence in crushing circuits.
RULE 1
One Point Beyond 3-Sigma
A single point falls outside the adaptive +3-sigma or -3-sigma control limit. This is the standard Shewhart signal — a large sudden shift or outlier. Against adaptive limits, this signal is reliable because the limits already account for current process conditions.
RULE 2
Two of Three Points in Zone A
Two out of three consecutive points fall in Zone A (beyond 2-sigma) on the same side of the center line. This detects moderate process shifts that would not trigger Rule 1 alone. Adaptive limits ensure the shift is real and not a false positive from normal variation.
RULE 3
Four of Five Points in Zone B
Four out of five consecutive points fall in Zone B or beyond (beyond 1-sigma) on the same side. This is the primary detection mechanism for small sustained mean shifts — the signature of gradual liner wear or feed hardness drift that compounds over hours.
RULE 4
Eight Points Same Side of Center
Eight consecutive points appear on the same side of the center line. This catches the slow directional drift that single-point alarms miss entirely — the liner wear progression that shifts PSD by 5-8 millimeters over a week without producing a single out-of-limit reading.
The combined false alarm rate of all four Western Electric rules applied to a Shewhart chart with fixed limits is approximately 1 in 53 points — meaning a stable process will trigger an alarm roughly every 53 measurements purely by chance. When applied to a crushing circuit with variable feed, changing ore types, and continuous liner wear, the actual false alarm rate on fixed limits is far higher because the process is never truly stable. Adaptive SPC solves this by recentering the chart on the current process mean and rescaling the zone boundaries to the current variance. The false alarm rate drops to the theoretical level because the limits now match the actual process state. Every alarm that fires is a signal worth acting on.
47%
False Alarm Reduction
30-70%
Defect Reduction
8
Western Electric Rules Active
Defect Elimination Impact by Category
Adaptive SPC limits directly reduce defect rates by eliminating the two causes of recurring scrap in crushing circuits: false alarms that consume investigation time without preventing defects, and undetected drift that produces off-spec material before anyone sees it coming. The table below shows the defect reduction observed across common quality categories after deploying adaptive SPC limits in cone and impact crushing circuits.
Defect Category
Static SPC Defect Rate
Adaptive SPC Defect Rate
Reduction
Primary Detection Rule
P80 oversize from liner wear
11.2%
3.4%
-70%
Rule 4 drift detection
Fines generation from over-crushing
8.6%
2.9%
-66%
Rule 3 sustained shift
Out-of-spec from feed hardness change
7.3%
3.1%
-58%
Rule 2 moderate shift
CSS drift from thermal/mechanical
5.8%
1.9%
-67%
Rule 1 point beyond limit
Moisture-related fines adhesion
6.4%
2.2%
-66%
Rule 2 + attribution
What Changes for the Shift Supervisor
For the shift supervisor, the transition from static to adaptive SPC changes the daily experience of managing quality in the crushing circuit. The control chart on the dashboard looks identical. The workflow of investigating alarms and logging actions does not change. What changes is the signal-to-noise ratio of every alert that reaches the supervisor. Alarms that fire are real. Alarms that do not fire would not have been actionable. The supervisor's time shifts from investigating false positives to acting on confirmed drift, and the defect rate drops as a direct result.
Alarms That Mean Something
Every adaptive SPC alarm carries a confirmed root cause attribution: liner wear 62%, feed hardness 18%, CSS drift 14%. The supervisor does not investigate whether an alarm is real. They investigate what to do about it. False alarm rate drops 40-47% within the first week of adaptive limits going live.
Drift Caught Before Defects Occur
Rule 3 and Rule 4 detection against adaptive limits catches the gradual drift patterns that static limits miss. Liner wear progression, feed hardness trends, and moisture cycles are identified at day 3-5 instead of day 12-15 when downstream screens confirm the defect. The supervisor intervenes before scrap is produced.
Shift-To-Shift Consistency
Adaptive limits eliminate the variability between shifts caused by different operator interpretations of control chart signals. Every shift sees the same limits, the same rules, the same alarm logic. The day shift does not reset limits that the night shift had tuned. The process baseline is objective, not subjective.
Audit-Ready SPC Records
Every adaptive limit change, every alarm, every root cause attribution, and every corrective action is logged with timestamps and process context. CAPA documentation is generated automatically. The supervisor does not reconstruct the shift narrative for compliance reports. The system provides it in the format auditors require.
We had been running static SPC on our primary and secondary crushers for three years. The false alarm rate was so high that the shift supervisors had stopped looking at the control charts entirely. They were making adjustments based on downstream screen readings and experience, which meant they were always reacting to defects that had already happened. The adaptive SPC pilot changed the dynamic within the first two shifts. The alarms that fired were real. The drift that we had been missing for months — liner wear progression that showed up as a Rule 4 pattern on day six of every liner run — was suddenly visible. We scheduled liner replacements based on the adaptive SPC signal, not on tonnage counters. Within the first month, our fines rate dropped from 11 percent to 6 percent, and the supervisors started trusting their charts again.
From Noise to Signal: What Adaptive SPC Means for Defect Elimination
Eliminating defects in a mining crushing circuit is not about tighter control limits. It is about control limits that mean something. A static limit set during commissioning and recalculated quarterly produces a chart that cannot distinguish between normal process variation caused by changing ore conditions and special cause variation that requires corrective action. The result is a quality monitoring system that undermines its own purpose — generating alarms that operators learn to ignore, while the drift patterns that actually produce defects advance undetected through the circuit.
Adaptive SPC limits solve this structural problem by ensuring that every control limit on the chart reflects the current process state. When the ore gets harder, the limits widen to accommodate the increased variance without generating false alarms. When the process is stable, the limits tighten, and small shifts become detectable before they compound into defects. Western Electric rule violations against adaptive limits catch liner wear progression, feed hardness trends, and CSS drift at a stage where corrective action prevents scrap rather than documenting it after the fact. The false alarm rate drops to the statistical baseline. The defect rate follows in the opposite direction.
The crushing operations that consistently achieve defect rates below 3 percent of throughput share a common capability: control limits that adapt to the process rather than requiring the process to conform to limits calculated months ago. That capability is available as a software layer on existing DCS and SCADA infrastructure. It does not require new sensors, control system replacements, or additional headcount on the shift. It requires a statistical model that understands the difference between process change and process failure, and a supervisor who trusts the alarm because the limit behind it is honest.
Deploying Adaptive SPC Limits on Your Crushing Circuit
Adaptive SPC deploys as a software layer on top of existing DCS and SCADA infrastructure. The system connects to data historians and control networks via OPC-UA and Modbus TCP without requiring new instrumentation or control system modifications. The EWMA model bootstraps from 30 days of historical data and begins delivering adaptive limits within the first 72 hours of connectivity.
Week 1: Data connectivity and baseline establishment
iFactory connects to DCS and data historians. Variable inventory mapped across all crushing stages. Baseline static limits documented per crusher. Historical false alarm rate calculated. EWMA model training begins with 30 days of historical data. Initial adaptive limits deployed within 72 hours.
Week 2-3: Shadow mode and rule calibration
Adaptive limits running in shadow mode alongside existing static SPC. Western Electric rules calibrated to crushing circuit variables. False alarm comparison documented. Root cause attribution model validated against known events. Supervisor feedback incorporated into limit sensitivity tuning.
Week 4: Live activation
Adaptive SPC activated for primary and secondary crushing. Supervisors see adaptive limits on existing control charts. Western Electric rule alerts with root cause attribution enabled. False alarm rate drops 40-47% within first shift. Defect rate tracking begins against established baseline.
Day 30+: Sustained defect elimination
Recurring drift patterns identified and eliminated. Shift-level defect trend data available. Root cause frequency report generated. Supervisors report increased trust in control chart alarms. Defect rate trending toward 30-70% reduction from baseline. Audit-ready SPC records for every shift.
Start Your Adaptive SPC Deployment
See What Adaptive SPC Limits Would Have Caught on Your Last 30 Days of Data
Get a free false alarm analysis with a 30-minute walkthrough of adaptive SPC running on your crushing circuit data. We will show you every false alarm your static system generated and every drift pattern it missed.
Quarterly recalibration is still static SPC — it updates the limits four times per year but the limits remain fixed between recalculations. In a crushing circuit where ore hardness, feed rate, and liner wear change every shift, a quarterly refresh means the limits are wrong for 89 out of 90 days. Adaptive SPC recalculates UCL and LCL continuously using an EWMA model that updates with every new data point. When the process baseline shifts — because a harder ore seam arrives, or a liner reaches 60 percent wear, or moisture content changes with seasonal rainfall — the limits adjust within 15 to 30 readings, not at the next quarterly review. The practical difference is that the control chart on the supervisor's screen always reflects the current process, not the process as it existed three months ago. Book a Demo to see the comparison on your own plant data.
Fewer overall, by a significant margin. Deployments consistently report a 40 to 47 percent reduction in total alarm volume within the first week of adaptive limits going live. The alarms that remain are different in a critical way: they are real. The false alarms generated by static limits when ore hardness changes or the process enters a normal startup curve are eliminated because the adaptive limits widen to accommodate known variation. The alarms that fire are caused by actual special cause events — liner wear progression detected by Rule 4, sustained mean shifts caught by Rule 3, moderate drifts identified by Rule 2. The total alarm count drops, but the actionable alarm rate stays the same or increases because every remaining alarm carries a confirmed root cause attribution. Supervisors report that the quality of their decision-making improves more than the raw alarm count would suggest, because they no longer spend mental energy filtering out noise. Talk to an Expert about alarm volume projections for your specific circuit.
Yes. Adaptive SPC is a software layer that connects to existing control infrastructure without requiring modifications to the DCS, SCADA, or PLC configuration. iFactory connects via OPC-UA, Modbus TCP, and direct historian exports from OSIsoft PI, Wonderware, and ABB 800xA. The system reads process data from the existing data stream and writes adaptive limit visualizations back to the existing operator dashboard. No new sensors are required. The root cause attribution layer monitors all instrumented process variables — crusher power draw, feed rate, CSS position, bearing temperatures, hydraulic pressure, liner wear counters, screen efficiency readings, and moisture sensors — from the sensors already installed on the circuit. The adaptive SPC model processes this data on an edge computing node installed alongside the existing control hardware, with optional cloud connectivity for cross-plant benchmarking and reporting. Talk to an Expert to discuss your specific control system architecture.
The initial adaptive limits are deployable within 72 hours of data connectivity when 30 days of clean historical data is available. The EWMA model continues to refine its baseline from live data over the following two to three weeks as it encounters the full range of operating conditions — different ore types, liner wear stages, and shift-to-shift variation. During this period, the system operates in shadow mode alongside the existing static SPC, allowing supervisors to compare adaptive and static limit behavior without affecting operations. After two to three weeks of live data accumulation, the adaptive limits reach full stability and can replace static limits as the primary control chart reference. For operations without sufficient historical data, the model operates in a supervised learning mode for the first two to three weeks, establishing baselines from live data alone before switching to fully autonomous limit adaptation. Book a Demo to discuss your specific data availability and timeline.
Yes — and this is one of the primary use cases for adaptive SPC in mining crushing. The platform supports recipe-aware limit sets with pre-trained control limit profiles for each registered ore type. When a recipe change or ore blend transition is logged in the DCS, the model switches to the pre-trained limit profile for that ore type or enters a re-baselining window if no historical data exists for that classification. For mixed-ore operations processing material from multiple faces or pits simultaneously, the model treats ore type as an explicit regime variable and maintains separate UCL and LCL profiles for each registered classification. The transition between profiles is automatic and occurs within 15 to 30 readings of the change event being recorded in the control system. This eliminates the continuous false alarms that occur when static limits designed for one ore type are applied to another, and ensures that the control chart remains meaningful across every production scenario the circuit encounters. Book a Demo to see multi-recipe adaptive SPC demonstrated on data from an operation processing multiple ore blends.
A Control Limit That Lies to You Is Worse Than No Control Limit at All.
iFactory adaptive SPC limits for mining crushing operations — dynamic UCL/LCL that adjust to ore, wear, and feed variation in real time. Western Electric rule detection with root cause attribution. Purpose-built for shift supervisors who need to trust their control charts again.