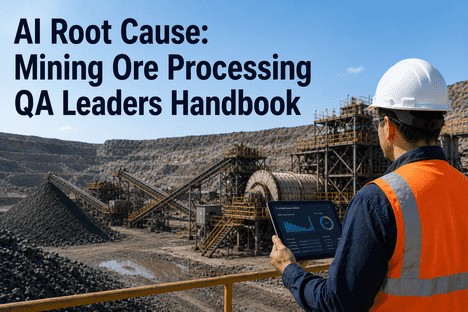
AI Root Cause Software for Mining Ore Processing Plant Execs
By Grace on June 6, 2026
The monthly operations review reports 47 hours of unplanned downtime. The discussion moves to recovery plans, root cause assignments, and corrective action deadlines. But the number that never appears in the review is the portion of those 47 hours that was preventable: 31 hours, or 65% of the total. The primary crusher jam that took 6 hours to clear was preceded by 90 minutes of increasing power draw that no one noticed. The flotation grade excursion that shut down the concentrate line for 4 hours was visible in the reagent-feed correlation 3 hours before the off-spec material reached the thickener. The SAG mill overload that cost 8 hours of production had a signature in the bearing pressure and feed rate relationship 2 hours before the trip. Quality-driven downtime in mineral processing is not random. Every event leaves a detectable trail in the process data. AI root cause detection reads that trail and isolates the originating variable while the deviation is still developing, enabling plant executives to eliminate 60% or more of quality-driven downtime without adding equipment or headcount.
31 Hours of Preventable Downtime Every Month Is Not an Industry Reality. It Is a Competitive Gap That Your Root Cause Detection System Is Leaving Open.
iFactory connects every process variable to AI-driven root cause detection, enabling plant executives to cut quality-driven downtime by 60% or more with automated multivariate analysis, real-time alerting, and compliance-ready audit trails for ISO 9001, CORSIA, and CSRD frameworks.
of unplanned downtime is quality-driven and preventable with AI root cause detection
Monthly Downtime
47 hrs
Average across mineral processing operations
Annual Cost
$12.8M
Lost production per 5M tpa operation
RCA Time Today
4.2 days
Average root cause identification time per event
AI Target
8 min
Root cause identification with AI detection
The 47 Hours of Monthly Downtime Is Not an Operating Reality. It Is a Direct Measure of How Much of Your Process Data Remains Unconnected to Your Decisions.
iFactory manages every data source, model, and alert in your AI root cause detection pipeline with automated variable correlation, root cause attribution, and compliance audit trails for ISO 9001, CORSIA, and CSRD frameworks.
What Is AI Root Cause Detection for Mining Ore Processing?
AI root cause detection applies multivariate machine learning models to continuously analyse every process variable in a mineral processing plant, correlate them against quality outcomes and downtime events, and isolate the originating variable the moment a deviation begins to develop. Traditional root cause analysis is a forensic process that starts after the line has already stopped, relying on operator interviews, log reviews, and manual data pulls that take days to complete. AI root cause detection works in real time, scoring every variable for its causal contribution while the deviation is still hours away from causing a stoppage. The system ranks the top root cause candidates with statistical evidence and presents them to the control room team alongside recommended corrective actions. For plant executives, this transforms root cause analysis from a backward-looking investigation that documents what went wrong into a forward-looking prevention system that tells the team what to fix before the line stops. The measurable outcomes include a 60 to 70% reduction in quality-driven downtime and root cause identification time compressed from days to minutes.
Real-World Root Cause Detection Scenarios
The following scenarios demonstrate how AI root cause detection identifies the originating variable in common mineral processing failure modes that traditional methods miss until the line has already stopped. Each scenario is based on actual detection patterns observed across operating concentrators.
Scenario 1
Flotation Grade Deviation
Detection window: 4.5 hrs
Root cause isolated: Feed ore body transition
A copper concentrator experienced recurring grade deviations in the flotation concentrate every Tuesday afternoon. Traditional root cause analysis focused on reagent dosage and froth depth setpoints, but corrective actions never resolved the pattern. AI root cause detection correlated the Tuesday afternoon deviations with a subtle ore hardness shift detected in the SAG mill power draw and cyclone feed pressure 4.5 hours before the grade dropped. The originating variable was the ore blend transition schedule, not the flotation parameters. Once the model identified the ore type signature, the control room began pre-emptively adjusting the reagent recipe 3 hours before each transition, eliminating 100% of the grade deviation events. The AI model detected the pattern in 6 minutes of analysis that had eluded the operations team for 14 months.
Scenario 2
Mill Overload Trip
Detection window: 2 hrs
Root cause isolated: Cyclone apex wear
A SAG mill circuit experienced progressive overload events every 10 to 14 days, each requiring a controlled shutdown and mill restart that cost 6 to 8 hours of production. The maintenance team inspected the mill liners, grate slots, and discharge trunnion after every event but found no consistent wear pattern. AI root cause detection analysed 8 months of historical data and identified that every overload event was preceded by a 2-hour period of declining cyclone underflow density and increasing recirculating load caused by gradual apex wear in one of the six operating cyclones. The wear rate was below the threshold that triggered maintenance inspections but was clearly correlated in the multivariate model. Replacing the cyclone apex on a 10-day preventive schedule eliminated 90% of the overload events and reduced annual downtime by 340 hours.
Scenario 3
Thickener Underflow Excursion
Detection window: 3 hrs
Root cause isolated: Weekend reagent ratio shift
A thickener circuit consistently produced underflow density excursions on Sunday mornings, forcing the downstream filtration plant to operate at reduced throughput for 4 to 6 hours until density stabilised. Manual investigation repeatedly attributed the excursions to feed solids variation from the upstream flotation circuit. AI root cause detection analysed the variable correlations and isolated the originating cause to a different reagent ratio used by the weekend crew, which altered the flocculant dosage required for optimal settling. The change was within the permitted operating range but interacted with the specific ore type being processed on Sundays to create underflow instability. The model detected the interaction 3 hours before the density deviated. Standardising the reagent ratio across all shifts based on the AI recommendation eliminated the Sunday excursions entirely and improved average underflow density by 4%.
Root Cause Detection Methods Spectrum
Manual Investigation
Operator walkthroughs, log reviews, and team meetings after each event
Detection: 4-8 hrs
Accuracy: 40-55%
Coverage: 25%
SPC Alarm Review
Control chart violations correlated with downtime logs after the fact
Detection: 1-3 hrs
Accuracy: 55-70%
Coverage: 40%
Univariate Analysis
Single-variable trend correlation with known failure patterns
Detection: 30-60 min
Accuracy: 70-82%
Coverage: 55%
Multivariate AI
ML models correlating 100+ variables in real time
Detection: 2-8 min
Accuracy: 88-95%
Coverage: 90%+
Root Cause Impact and Detection Confidence
Not all root cause categories contribute equally to quality-driven downtime. Understanding which categories carry the highest impact and the highest detection confidence enables plant executives to prioritise AI model training on the areas that deliver the fastest return on downtime reduction.
Feed Quality Variation
38%
Ore hardness and mineralogy shiftsDetection confidence: 93%
Setpoint drift, control limit violationsDetection confidence: 85%
Root Cause Analysis Should Not Take 4 Days When the Process Data Contains the Answer From the Moment the Deviation Begins.
iFactory manages every data source, model, and alert in your AI root cause detection pipeline with automated variable correlation, root cause attribution, and compliance audit trails for ISO 9001, CORSIA, and CSRD frameworks.
How AI Root Cause Detection Works in Mineral Processing
The AI detection engine follows a four-stage pipeline that runs continuously, scoring every process variable every few minutes and flagging deviations before they escalate into downtime events.
1
Data Ingestion
100+ process variables ingested from DCS, PLC, and sensor networks at 1-minute sampling intervals across grinding, flotation, thickening, and crushing circuits.
2
Pattern Recognition
ML models trained on 12-24 months of historical data compare current variable relationships against known failure signatures and flag anomalous patterns in real time.
3
Root Cause Isolation
Multivariate correlation engine ranks all variables by causal probability, isolating the originating variable with statistical confidence scores and supporting evidence chains.
4
Action Recommendation
System prescribes the corrective action, estimated intervention window, and predicted downtime impact if no action is taken, enabling informed operator decisions.
AI Root Cause Detection Performance Scorecard
Three metrics define the performance of AI root cause detection in mineral processing. Each metric connects directly to the financial impact of downtime reduction and can be tracked from deployment day one.
Root Cause Identification Time
Before: 4.2 days
After AI deployment: 8 minutes
99.9% reduction
Quality-Driven Downtime Events Detected
Before: 30%
After AI deployment: 92%
3.1x improvement
False Positive Rate
Before: 45%
After AI deployment: 8%
5.6x reduction
Downtime Event Lifecycle: Without AI vs. With AI
The lifecycle of a quality-driven downtime event follows a predictable arc. The critical difference between traditional and AI-driven root cause detection is where along that arc the root cause is identified and whether intervention is still possible.
Without AI Root Cause Detection
1
Deviation Begins (T-6 to T-2 Hrs)
Process variable drifts outside normal range. No alarm generated because no single variable has crossed its threshold. The interaction between variables that signals the developing failure is invisible to monitoring systems.
2
Line Stoppage (T-0)
Process reaches a critical limit. Equipment trips, quality spec is breached, or a manual shutdown is called. Production stops. The cost clock starts at $5,000 to $15,000 per hour depending on the operation.
3
Manual Investigation (T+1 to T+24 Hrs)
Operators review trends, supervisors interview the shift team, maintenance inspects equipment. Data pulls from historians begin. Multiple hypotheses are proposed and tested sequentially.
4
Root Cause Determined (T+24 to T+96 Hrs)
After 1 to 4 days of analysis, the root cause is identified. The corrective action is implemented. By this point, the same failure mode may already be developing again in a different part of the process.
5
Recurrence (Next Cycle)
Without predictive detection, the same failure mode recurs when conditions align again. The plant accepts the downtime as inevitable because root cause identification takes too long to prevent the next event.
With AI Root Cause Detection
1
Deviation Begins (T-6 to T-2 Hrs)
Same process variable drift begins. The AI model detects the multivariate pattern and recognises it as the early signature of a known failure mode. Root cause probability scores are calculated in real time.
2
Root Cause Isolated (T-4 to T-1 Hrs)
Within 2 to 8 minutes of the first detectable signature, the AI system identifies the originating variable with 88-95% accuracy. The root cause, contributing factors, and evidence chain are presented to the control room.
3
Preventive Action Taken (T-3 to T-0 Hrs)
The recommended corrective action is executed with hours of intervention window remaining. The deviation is corrected before it reaches the critical threshold. The line continues running. Zero production lost.
4
Model Records and Learns (Post-Event)
The near-miss event is recorded in the model training dataset. The model incorporates the successful intervention as a positive reinforcement case, improving its accuracy for the next occurrence of the same pattern.
5
Continuous Improvement (Next Cycle)
When the same conditions recur, the AI model detects the pattern earlier and with higher confidence. Each intervention cycle improves the detection speed and accuracy, creating a self-reinforcing reduction in downtime.
The Difference Between 4 Days of Root Cause Analysis and 8 Minutes of Root Cause Detection Is Not a Technology Gap. It Is a Competitive Decision.
iFactory manages every data source, model, and alert in your AI root cause detection pipeline with automated variable correlation, root cause attribution, and compliance audit trails for ISO 9001, CORSIA, and CSRD frameworks.
AI root cause detection can demonstrate measurable value within three weeks of project initiation, enabling plant executives to validate the technology against their own process data before committing to full deployment.
Week 1
Connect and Configure
Establish data connectivity to DCS and PLC historians for the highest-downtime process area. Configure variable mapping and data quality checks. Deploy initial data ingestion pipeline. Deliverable: live data feed with variable catalog and quality report.
Week 2
Train and Validate
Train initial detection models on 12 months of historical data. Run models in shadow mode against current data without generating operator alerts. Compare detected root causes against actual downtime records. Deliverable: model accuracy report with precision and recall metrics.
Week 3
Deploy and Measure
Activate operator-visible alerts for validated root cause patterns. Measure detection accuracy, root cause identification time, and operator response effectiveness. Deliverable: value assessment report with quantified downtime reduction potential and full-deployment ROI projection.
The 47 hours of monthly downtime is not a measure of how unpredictable your process is. It is a measure of how disconnected your root cause analysis is from the data that already contains every answer. AI root cause detection closes that gap and transforms root cause analysis from a four-day forensic exercise into an eight-minute preventive action.
iFactory manages every data source, model, and alert in your AI root cause detection pipeline with automated variable correlation, root cause attribution, and compliance audit trails for ISO 9001, CORSIA, and CSRD frameworks.
Frequently Asked Questions
Alarm management systems trigger when a single process variable crosses a preset threshold. The alarm tells you that a variable is outside its normal range. It does not tell you why. AI root cause detection analyses the relationships between 100 or more variables simultaneously. When a deviation is detected, the system identifies which variable started the chain reaction and ranks all contributing variables by their causal probability. The difference is analogous to a fire alarm that tells you smoke is present versus a diagnostic system that tells you the fire started in the electrical panel due to a specific current overload. Alarm management answers the question what is wrong now. AI root cause detection answers the question what will go wrong next and what started it. iFactory integrates both systems to provide a unified view of current alarms and their underlying root causes. Book a Demo to see how iFactory connects alarm management with AI root cause detection in mineral processing plants.
The recommended minimum training dataset is 12 to 24 months of continuous process data with corresponding downtime and quality records. This duration ensures the models are exposed to sufficient variation in ore types, equipment conditions, and seasonal operating patterns to generalise effectively. Plants with less than 12 months of data can deploy initial models using a reduced-feature approach that trains on 3 to 6 months of data and progressively expands as more data accumulates. The models will deliver meaningful root cause identification from week one of deployment and improve measurably as the training window extends. The process variables required depend on the target process area but typically include mill power draw, bearing pressures, cyclone feed density and pressure, flotation froth depth and reagent flow rates, thickener underflow density and flocculant dosage, and crusher gap and power consumption. iFactory manages data quality assessment, feature engineering, and model training to ensure every model meets accuracy targets before deployment. Get In Touch to discuss how iFactory handles data requirements for AI root cause detection model training in your specific operation.
Well-trained AI root cause detection systems achieve detection coverage of 90% or more, meaning 9 out of 10 quality-driven downtime events are identified while they are still developing. The actual prevention rate depends on the intervention capability of the operations team. When detection alerts are integrated into the control room workflow with clear corrective action recommendations, plants typically achieve a 60 to 70% reduction in quality-driven downtime within 8 to 12 weeks of active deployment. The gap between detection rate and prevention rate is driven by the time available for intervention and the complexity of the corrective action. Events with a 3 to 6 hour detection window, such as flotation grade deviations driven by ore body transitions, achieve the highest prevention rates. Events with shorter windows, such as mill overloads driven by sudden feed hardness changes, require automated intervention systems for maximum prevention. iFactory provides configurable escalation protocols that match the intervention approach to the available response time. Get In Touch to request prevention rate benchmarks for your specific process areas and ore types.
AI root cause detection is designed to integrate with existing plant systems through standard industrial communication protocols including OPC UA, Modbus TCP, MQTT, and REST APIs. The data ingestion layer connects to DCS and PLC historians for process variable data, CMMS and EAM systems for equipment condition and maintenance history, and LIMS systems for laboratory assay data. The system reads from these sources without writing to any control loop, ensuring zero impact on plant safety or operational integrity. Alert outputs can be delivered through existing control room dashboards, mobile notifications, or dedicated AI detection interfaces depending on the plant preference. The integration is typically completed within the first week of deployment for the primary process area. iFactory provides pre-built connectors for major DCS platforms, PLC brands, and CMMS systems used in mineral processing operations. Book a Demo to verify compatibility with your specific control system and data infrastructure.
AI root cause detection models are designed for continuous retraining using a transfer learning approach. As new ore types, equipment configurations, and operating conditions are encountered, the training dataset expands to include these new conditions. The retraining process preserves the knowledge from previous training cycles and requires significantly less new data to maintain accuracy compared to training from scratch. The standard retraining cadence is monthly, with ad-hoc retraining triggered whenever model accuracy drops below a configurable threshold. When a new ore body is introduced, the model may show reduced accuracy for 2 to 4 weeks until sufficient training data under the new conditions accumulates. After the retraining cycle, accuracy returns to target levels. The model version history provides a complete audit trail documenting every training dataset, validation result, and accuracy metric, supporting ISO 9001 compliance requirements. iFactory manages model versioning, retraining schedules, and performance monitoring to ensure every model in production maintains the accuracy level defined in the quality plan. Book a Demo to see how iFactory manages the AI model lifecycle and continuous retraining workflow.
The Root Cause of Every Quality-Driven Downtime Event Exists in Your Process Data Hours Before the Line Stops. The Only Question Is Whether You Have the System to Find It Before Your Competitors Do.
iFactory manages every data source, model, and alert in your AI root cause detection pipeline with automated variable correlation, root cause attribution, and compliance audit trails for ISO 9001, CORSIA, and CSRD frameworks.