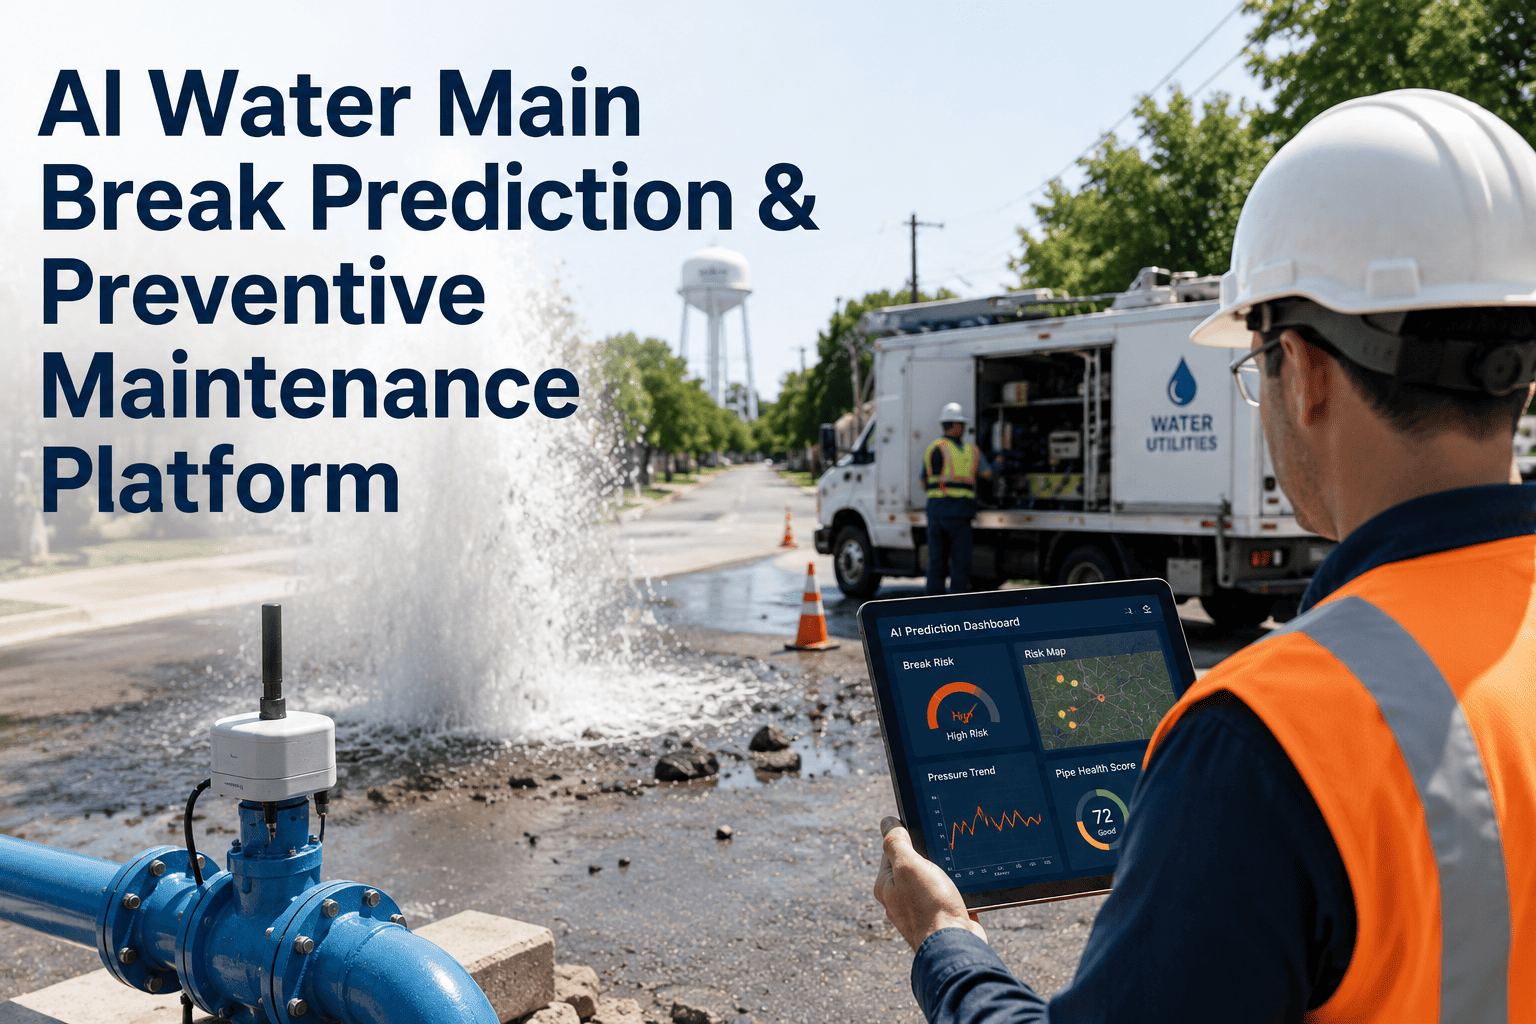
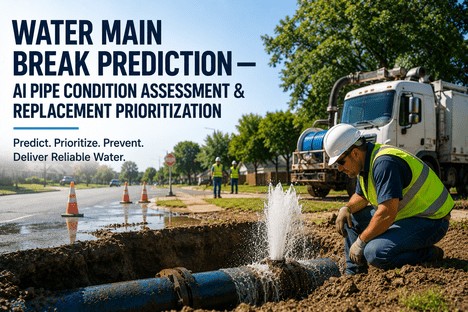
Somewhere in the United States, a water main fails roughly every two minutes, and most utilities still find out the same way: a resident calls to report water in the street. By the time that call comes in, the pipe has already failed, crews are scrambling for an emergency dig, and the surrounding road, homes, or businesses are already dealing with the damage. An AI risk model changes the sequence entirely, scoring every pipe segment in the network against its age, material, pressure history, soil conditions, and break record so the highest-risk mains get inspected or replaced before they fail rather than after. To see how a likelihood-of-failure model would score your own distribution network, book a demo.
WATER INFRASTRUCTURE · PREDICTIVE MAINTENANCE · AI RISK MODELING
Know Which Water Main Breaks Next Before It Breaks
iFactory's AI risk model scores every segment in your distribution network by likelihood of failure, using asset history, pipe material and age, pressure behavior, and soil conditions, so capital and crew time go to the mains that actually need it first.
240,000
Water main breaks occur across the United States every year
6B gal
Treated water wasted daily across the country from main breaks and leakage
33%
Of water mains nationwide are already past 50 years of age
$625B
EPA-estimated 20-year national drinking water infrastructure need
WHY THIS PROBLEM IS GETTING HARDER, NOT EASIER
Aging Pipe, Shrinking Budgets, and a Reactive Maintenance Model That No Longer Scales
Most distribution networks were built in overlapping waves, decades of cast iron, then asbestos cement, then ductile iron and PVC, each material with its own failure curve and its own vulnerability to soil chemistry, freeze-thaw cycling, and pressure transients. A utility with pipe from all four eras is not managing one aging problem, it is managing four, layered on top of each other and buried where nobody can see any of it directly.
The traditional response has been age-based replacement, a straightforward but blunt rule that treats a 60-year-old ductile iron main in stable clay soil the same as a 60-year-old cast iron main in corrosive, shifting soil near a busy intersection, even though their actual failure risk can be dramatically different. Replacing purely by age either wastes capital on pipe that still has useful life left, or leaves genuinely high-risk segments in the ground simply because they have not reached the age threshold yet.
| Decision Input | Age-Based Replacement | AI Risk-Scored Replacement |
| What it measures |
Installation year only |
Age, material, pressure, soil, break history, combined |
| Treats identical-age pipe in different soils |
The same, regardless of condition |
Differently, based on actual risk factors |
| Catches high-risk younger pipe |
Usually missed until it fails |
Flagged early through pressure and break-pattern signals |
| Capital efficiency |
Spends on schedule, not on risk |
Directs spend to highest-likelihood segments first |
| Update frequency |
Static list, rarely revisited |
Continuously re-scored as new data arrives |
HOW THE RISK MODEL ACTUALLY WORKS
Five Data Layers Behind Every Likelihood-of-Failure Score
A break-prediction model is only as good as what feeds it, and the strongest published results in this field consistently come from combining several independent data layers rather than relying on any single variable like pipe age. iFactory's model pulls from the layers below, weighting each according to how much it actually explains past failures in your specific network rather than applying a generic industry formula.
01
Asset Inventory and Material History
Installation year, pipe material, diameter, joint type, and manufacturer where records exist, pulled from GIS, work order systems, and as-built drawings into a single asset record per segment.
02
Break and Repair History
Every prior break on the segment and on comparable pipe nearby, since a documented history of past failures remains one of the strongest available predictors of a future one.
03
SCADA pressure logs and transient events, since repeated pressure surges and water hammer accelerate fatigue in aging joints and corroded pipe walls long before a visible leak appears.
Pressure Behavior and Transient Events
04
Soil, Corrosivity, and Environmental Data
Soil resistivity, moisture variability, and freeze-thaw exposure specific to each pipe corridor, since two pipes of identical age and material can fail at very different rates depending on what surrounds them underground.
05
Operational Context and Criticality
Traffic loading above the pipe, proximity to critical facilities like hospitals, and consequence of failure, so the model ranks not just likelihood but the real-world cost of getting a segment wrong.
See your network's own risk map, not an industry average
iFactory builds the likelihood-of-failure model against your utility's own asset data, break history, and soil conditions, not a generic national curve applied to your map.
FROM SCORE TO ACTION
What a Utility Actually Does With a Likelihood-of-Failure Ranking
A risk score by itself is just a spreadsheet column. The value shows up once that ranking is connected to how a utility actually plans inspections, prioritizes capital replacement, and schedules crews, which is why the deployment focuses as much on workflow as it does on the model itself.
1
Segments Ranked by Percentile
Every pipe segment in the network receives a likelihood-of-failure score and is bucketed into percentile tiers, so the top one percent and top five percent of risk are immediately visible on a map rather than buried in a table.
2
Inspection Priority Set
The highest-tier segments are routed into the inspection and condition-assessment schedule first, focusing limited field crew hours on pipe where a problem is actually likely rather than a rotating citywide sweep.
3
Capital Plan Reordered
Multi-year replacement budgets are re-sequenced around risk tier and consequence of failure, so a high-risk main under a major road moves ahead of a lower-risk main in an easy-access, low-traffic area.
4
Scores Refresh Continuously
As new break events, pressure readings, and repair records come in, the model re-scores the network rather than sitting static until the next multi-year study, so the priority list stays current between planning cycles.
WHAT EARLY WARNING IS ACTUALLY WORTH
The Real Cost Difference Between a Predicted Failure and an Emergency Dig
An emergency water main break is one of the most expensive events a utility deals with operationally, not because the pipe repair itself is complicated, but because of everything that surrounds an unplanned dig: overtime crew costs, traffic control, road and property damage, water loss, and in many cases, boil-water notices that carry their own public health and communication burden. A predicted failure caught weeks or months ahead gets scheduled during normal working hours, on the utility's terms, with parts ordered in advance and traffic control planned rather than improvised.
Emergency Break Response
Crew called out after hours or on weekends at overtime rates, traffic control improvised on short notice, parts sourced under time pressure, water loss continues until the crew arrives and isolates the segment, and nearby customers may face a boil-water notice while the system stabilizes.
Predicted, Scheduled Replacement
Work planned during standard hours with parts and equipment staged in advance, traffic control arranged ahead of the dig, customers notified before any disruption occurs, and the segment replaced on a schedule that fits around other capital projects rather than interrupting them.
DEPLOYMENT PATH
From Contract to a Live Risk Map Across Your Distribution Network
Standing up a break-prediction model does not require ripping out existing GIS or SCADA systems. The model is built to ingest what a utility already has, asset records, break history, and pressure data, and layer the risk scoring on top rather than requiring a parallel data platform.
1
Data Intake and Baseline (Weeks 1 to 4)
Asset inventory, GIS records, break history, and available pressure and soil data are collected and cleaned, and a baseline current-state failure rate is established for comparison once the model is live.
2
Model Training and Validation (Weeks 5 to 8)
The risk model is trained against your network's own historical break data and validated by checking how well it would have predicted breaks that already happened, before it is trusted to predict ones that have not.
3
Live Risk Map and Workflow Integration (Weeks 9 to 12)
The percentile-ranked risk map goes live for planning and operations staff, integrated with inspection scheduling and capital planning workflows, with continuous rescoring as new data arrives after go-live.
SETTING REALISTIC EXPECTATIONS
Why Prediction Accuracy Varies From One Utility's Network to the Next
Published break-prediction results vary meaningfully across utilities, and treating any single published accuracy figure as a guaranteed outcome for a different distribution system is a common planning mistake. The factors below explain most of that variation, and understanding them upfront leads to a more realistic expectation of what a model can and cannot tell you on day one.
Data Completeness Drives Model Quality
A utility with decades of digitized break records and GIS data gives the model far more to learn from than one still working from paper maps and inconsistent work orders, and the resulting accuracy reflects that gap directly.
Pipe Material Mix Changes the Difficulty
A network dominated by a few well-understood materials is an easier prediction problem than one with a scattered mix of cast iron, asbestos cement, ductile iron, and PVC installed across many decades, each with its own failure signature.
Soil and Climate Variability Within the Service Area
A utility spanning multiple soil types and freeze-thaw zones needs the model to learn distinct sub-patterns for each area, which takes more historical data than a service area with relatively uniform ground conditions.
This is exactly why iFactory validates every model against a utility's own historical break data before quoting an expected accuracy range, rather than applying a generic industry benchmark to a network it has not yet analyzed. To find out what a baseline validation would show for your own system, contact our support team.
FREQUENTLY ASKED QUESTIONS
What Utilities Ask Before Deploying a Break-Prediction Model
Do we need new sensors installed on the pipes themselves for this to work?
No, the core risk model runs on data most utilities already collect through GIS, work order systems, and existing SCADA pressure monitoring, so there is no requirement to install new sensors directly on buried pipe before getting a usable risk score. Where a utility does have acoustic leak sensors or additional pressure monitoring in specific zones, that data can be layered in to sharpen the model further, but it is an enhancement rather than a prerequisite. Most utilities are able to generate a first working risk map using records they are already sitting on.
Book a demo to see what your existing data would support.
How far in advance can the model actually predict a break?
The model produces a likelihood-of-failure ranking across defined future windows, commonly one, three, and five years out, rather than pinpointing an exact break date for a specific pipe, since failure timing always carries some uncertainty even with strong data. What it reliably does is separate your highest-risk segments from your lowest-risk ones well before a break occurs, which is what actually drives better inspection and capital planning decisions. Utilities typically use the multi-year rankings to sequence replacement projects rather than to schedule around a single predicted date.
Contact our support team to review how the prediction windows are structured.
Can this replace our existing capital improvement planning process entirely?
No, and it is not designed to. The risk model is built to inform and reorder the prioritization within an existing capital improvement plan, not to replace the budgeting, funding approval, and engineering review processes a utility already runs. What changes is the input going into that planning process, since decisions shift from an age-based or purely reactive list toward one grounded in a measured likelihood of failure specific to each segment. Most utilities integrate the risk ranking as one structured input alongside consequence of failure, funding availability, and coordination with other capital projects.
Book a demo to see how the ranking would slot into your current planning cycle.
Our GIS and asset records are incomplete or partly on paper. Can we still start?
Yes, most utilities begin with imperfect records, and the data intake phase specifically accounts for that reality by combining whatever digitized records exist with reasonable inference from pipe material era, neighborhood installation patterns, and available break history to fill gaps. A network with thinner records will start with a lower-confidence score in the least-documented areas, and that confidence improves as inspections and repairs feed new, verified data back into the model over time. Waiting for perfect records before starting usually costs more in ongoing reactive repair costs than starting the model now and improving it as data quality grows.
Contact our support team to assess what your current records would support on day one.
How is this different from simply ranking pipes by age, which we already do?
Age-based ranking uses a single variable and assumes two pipes installed the same year carry the same risk, which is frequently untrue once material, soil corrosivity, pressure history, and past break patterns are considered together. The comparison table above this section shows the practical difference directly: an AI risk model can flag a younger pipe in aggressive soil as higher-risk than an older pipe in stable ground, a distinction an age-only list cannot make. Utilities that switch from age-based to risk-scored prioritization typically find that a meaningful share of their previous top-of-list replacement candidates were not actually their highest-risk segments once the fuller picture was scored.
Book a demo to compare your current age-based list against a risk-scored version.
START WITH YOUR OWN RISK MAP
Find Out Which Segments in Your Network Carry the Highest Risk
Every utility's network carries a different mix of age, material, soil, and pressure history. iFactory builds the likelihood-of-failure model against your own asset and break data, not a generic national curve, so your replacement priorities reflect your actual system.