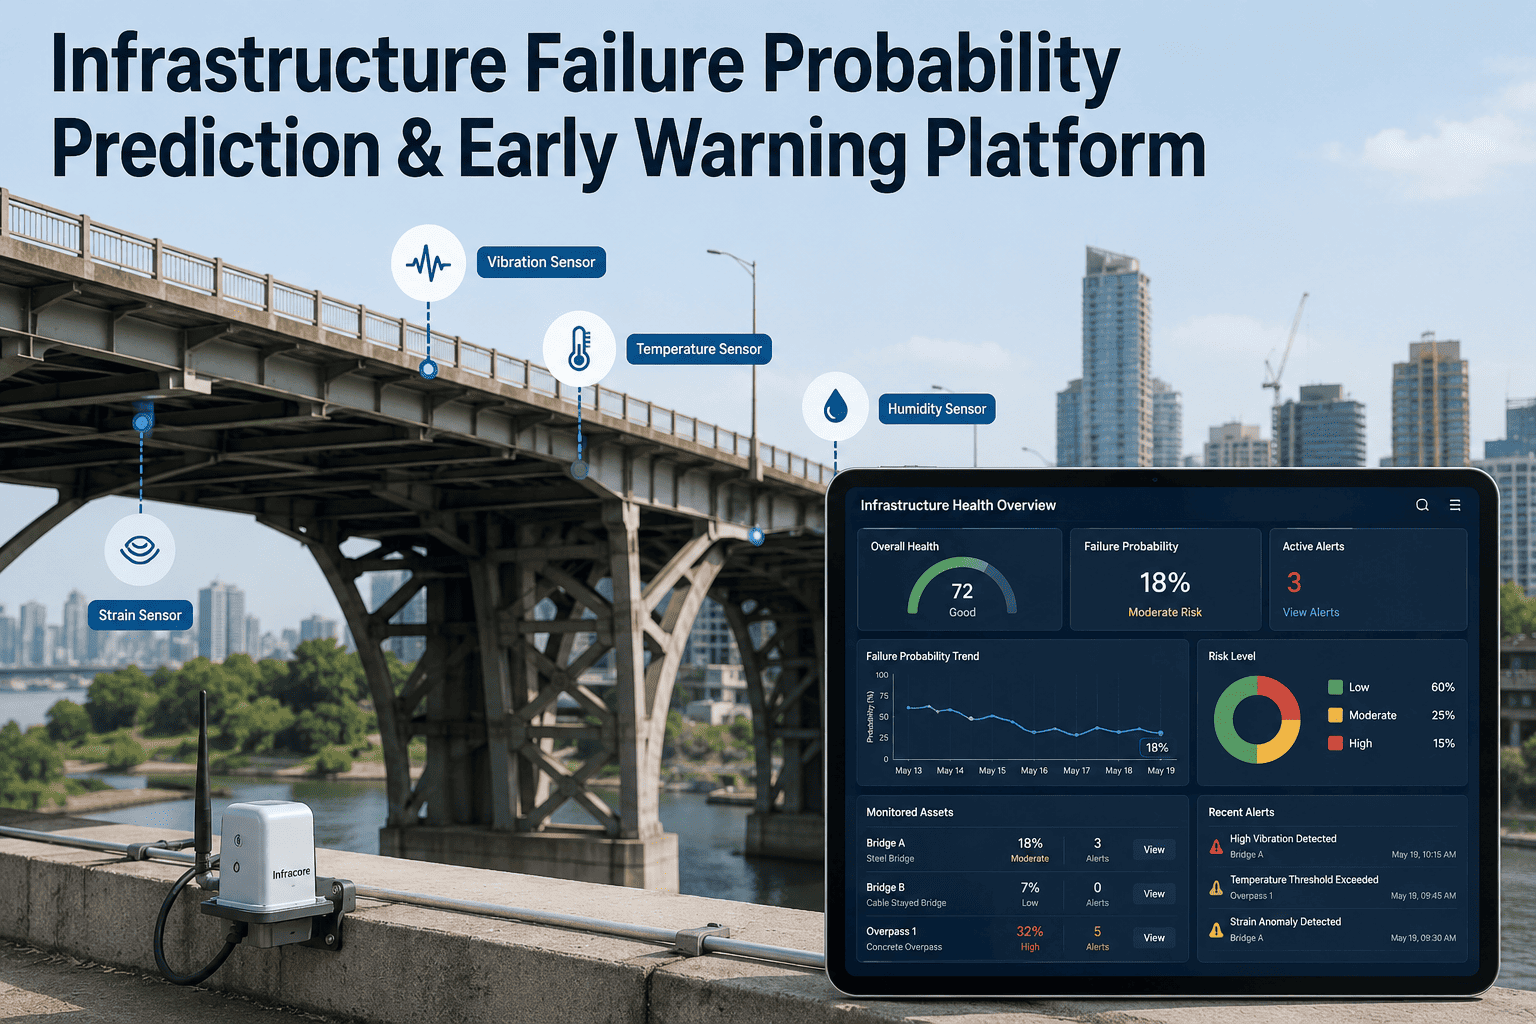
A retaining wall does not fail on the day it is finally reported as a problem. It fails months after the first hairline crack widened, after the drainage behind it started running slower than it should, after a dozen small readings drifted just far enough from normal that nobody happened to compare them side by side. Roads, bridges, pipelines, and facilities send out these signals constantly, but most infrastructure teams only find out once an inspector walks past at the right moment or a failure forces the issue. iFactory reads those signals continuously and turns them into a failure probability score long before the crack becomes a closure, and you can see how the scoring model works for your own assets at ifactory support.
Know Which Asset Is Going to Fail Before It Does, Not After
A predictive analytics and early warning platform that scores failure probability across roads, structures, utilities, and facilities, so maintenance teams can act on a ranked risk list instead of a growing pile of complaints.
Why Infrastructure Teams Are Almost Always Reacting
Most infrastructure organizations are still running on a model built for a slower world: a scheduled inspection cycle, a condition rating that gets updated once a year, and a maintenance budget that gets allocated based on whichever asset complained the loudest. That model was good enough when infrastructure was newer and degradation was slow. It is not good enough now. Assets are aging past their design life at the same time budgets are getting tighter, and the gap between "due for inspection" and "already failing" is where the expensive surprises live. A failure probability platform closes that gap by scoring condition continuously instead of once a year, so the first sign of trouble shows up as a rising number on a dashboard, not as a call from someone standing next to a collapsed culvert.
The deeper problem is that a fixed inspection cycle treats every asset as if it degrades at the same rate, which almost nothing in the physical world actually does. A bridge deck near a coastal environment corrodes faster than one inland. A pipeline segment running through unstable soil moves differently than one on stable bedrock. A once-a-year rating averages all of that variation away, which means the assets degrading fastest are getting exactly the same attention as the ones that will comfortably outlast their inspection interval. Continuous scoring fixes this by letting each asset generate its own trend line, so the ones actually accelerating toward failure get flagged in real time instead of waiting for their turn on a fixed calendar.
From Raw Signal to a Ranked Risk List
A single sensor reading rarely tells the whole story on its own. A slightly higher vibration reading, a slower-than-usual drainage flow, a minor thermal shift, none of these look alarming in isolation. What actually predicts failure is the relationship between signals changing over time, which is exactly what a threshold alarm is built to miss. The flow below shows how iFactory turns scattered raw signals into a single, ranked probability score your team can act on.
Four Asset Classes, One Scored Risk Register
Infrastructure teams rarely manage a single asset type in isolation. A city engineer is watching pavement condition, bridge structures, buried utilities, and public facilities all at once, usually across separate systems that never talk to each other. iFactory scores all four asset classes on the same probability scale, so a failing culvert and a cracking road segment can be compared and ranked on one list instead of living in four different spreadsheets.
Bring Your Asset Data, We Will Show You the Ranked Risk
Share a sample of your existing sensor, inspection, or SCADA data and we will walk through how a live failure probability score would look across your own asset portfolio.
Reactive Monitoring vs Predictive Early Warning
The difference between a reactive alarm and a genuine early warning is not the alert itself, it is how much runway the alert gives your team. A threshold alarm tells you a value crossed a line. A probability score tells you how far an asset has drifted from its own healthy baseline and how fast that drift is accelerating, which is the difference between an emergency crew and a scheduled work order.
| Dimension | Reactive Monitoring | Predictive Early Warning |
|---|---|---|
| Trigger for action | A threshold is crossed or a failure is already visible | A rising probability score flags drift from baseline weeks earlier |
| Typical lead time | Hours to a couple of days before failure | Days to several weeks before failure |
| Response type | Emergency repair, often at a premium cost | Scheduled, planned maintenance at normal cost |
| Data used | Single sensor against a fixed threshold | Multiple correlated signals against a learned baseline |
| Prioritization | Whichever alarm fired most recently | Ranked list by probability and consequence of failure |
What a Working Early Warning Program Actually Delivers
The value of a probability score is not the number itself, it is the decision the number changes. Teams that move from scheduled inspection cycles to continuous scoring consistently report a shift in how their maintenance budget gets spent, moving away from emergency response and toward planned work that costs less and disrupts less.
There is also a quieter benefit that shows up less in the headline numbers and more in day-to-day operations: fewer surprises means fewer late-night calls, fewer emergency crew callouts, and fewer public-facing incidents that damage trust in the agency or utility managing the asset. A road closure that was planned two weeks in advance barely registers with the public. The same closure announced the morning it happens generates complaints, press coverage, and pressure on leadership to explain why nobody saw it coming. A ranked probability score does not just save money, it changes the entire tone of how an infrastructure team is perceived by the people who depend on that infrastructure every day.
Getting a Warning Program Live in Four Phases
Standing up a failure prediction program does not have to mean instrumenting an entire asset portfolio on day one. Most teams get a working, trusted risk score running on a limited set of assets first, prove the model against what actually happens on the ground, and then expand coverage once the scoring is validated against real outcomes.
This staged approach matters because trust in a risk score is earned, not assumed. A planner who has spent years relying on a fixed inspection calendar will not hand over a maintenance budget to a number they cannot explain. Running a pilot against a known set of assets, including a few that are already flagged as problem cases and a few that are healthy, gives the model a chance to prove itself against outcomes people already understand. Once the pilot correctly ranks the assets a field team already knew were failing, and correctly leaves the healthy ones near the bottom of the list, the ranked register stops being an experiment and starts being the tool the team actually plans around.
Curious how quickly your own assets could be added to a ranked risk register? Send us a sample data set and we will show you what a pilot score would look like.
Frequently Asked Questions
Get a Ranked Failure Risk Score Across Your Portfolio
Bring your existing sensor, SCADA, or inspection data to the call. We will walk through how a live probability score would rank your assets today and what an early warning program would look like on your infrastructure.