The International Roughness Index is the pavement performance metric that FHWA uses to determine whether your state's interstate and NHS network meets federal standards. One number — expressed in inches per mile or meters per kilometer — determines whether your pavement section is classified as Good, Fair, or Poor under the MAP-21 performance measures, and that classification directly affects your agency's federal funding compliance reporting every two years. The IRI network survey is the mechanism that produces that number: a continuous longitudinal profile measurement collected at highway speed by a certified inertial profiler operating under ASTM E950 protocols, processed through a quarter-car simulation algorithm originally developed by the World Bank, and reported as the Mean Roughness Index averaged across both wheelpaths for every 0.1-mile segment of the network. In 2026, with the updated FHWA performance measure targets and the growing adoption of incentive-based smoothness specifications at the state level, the accuracy and repeatability of IRI network surveys have never been more consequential for agency budgets and pavement management strategy.
What IRI Actually Measures — and What It Does Not
IRI is often described as a measure of ride quality, but that description is incomplete in a way that matters for network survey planning. IRI measures the accumulated suspension displacement of a standard quarter-car model traveling over a measured longitudinal profile at 80 km/h. It quantifies how much the vehicle suspension moves in response to surface deviations — expressed as the total vertical displacement per unit of horizontal travel distance (m/km or in/mile). A smooth road produces minimal suspension motion and a low IRI. A rough road produces large suspension motion and a high IRI.
What IRI does not measure is equally important for survey design. IRI does not measure structural capacity, skid resistance, surface distress type or severity, or pavement texture. Two pavement sections with identical IRI values can have completely different distress profiles — one may be smooth but heavily cracked, the other rough but structurally sound with no cracking. IRI is a functional performance measure, not a structural one. The most effective pavement management programs combine IRI network surveys with PCI distress surveys and structural testing to produce a complete condition picture for each segment.
The FHWA IRI Thresholds: Good, Fair, and Poor Classification
Under 23 CFR 490, FHWA requires state DOTs to report pavement condition on the Interstate and non-Interstate NHS using IRI as one of three condition metrics (along with cracking, rutting, and faulting). The IRI threshold values that define Good, Fair, and Poor are set by FHWA and revised periodically. As of the most recent rulemaking, the thresholds for asphalt pavements on the interstate system are: Good at IRI below 95 in/mile, Fair at IRI between 95 and 170 in/mile, and Poor at IRI above 170 in/mile. States must establish performance targets for the percentage of the network in Good condition and report biennially on progress toward those targets.
The Inertial Profiler: How the Measurement Is Made
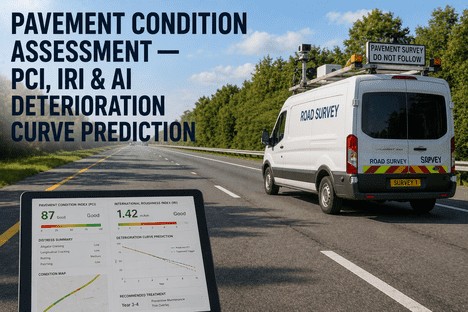
The inertial profiler is the instrument that makes IRI network surveys possible at highway speed. It combines three measurement subsystems to create a continuous longitudinal profile of the pavement surface without requiring a fixed reference beam or walking-level survey. The profiler is mounted on a host vehicle — typically a van or SUV — and collects data across both wheelpaths simultaneously at speeds up to highway velocity, covering 50 to 100 miles of network per survey shift depending on traffic conditions and route density.
Establishes the inertial reference plane by measuring vertical acceleration of the vehicle body. Double integration of the acceleration signal produces the vertical position of the sensor relative to an earth-fixed reference, independent of the vehicle's suspension motion over bumps and dips.
Measures the distance from the vehicle body to the pavement surface using a laser spot or line projected onto the road. Modern line lasers emit a 4-inch transverse line and compute a single bridged elevation value, reducing sensitivity to small surface texture variations.
An encoder or DMI measures wheel rotation to determine longitudinal distance traveled. This establishes the horizontal coordinate for each profile elevation point and controls the profile sampling interval, which must be uniform and known for accurate IRI computation.
The onboard computer system samples all sensor signals synchronously, applies digital filtering (high-pass and low-pass) to remove vehicle body motion and surface texture noise, and stores the processed profile as a sequence of elevation-distance pairs for each wheelpath.
From Profile to IRI: The Quarter-Car Simulation
The measured longitudinal profile is a set of elevation values at regular distance intervals. To convert that elevation profile into an IRI value, the data is processed through a mathematical model — the Golden Car quarter-car simulation — that represents the dynamic response of a standard vehicle suspension traveling over the measured surface at 80 km/h. The model parameters (sprung mass, unsprung mass, tire stiffness, suspension damping) are fixed by the World Bank standard and never vary, ensuring that IRI values from different profilers, operators, and agencies are directly comparable.
Profiler Certification: The Quality Assurance Backbone of Network IRI Data
IRI data from a network survey is only as reliable as the certification of the profiler that collected it. ASTM E950 (updated in 2022 to incorporate cross-correlation methods compatible with AASHTO R56) and AASHTO R57 define the certification protocols that every profiler must pass before its data can be used for network-level reporting or construction acceptance. The certification process verifies that the profiler produces repeatable and accurate profile measurements compared to a reference device — typically a Class 1 walking profilometer or inclinometer-based system.
IRI-Based Smoothness Specifications: Incentives, Disincentives, and the As-Built Standard
IRI is not only a network-level performance measure — it is also the most widely used construction acceptance metric for pavement smoothness. Over 50 state DOTs now use IRI-based smoothness specifications that tie contractor payment to as-built ride quality, with incentive bonuses for sections that exceed the smoothness target and disincentive deductions for sections that fall below it. The thresholds vary by agency, pavement type, and functional classification, but the structure is consistent: the contractor's pay is a function of the measured IRI on each 0.1-mile lot of the completed pavement.
Research from the FHWA Long-Term Pavement Performance program and multiple state DOT studies has demonstrated that pavements constructed to IRI targets below 60 in/mile retain their smoothness longer and require earlier rehabilitation interventions compared to pavements constructed at IRI above 100 in/mile. The initial smoothness premium — the extra cost of achieving a target IRI of 50 in/mile versus 80 in/mile — is typically recovered multiple times over the pavement lifecycle through reduced user delay costs during future maintenance and longer intervals between resurfacing cycles.
Network Survey Design: Sampling Strategy, Frequency, and Data Management
An IRI network survey is a large-scale data collection operation that must be planned around route density, traffic control requirements, data quality protocols, and budget constraints. The FHWA HPMS field manual specifies that IRI data must be collected on all NHS routes and reported at 0.1-mile intervals, but it does not mandate a specific survey frequency — that is determined by each state's pavement management plan and available resources. The most common practice among state DOTs is a 2-year to 4-year network survey cycle, with high-priority routes (interstate, high-ADT NHS) surveyed annually or biennially and lower-volume routes surveyed on the longer cycle.
Segment the network by functional class, traffic volume, and pavement type. Assign survey frequency based on deterioration rate and FHWA reporting requirements. Interstate routes typically surveyed annually or biennially; non-interstate NHS surveyed on 2-to-4-year cycle.
Certified profiler and operator collect continuous profile data in both wheelpaths. Daily QC checks include bounce test verification, distance calibration, and reference section verification. Data exported to PPF format and reviewed in ProVAL before acceptance.
IRI computed per wheelpath at 0.1-mile intervals. MIRI calculated as average of left and right IRI values. Data submitted to FHWA HPMS database for biennial performance reporting. Pavement management system updated with new IRI values for deterioration modeling.
When we switched from a 4-year IRI network survey cycle to a 2-year cycle on our interstate NHS routes, we discovered something that fundamentally changed our pavement program: the deterioration rate on our higher-volume asphalt sections was three times faster than our models predicted. Roads that we expected to stay in Good condition for 6 years were crossing the Fair threshold in 3 to 4 years. The more frequent IRI data gave us the lead time to adjust our preservation schedule and reprogram overlay projects before those segments hit Poor condition. The extra survey cost was approximately 0.3% of our annual pavement budget, and it redirected approximately $12 million in rehabilitation spending to preventive treatments that kept those roads in Good condition for another 5 years. IRI data frequency is not a measurement cost — it is an insurance premium against catastrophic condition surprises.
— Pavement Management Engineer, State DOT — Post-Implementation Assessment of Biannual IRI Network Survey ProgramLocalized Roughness: What a Segment-Level IRI Can Miss
One of the most important concepts in IRI network survey interpretation is the distinction between segment-level IRI and localized roughness. A 0.1-mile segment with an average IRI of 80 in/mile (Good classification) can contain a localized roughness event — a bump, dip, or settlement — that produces a peak IRI of 200 in/mile over a 10-foot length. The segment-level average masks the localized event because the roughness is averaged across the full 528-foot segment. That localized event, however, may be the feature that produces the driver complaint, causes the vehicle damage, or triggers the safety investigation.
Modern IRI analysis tools — including ProVAL and the iFactory pavement analysis platform — identify localized roughness events by computing IRI on a sliding window within each segment and flagging any sub-segment where the IRI exceeds a user-defined threshold, typically 150 to 200 in/mile. Localized roughness identification is essential for bridge approach monitoring, utility cut settlement detection, and pavement condition escalation before the segment-level IRI reflects the severity of the problem.
Conclusion
The International Roughness Index is not just a number that agencies report to FHWA every two years. It is a functional performance measure that connects the as-built quality of new pavement construction to the ride experience of the traveling public, the rate of pavement deterioration over time, and the allocation of billions of dollars in maintenance and rehabilitation funding across the national highway network. The IRI network survey — conducted with a certified inertial profiler, processed through the standard quarter-car model, and reported as MIRI at 0.1-mile intervals — is the data foundation on which those decisions rest.
The accuracy of that foundation depends on three factors that are entirely within the agency's control: profiler certification compliance, operator training and proficiency, and survey frequency that matches the deterioration rate of the network. Agencies that invest in these three elements produce IRI data that supports confident FHWA reporting, effective pavement management decisions, and defensible communication with elected officials and the public about the condition of the road network they are responsible for maintaining.
iFactory provides comprehensive IRI network survey support — from profiler certification planning and operator training to survey design, data quality management, localized roughness analysis, and FHWA compliance reporting. Book a demo to see how iFactory can support your IRI network survey program, or talk to an expert about the first steps toward building a defensible IRI data program for your agency's pavement network.