Pavement Condition Index PCI for Asphalt Distress Surveys

By Grace on June 18, 2026

pavement-condition-index-pci-asphalt-distress

The Pavement Condition Index is the universal language of road health. Developed by the U.S. Army Corps of Engineers and standardized under ASTM D6433, PCI translates the complex reality of cracks, rutting, raveling, and potholes into a single number between 0 and 100. That number determines whether a road gets a routine crack seal this year, a structural overlay next year, or a full reconstruction in the next capital budget. For agencies managing hundreds or thousands of lane-miles, PCI is the difference between reactive emergency spending and strategic lifecycle asset management. A 2024 survey by the Metropolitan Transportation Commission found that the average PCI across Bay Area roads was 67, meaning most asphalt networks are already past the threshold where deterioration accelerates exponentially. Without a systematic PCI program, agencies are making million-dollar decisions on 20-year investments based on guesswork.

ASTM D6433 PCI · Asphalt Distress Survey · Pavement Management
Pavement Condition Index PCI for Asphalt Distress Surveys: From Field Data to Network Strategy
Master ASTM D6433 distress identification, severity rating, density calculation, and PCI scoring to transform visual pavement surveys into defensible maintenance and rehabilitation decisions.

The PCI Scale: Where Does Your Network Stand?

PCI scores are grouped into condition categories that directly translate to treatment strategies. The scale is not linear — a road at PCI 70 deteriorates slowly, but the same road at PCI 55 begins a rapid decline that multiplies repair costs by a factor of 5 to 10 within a few years. Understanding where each segment falls on this spectrum is the foundation of every pavement management decision.

PCI Rating Spectrum: Condition Category to Treatment Strategy
86-100 Excellent
71-85 Good
56-70 Satisfactory
41-55 Fair
26-40 Poor
0-25 Serious to Failed
Routine maintenance; crack seal only
Preventive preservation; slurry seal, microsurfacing
Schedule structural work; thin overlay
Program rehabilitation; mill and fill
Major rehabilitation or reconstruction
Full reconstruction required; failed base

The Five-Step PCI Calculation: From Distress to Decision

Every PCI score begins with a visual survey of a defined sample unit. ASTM D6433 prescribes a systematic five-step process that converts raw field observations into a repeatable, objective condition index. The methodology ensures that two different inspectors surveying the same pavement section will arrive at the same PCI score within an acceptable tolerance.

1
Divide the pavement into sample units
Each sample unit is approximately 5000 square feet (roughly 500 m2) of pavement surface. For large networks, ASTM recommends random statistically valid sampling at 10% of the total area. Critical corridors and high-traffic routes should be inspected at 100% coverage. Sample units are the atomic unit of PCI — every score starts here.
2
Record distress type, severity, and quantity
For each distress observed, the inspector records three data points: the distress type (one of 21 asphalt distresses defined by ASTM D6433), the severity level (Low, Medium, or High based on standardized criteria), and the affected area in square feet or linear feet. Modern inspectors use tablet-based apps that GIS-tag each distress automatically.
3
Calculate distress density and deduct values
Density = (total area of distress / total sample unit area) x 100. The density percentage is then mapped to a Deduct Value using ASTM-provided curves specific to each distress type and severity level. For example, 2% alligator cracking at medium severity yields a deduct value of approximately 25, meaning that single distress reduces the sample from 100 to 75 before any other distresses are accounted for.
4
Compute the Corrected Deduct Value
When multiple distress types exist in the same sample unit, the individual deduct values cannot simply be summed — that would double-count overlapping deterioration. The CDV is derived from a standard correction curve that accounts for the number of individual deduct values greater than 5 (designated as q). The CDV curve ensures the final penalty fairly represents combined distress interaction.
5
Calculate PCI = 100 minus CDV
The final PCI for the sample unit is 100 minus the maximum Corrected Deduct Value, rounded to the nearest whole number. Sample unit PCIs are then averaged (area-weighted) to produce segment-level and network-level scores. A segment of 10 sample units with PCIs of 72, 68, 74, 65, 70, 66, 71, 69, 73, and 67 would yield a segment PCI of approximately 70 — in the Satisfactory range, but trending toward the threshold where accelerated deterioration begins.

The 21 Asphalt Distress Types Defined by ASTM D6433

ASTM D6433 catalogues 21 distinct distress types for asphalt-surfaced pavements. Each distress has standardized severity criteria (Low, Medium, High) and specific measurement protocols. The distresses fall into four functional categories: cracking, surface deformation, surface defects, and patching. Inspectors must be trained to distinguish between distresses that look similar but indicate different root causes — for instance, alligator cracking signals structural base failure while block cracking indicates age-related binder shrinkage.

Cracking Distresses
Alligator cracking — interconnected load-related fatigue cracks in wheel paths; signals base failure
Block cracking — rectangular cracks from thermal cycling and binder aging; non-load related
Edge cracking — crescent-shaped cracks near pavement edge; poor shoulder support or drainage
Longitudinal cracking — cracks parallel to centerline; poor paving joint or subgrade settlement
Transverse cracking — cracks perpendicular to centerline; thermal shrinkage or reflective cracking
Reflection cracking — cracks in overlay mirroring underlying PCC joints or cracks
Slippage cracking — crescent or half-moon cracks from poor layer bond; braking forces
Surface Deformation
Rutting — longitudinal surface depressions in wheel paths; consolidation or shear failure in asphalt or base layers
Corrugation — transverse ripples perpendicular to traffic; plastic flow at intersections and stops
Shoving — localized longitudinal displacement from traffic pushing against pavement
Depression — low areas with gentle slopes; settlement of underlying layers
Bumps and sags — surface displacement from heaving or swelling soils; often frost-related
Swell — upward bulge from expansive subgrade or frost heave; typically seasonal
Surface Defects & Patching
Raveling and weathering — aggregate dislodging from surface; binder oxidation or poor mix design
Bleeding — excess asphalt binder rising to surface; low air voids or over-asphalted mix
Polished aggregate — surface aggregate worn smooth by traffic; reduced skid resistance
Potholes — bowl-shaped depressions from advanced alligator cracking; full-depth material loss
Patching and utility cuts — replaced areas with differing condition than surrounding pavement
Lane/shoulder drop-off — elevation difference between traveled lane and shoulder; safety hazard
Low ride quality — subjective roughness rating; correlates with IRI and user satisfaction

Network-Level vs Project-Level PCI: Two Scales of Decision-Making

PCI data serves two distinct management purposes, and confusing the two is one of the most common mistakes in pavement management. Network-level PCI analysis answers the question of where to spend money across the entire road system. Project-level PCI analysis answers the question of exactly what treatment to apply to a specific road segment. Both are essential, but they require different survey densities, different distress resolution, and different analytical outputs.

Network-Level PCI
Purpose
Budget allocation, policy setting, performance reporting to stakeholders and funding agencies
Sampling
Statistical sampling at 10-20% of segments; random sample units within each segment
Distress detail
All 21 distress types recorded; severity and quantity measured per ASTM protocol
Update frequency
Every 2-4 years for most agencies; annual for high-priority networks
Deliverable
Color-coded network maps, average PCI by jurisdiction, 10-year deterioration projections
Project-Level PCI
Purpose
Treatment selection, detailed engineering design, contract specification development
Sampling
100% inspection of every sample unit within the project segment; no statistical sampling
Distress detail
Same 21 distress types plus additional measurements: IRI, core samples, FWD deflection testing
Update frequency
Once, immediately before treatment design; re-survey if more than 12 months since last survey
Deliverable
Section-by-section treatment recommendations, engineer's estimate, bid package documentation

The Deterioration Curve: Why PCI 60 Is the Most Dangerous Number in Pavement Management

Pavement deterioration is not linear. A road that drops from PCI 95 to PCI 85 over 10 years will drop from PCI 60 to PCI 40 in the next 2 to 3 years. This exponential acceleration is the central reality of pavement asset management. The FHWA and multiple state DOT studies have documented that applying a preventive treatment at PCI 70 costs approximately $5 to $8 per square yard. Waiting until the same road reaches PCI 40 requires a structural overlay at $25 to $40 per square yard — a 5x cost increase for the same functional result.

The strategic implication is clear: the most cost-effective PCI program identifies roads that are still in Satisfactory condition (PCI 56-70) and applies preventive treatments before they cross the accelerated deterioration threshold. Every dollar spent at PCI 70 saves $4 to $6 in rehabilitation costs within 5 years. This is the fundamental economic justification for investing in a systematic PCI survey and pavement management program.

ASTM D6433 PCI · Asphalt Distress Survey · Pavement Management
Stop Guessing at Pavement Condition. Start Managing with PCI Data.
iFactory provides PCI survey planning, distress identification training, data management, and analysis tools that turn field observations into defensible network-level pavement management decisions.
"

We had been managing our roads reactively for decades — patching potholes, responding to complaints, and spending most of our budget on emergency reconstruction. When we ran our first full network-level PCI survey, we discovered that 40% of our arterial roads were in the Satisfactory range, PCI 60 to 70, with no preventive work scheduled. Those roads would have cost us $6 million in overlays within 3 years if we had done nothing. A $1.2 million crack seal and microsurfacing program brought them back to PCI 80 and extended their service life by 8 years. The PCI data paid for itself 5 times over in the first year of implementation.

— Public Works Director, Mid-Sized Municipal Agency — Post-Implementation Report on Network-Level PCI Program

Conclusion: PCI Is Not Just a Number — It Is a Management System

The Pavement Condition Index is often treated as a measurement — a score that tells you how bad your roads are. But the real value of PCI is not the number itself; it is the management framework that the number enables. A PCI program forces an agency to define its network boundaries, segment roads consistently, train inspectors to the same standard, apply ASTM protocols uniformly, and track condition changes over time. It creates a common language between engineers, budget analysts, elected officials, and the public. It replaces the pothole complaint hotline with a data-driven prioritization system that allocates limited funds to the roads where they will have the greatest lifecycle benefit.

The agencies that invest in PCI programs do not just know their average pavement score. They know which roads are approaching the accelerated deterioration threshold and need preventive treatment this year. They know which segments are candidates for grant funding because the data documents need and projected benefit. They know exactly how much funding is required to maintain the network at a target PCI level, and they can communicate that number to city councils and county boards with confidence. And when a citizen asks why a particular street is being crack-sealed while another one with visible potholes is not, the PCI analysis provides a defensible answer: preventive treatment on the first road saves $40,000 compared to waiting for it to reach the same condition as the second road.

iFactory provides end-to-end PCI program support — from survey planning and inspector training to data processing, analysis, and integration with your existing pavement management system. Whether you are launching your first network-level PCI survey or refining an established program with automated distress detection and GIS-based reporting, iFactory helps you turn pavement condition data into smarter maintenance investments. Book a demo to see how iFactory can support your PCI program, or talk to an expert about the first steps toward implementing ASTM D6433-compliant PCI surveys for your pavement network.
Frequently Asked Questions

PCI and IRI measure fundamentally different aspects of pavement condition. PCI is a visual condition index based on surface distresses — cracking, rutting, raveling, potholes, and similar defects. It is measured through visual inspection and quantifies the structural and functional surface condition. IRI, or International Roughness Index, measures ride quality using a profilometer that records vertical axle displacement over distance. A road can have a low PCI (heavy cracking and patching) but still ride smoothly, or conversely have a high PCI (no visible distress) but feel rough due to poor profile. The two metrics are complementary — PCI tells you what is wrong with the pavement surface while IRI tells you how it feels to drive on it. Best practice pavement management programs track both. Talk to an expert about integrating PCI and IRI data into your pavement management system.

ASTM D6433 provides specific guidance on sample size for PCI surveys. For network-level assessments, a minimum of 10% of sample units within each pavement section should be inspected, selected using a random or systematic sampling protocol. For sections with 10 or fewer sample units, ASTM recommends inspecting all units. For sections with more than 40 sample units, the minimum sample size is calculated using a formula that accounts for the variability of distress within the section. The key principle is statistical representativeness — the sampled units must reflect the full range of conditions present in the section. In practice, most agencies inspect 10-20% of sample units for network-level surveys and 100% for project-level surveys. Higher traffic routes and variable condition sections warrant higher sampling rates. Book a demo to see how iFactory helps optimize PCI survey sampling plans for your network size and budget.

The most common and consequential mistake in PCI field surveys is the misidentification of alligator cracking as block cracking, or vice versa. Alligator cracking is load-related and appears only in wheel paths — it signals structural base failure and requires entirely different treatment (structural overlay or reconstruction) than block cracking. Block cracking covers the entire pavement surface, is caused by binder aging and thermal cycling, and is typically treated with a surface seal or thin overlay. Inspectors who confuse the two will produce PCI scores that are structurally meaningless, leading to treatment recommendations that waste money on roads that need reconstruction and fail to preserve roads that need only surface treatment. Proper ASTM D6433 inspector training, including field reference cards with photographs of each distress at each severity level, is essential to data quality. Talk to an expert about PCI inspector training and quality control programs.

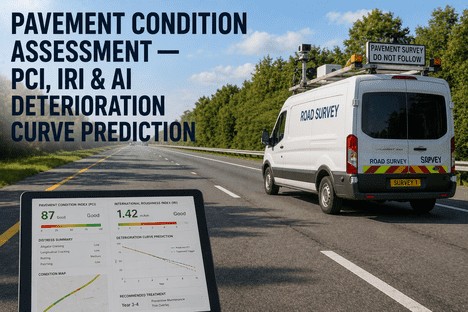
Yes, and automated PCI collection is rapidly becoming the industry standard for network-level surveys. Modern automated survey vehicles use a combination of 2D line-scan cameras, 3D laser profilers, GPS, and inertial measurement units to capture continuous pavement imagery and surface data at highway speeds. Deep learning algorithms trained on ASTM-defined distress classifications can identify and quantify all 21 asphalt distress types with reported accuracy rates of 85-95% depending on the distress type and severity. Automated surveys offer significant advantages over manual inspections: 100% coverage of the network (vs statistical sampling), elimination of inspector subjectivity and fatigue error, consistent distress classification across the entire network, and integration with GIS for spatial analysis. However, automated PCI is not yet a full replacement for project-level manual inspections — complex distress interactions and low-severity cracking still benefit from skilled human verification. The best practice is a hybrid approach: automated surveys for annual network-level updates with targeted manual verification of sample units on high-priority or ambiguous sections. Book a demo to see how iFactory integrates automated and manual PCI data collection into a unified pavement management platform.

The commonly cited target PCI for municipal and county road networks is 70 — the boundary between Satisfactory and Good on the ASTM scale. A network PCI of 70 is the point at which most roads can be maintained with preventive and routine treatments rather than requiring structural rehabilitation. Below PCI 70, the proportion of roads in the Poor and Failed categories increases rapidly, and the annual budget required to prevent further decline grows exponentially. The FHWA recommends that agencies establish an explicit target PCI as part of their asset management plan, with the understanding that achieving and maintaining a PCI of 70 requires annual investment of approximately 1.5% to 2.5% of the pavement network's replacement value. Agencies with network PCI below 60 should plan for a multi-year catch-up program that funds both preventive treatments for roads in Satisfactory condition and targeted rehabilitation for the most critical failed segments, with the goal of reaching PCI 70 within 5 to 10 years depending on available funding. Talk to an expert about developing a PCI target and funding strategy for your agency's pavement network.

Your Pavement Network Deserves More Than Guesswork. iFactory Delivers the Data You Need to Manage, Prioritize, and Defend Every Dollar.
From ASTM D6433-compliant PCI surveys and distress identification training to network-level analysis, deterioration modeling, and treatment optimization — iFactory provides the tools and expertise to transform pavement condition data into strategic asset management decisions.

Share This Story, Choose Your Platform!