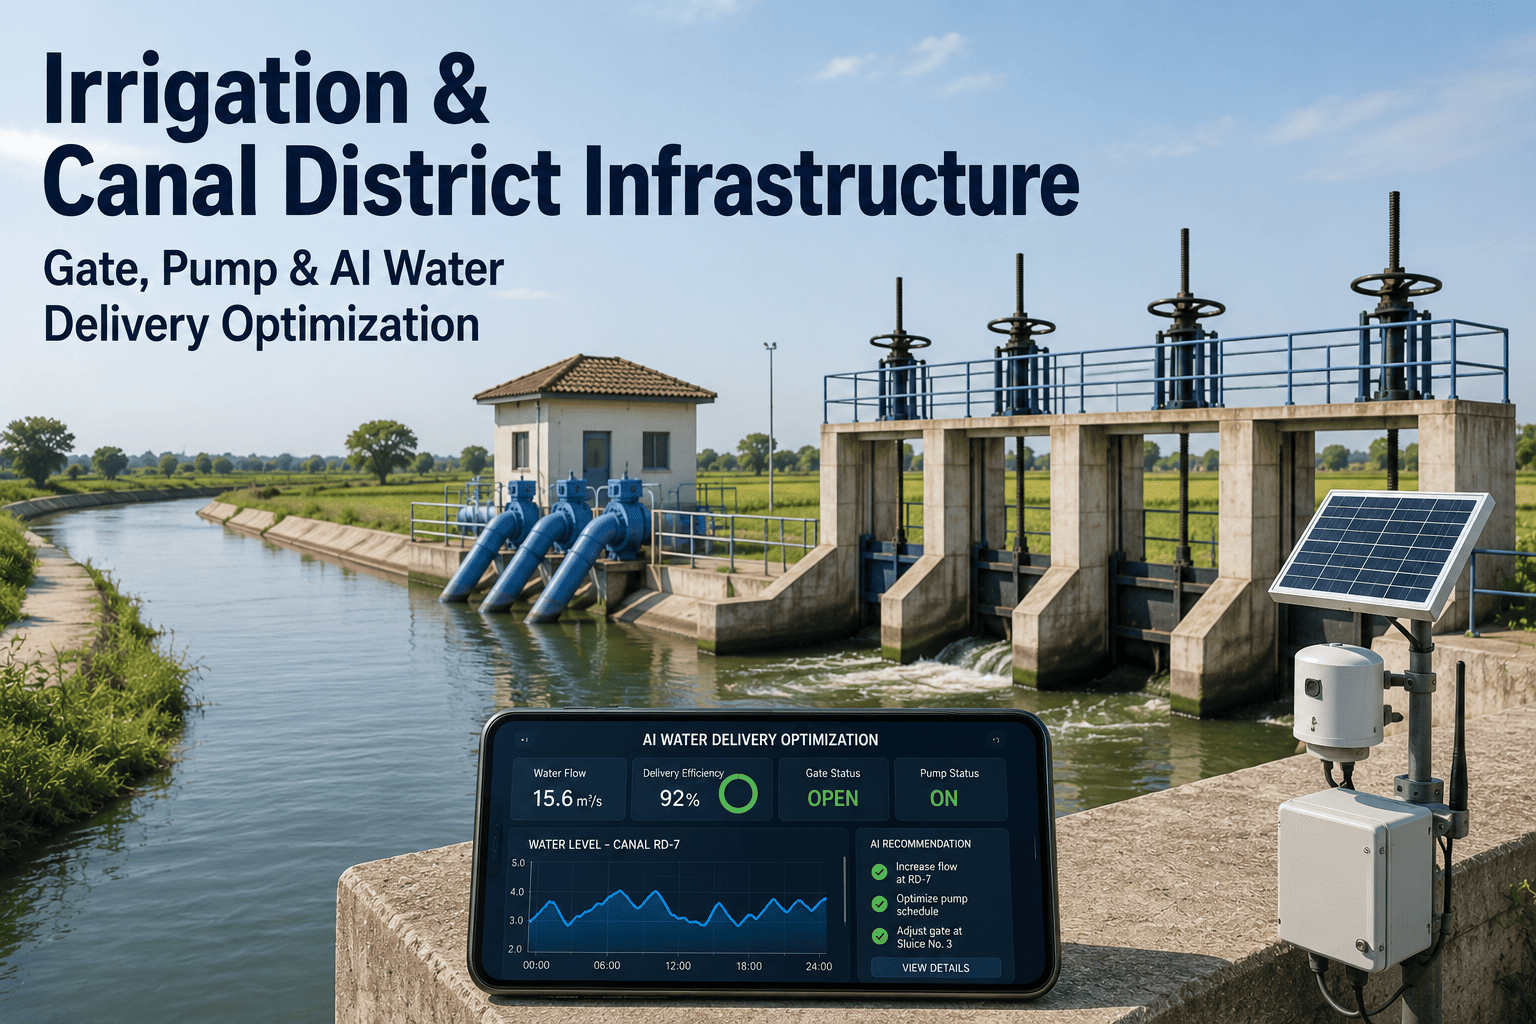
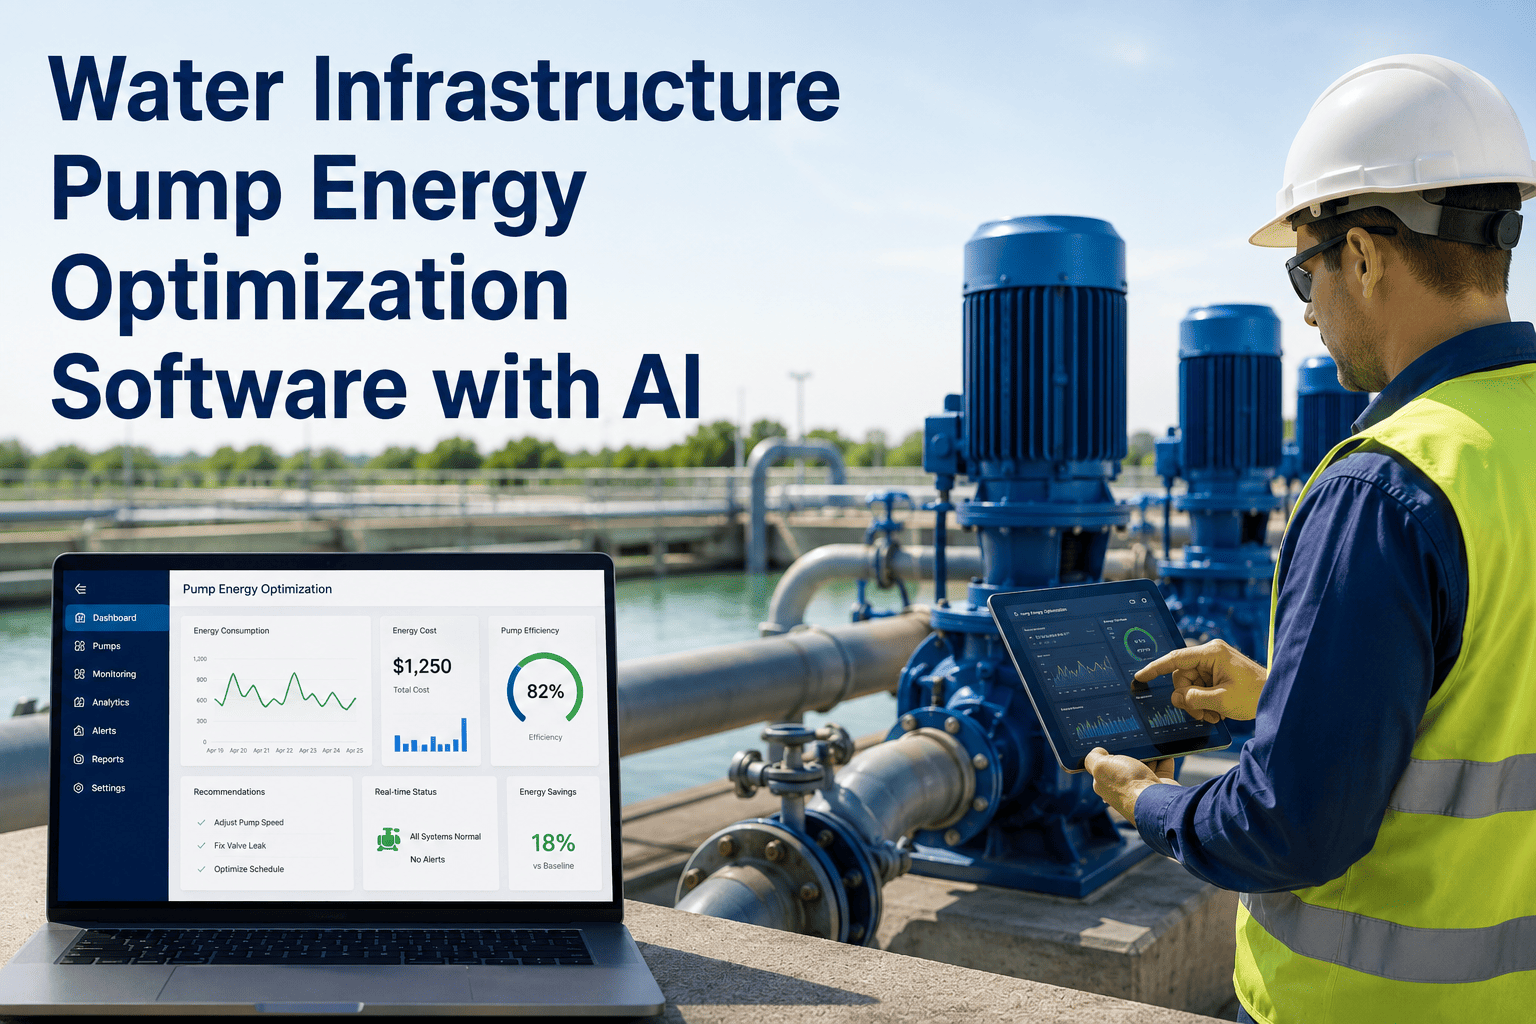
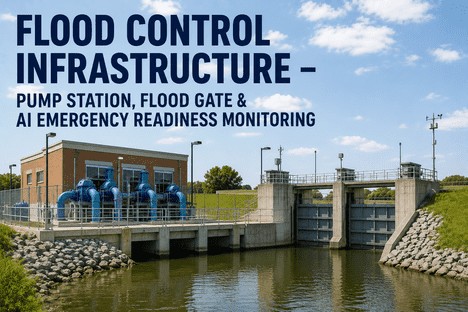
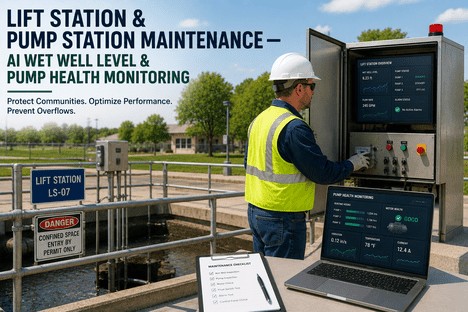
Irrigation & Canal District Infrastructure — Gate, Pump & AI Water Delivery Optimization
By Johnson on August 18, 2026
Most irrigation districts are still running canal networks the way they did fifty years ago — a ditch rider driving the levee road at dawn, a logbook, a radio call if something looks wrong. Only a small fraction of the check gates and pump stations that control water across a typical district are automated in any real sense, which means delivery scheduling, seepage detection, and pump health all depend on someone physically getting there in time. When a lift station fails overnight in a remote reach, the difference between a planned repair and a multi-day navigation or delivery closure often comes down to how early the failure was caught. That is the gap AI-based infrastructure monitoring is built to close, and you can see how it applies to your district by visiting this scheduling link for a working session.
Sub-Vertical · Irrigation & Canal Districts
AI Infrastructure Monitoring for Gates, Pumps, and Water Delivery Scheduling
Give operations teams a live, district-wide view of gate positions, pump station health, embankment condition, and delivery schedules — instead of piecing it together from field radios and end-of-day reports. Built for water districts moving from a handful of automated structures toward a fully connected conveyance system.
Why Most Districts Are Flying Blind Between Field Visits
Canal automation research has repeatedly found that only a small share of check gates and pumps across major agricultural water networks are actually automated, leaving the rest dependent on scheduled rounds and manual readings. That gap is not a technology failure so much as an investment and integration one — the sensors, telemetry, and control logic exist and are proven, but most districts have adopted them one structure at a time rather than as a connected system. The result is a network where a handful of headworks and major pumps get real-time attention while dozens of smaller laterals, check structures, and lift stations are still visited on a fixed rotation regardless of how they are actually performing. Districts that have closed this gap tend to describe it less as a single large capital project and more as a sequence of targeted additions, each one paying for itself in reduced emergency callouts before the next phase begins.
~5%
of major canal check structures and pumps are estimated to be automated today, leaving the large majority under manual operation
48–96 hrs
is the typical window between an undetected pump failure and a forced navigation or delivery closure on canal infrastructure
±10%
is the minimum measurement accuracy required for continuous flow devices under California's Senate Bill 88 reporting rules
7.7 cm
was the mean water-level error achieved by AI image-based gate monitoring in recent field trials, close to manual gauge readings
System View
One Diagram of the Whole Conveyance System
A canal network is not one asset, it is a chain of them — headworks, check gates, lift pumps, embankments, laterals, and turnouts — and a failure anywhere in that chain shows up somewhere else downstream. A gate that drifts out of position affects the water level a downstream pump depends on; a pump that underperforms affects whether a scheduled delivery arrives on time; a slow seepage problem on an embankment can eventually affect the integrity of the whole reach. The diagram below shows how continuous monitoring ties the chain together into a single operating picture instead of a set of disconnected field reports that only get compared once a problem has already surfaced.
How It Works
From Field Sensor to Delivery Decision
The value of monitoring only shows up once it changes what an operator does. iFactory ties raw sensor readings from gates, pumps, and embankments to the same delivery-scheduling logic that dispatch already uses, so a flagged condition turns into a scheduling or maintenance decision rather than another line in a report nobody has time to read. The same pipeline that watches for equipment problems also learns each asset's seasonal rhythm — a lateral that normally spikes in demand every June, a pump that runs warmer during peak irrigation months — so the alerts that do surface are the ones that genuinely fall outside a normal operating pattern, not routine seasonal variation mistaken for a fault.
01
Continuous Field Telemetry
Water level, gate position, pump vibration, flow rate, and embankment moisture readings stream in from existing sensors and low-cost retrofit telemetry, replacing the daily manual round with a live feed that never misses a shift change.
02
Pattern Recognition Against Normal Operating Range
Each asset's readings are compared against its own historical operating range rather than a single fixed threshold, so a pump that runs slightly warmer in summer is not flagged the same way a genuine bearing fault would be.
03
Delivery Schedule Cross-Check
Flagged conditions are checked against the next day's water orders and lateral schedule, so dispatch knows immediately whether a gate anomaly affects a delivery commitment that is already in motion.
04
Work Order or Reschedule, Routed Automatically
High-severity findings generate a maintenance work order and a suggested schedule adjustment together, so field crews and dispatch are working from the same information instead of two separate systems that reconcile a day later, closing the gap between when a condition was detected and when someone actually acted on it.
Coverage
What Continuous Monitoring Actually Tracks
No single sensor type covers every failure mode a canal system presents, which is why a useful monitoring program is built around a portfolio of asset types rather than one device rolled out everywhere. The categories below reflect where districts typically see the fastest return, based on where undetected problems have historically caused the most disruption to delivery schedules and the most expensive emergency repairs.
Headworks and Intake Structures
Water level and debris-screen condition at the point where water enters the system, since a partially blocked intake affects every downstream reach and is often the earliest indicator of a developing supply problem.
Check Gates and Automated Structures
Gate position, actuator health, and upstream and downstream water levels together, so a gate that has drifted out of calibration is caught before it silently under- or over-delivers to the reach it controls.
Pump Stations and Lift Stations
Vibration signature, motor temperature, and flow output on continuously running pumps in remote, often unstaffed locations, where a failure can take days to notice without a live feed and a defined alert threshold.
Embankments and Earthworks
Groundwater pressure at multiple depths and visual imagery for seepage staining or slope movement, tracking the slow-developing conditions that precede the rare but catastrophic failure of an earthen embankment.
Laterals and Turnout Meters
Delivery volume against scheduled water orders at the point where water actually reaches an irrigator, closing the loop between what dispatch scheduled and what was physically delivered.
Structural Assets: Culverts, Weirs, and Aqueducts
Periodic imagery and inspection data for cracking, spalling, corrosion, and vegetation encroachment on the buried and elevated structures that carry water across the network and are easy to overlook between scheduled inspections.
Regulatory Context
What Districts Are Already Expected to Measure and Report
Water measurement and reporting rules have moved from optional good practice to a compliance requirement in many jurisdictions, and canal modernization funding is increasingly tied to demonstrating exactly this kind of automated, continuous measurement rather than periodic manual readings. For districts that divert water above a defined volume threshold, hand-recorded readings taken once or twice a day are no longer sufficient on their own — regulators increasingly expect an unbroken, automatically logged record that can be produced on request, which is difficult to assemble retroactively if the underlying telemetry was never capturing it continuously in the first place.
Requirement
What It Covers
Where AI Monitoring Fits
Continuous Flow Measurement Rules
Diversions above a set volume threshold must use certified, continuously recording flow devices with accuracy at or better than a defined margin
Automated telemetry feeds replace manual spot readings and keep an unbroken accuracy record
Hourly Automated Reporting
Hourly flow rates, total diverted volume, and sensor performance must be reported through remote telemetry rather than logged by hand
The same sensor feed used for anomaly detection satisfies the reporting requirement without duplicate entry
Canal Modernization Grant Criteria
Federal water-efficiency programs tie infrastructure funding to automated gates, SCADA integration, and demonstrated delivery-precision benchmarks
A documented monitoring and control record supports grant applications and compliance audits
Annual Calibration Verification
Measurement instruments must be calibrated on a defined schedule by an approved method, with results retained for inspection
Calibration due dates and drift patterns are tracked automatically alongside the sensor's live readings
See Your District's Data First
Bring Your Own Gate and Pump Layout to the Call
iFactory's solutions team will walk through how monitoring would map onto your specific canal reaches, lift stations, and delivery schedule — not a generic demo, but a look at your actual system and where the first phase would make the most difference.
The difference is less about any single sensor and more about how much earlier a real problem gets caught, and how much less time staff spend confirming that everything else is fine. Districts that have modernized their conveyance systems consistently report the same shift: less time spent driving the levee road to check on assets that turned out to be fine, and more time spent on the handful of structures that actually needed attention that week.
Manual Rounds
Ditch rider checks each gate once or twice per day, more often only if a complaint comes in
Pump problems are usually discovered after a noticeable drop in delivery, not before
Seepage on embankments is caught visually, often after it has already progressed
Flow records are logged by hand and reconciled with delivery orders at the end of the day
Continuous Monitoring
Gate position and water level are read constantly and compared automatically against schedule
Pump vibration and flow trends flag a developing fault days before a failure would occur
Groundwater pressure sensors and imagery catch seepage pathways while they are still minor
Flow and delivery data reconcile automatically, ready for both dispatch and compliance reporting
Field Perspective
“
Every district I've worked with already has more sensor data than they use — flow meters, gate encoders, SCADA logs going back years. What was missing wasn't the data, it was something tying it to the actual delivery schedule so an anomaly at 2am turns into a decision by 6am instead of a surprise by noon. That's the part worth automating first, before adding a single new sensor. Districts that try to solve everything at once, instrumenting every structure in the network in one project, tend to stall out on budget and integration complexity long before they see a return. The ones that succeed usually start with their two or three highest-consequence assets, prove the value there over a season, and let that result make the case for the next phase of the rollout.
Operations Modernization Advisor
15 years in irrigation district infrastructure and SCADA integration
Common Questions
Frequently Asked Questions
Do we need to replace our existing SCADA system to add AI monitoring?
No, in most districts AI monitoring layers on top of the SCADA and telemetry infrastructure already in place rather than replacing it. The existing flow meters, gate position sensors, and radio or cellular telemetry links usually continue feeding data exactly as they do today; what changes is that the readings are also run through pattern recognition against each asset's own history, so a developing pump or gate issue surfaces as an early flag instead of waiting to be noticed during the next manual round. Talk to support about connecting to your current SCADA setup specifically.
How much retrofit sensor hardware does a district actually need to install?
It depends on what is already automated, but many districts start with the highest-consequence assets first — remote pump stations, major check gates, and embankment sections with known seepage history — rather than instrumenting the entire network at once. Low-cost telemetry retrofits on existing gauges and gates can cover a meaningful share of a network without a full automation overhaul, and coverage typically expands in phases as the value of the first phase becomes clear to operations and finance leadership alike. Existing SCADA hardware, flow meters, and gate encoders are generally reused rather than replaced, which keeps the first phase of a rollout closer to an integration project than a capital construction project.
Can this help with Senate Bill 88 and similar continuous measurement reporting requirements?
Continuous flow measurement and hourly automated reporting requirements are exactly the kind of data that a monitoring platform is built to capture and retain, since the same telemetry feed used for anomaly detection also produces the accuracy and reporting record regulators ask for. That said, specific compliance obligations vary by state and by diversion volume, so it is worth confirming your district's exact requirements with your regulatory contact before finalizing a monitoring plan. Calibration due dates, sensor accuracy drift, and historical reporting exports can all be pulled from the same system rather than assembled by hand at audit time. Book a demo to see how the reporting output is structured.
How early can a pump failure actually be caught before it causes a delivery closure?
Vibration and flow trend data can often surface a developing bearing or seal issue days before the pump would actually fail outright, which matters because undetected failures on remote canal pump stations have historically forced navigation or delivery closures within roughly two to four days of the first signs of trouble. Catching the trend early converts an emergency callout into a scheduled maintenance visit, which is both cheaper and far less disruptive to downstream water users. It also gives operations time to line up parts and crew availability in advance, rather than scrambling to source a replacement component after a pump has already gone down.
Does adopting AI monitoring change how much manual field inspection is still needed?
Field inspection does not disappear, but its purpose shifts from routine checking to targeted verification. Instead of a ditch rider visiting every structure on a fixed schedule regardless of condition, crews are directed specifically to the gates, pumps, or embankment sections the system has flagged, while low-risk assets are checked less frequently because their readings have stayed consistently normal. Most districts describe this as spending inspection time on the assets that actually need attention rather than confirming that everything else is still fine, and many find that the total number of field visits drops even as the quality and speed of the response to genuine problems improves.
Stop Finding Out From a Field Radio
See the Whole Canal System in One Dashboard
From headworks to turnout, iFactory ties gate, pump, and embankment monitoring directly to your delivery schedule, so operations knows about a problem before a farmer does. Start with the assets that matter most to your district and expand coverage on your own timeline.