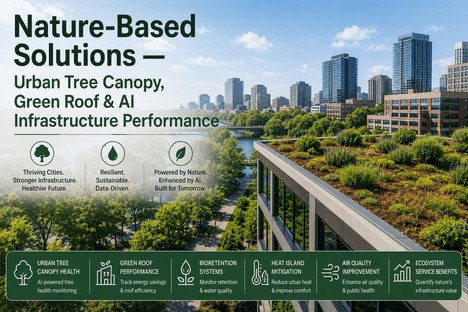
Nature-Based Solutions — Urban Tree Canopy, Green Roof & AI Infrastructure Performance
By Grace on June 27, 2026
Urban trees, green roofs, bioretention systems, and constructed wetlands are no longer experimental amenities. They are infrastructure assets — delivering measurable stormwater management, heat island mitigation, air quality improvement, and carbon sequestration services that cities and infrastructure operators increasingly rely on to meet regulatory compliance, climate resilience targets, and community wellbeing goals. But managing nature-based infrastructure at scale introduces a problem that traditional asset management systems were never designed to solve: how do you monitor the health of 50,000 street trees, measure the stormwater retention performance of 200 green roofs, track the cooling effect of a city-wide tree canopy, and report the ecosystem service benefits to regulators and funders — with the same rigour you apply to grey infrastructure assets? The answer is that most organisations currently cannot. Tree inventories are updated manually every three to five years. Green roof performance is estimated from design specifications rather than measured performance. Ecosystem service benefits are calculated in academic studies, not operational dashboards. iFactory's AI-powered nature-based infrastructure module was built to close this monitoring and management gap.
Nature-Based Solutions · Urban Tree Canopy · Green Roof Monitoring · AI Ecosystem Services · Green Infrastructure
Your City's Trees, Green Roofs, and Bioswales Are Infrastructure Assets. They Should Be Managed Like One.
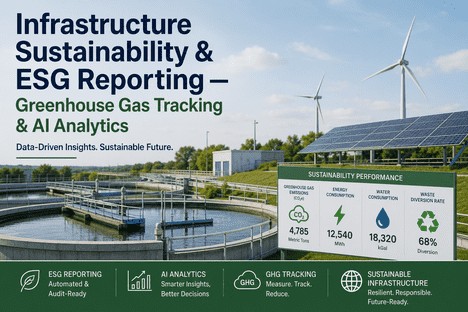
iFactory's nature-based infrastructure module gives operations directors AI-powered monitoring of urban tree canopy health, green roof performance, bioretention system effectiveness, and ecosystem service benefits — with the same asset management rigour applied to grey infrastructure.
Of the world population projected to live in urban areas by 2050 — the demand for nature-based infrastructure to mitigate heat, flooding, and air pollution will intensify with every percentage point of urbanisation
64.5%
Average reduction in extreme heat hours achieved through strategic green infrastructure deployment in urban districts — larger than any engineered cooling alternative at comparable cost
58%
Average annual surface runoff reduction from urban tree canopy expansion and bioswale integration — a volume that would otherwise require millions in grey stormwater infrastructure investment
79%
Of the annual functional benefits provided by urban street trees in a statewide study were attributable to stormwater management alone — a value of approximately USD 30 million across 23 communities
Why Nature-Based Infrastructure Requires a Different Management Approach
The challenge with nature-based assets is not that they deliver less value than traditional grey infrastructure. It is that their performance changes over time as living systems grow, respond to environmental stressors, and interact with their surroundings in ways that engineered assets do not. A tree canopy that provides 30% shade coverage today may provide 45% in ten years or 15% if pests, disease, or development pressure reduces the urban forest. A green roof achieving 60% stormwater retention in its third year of establishment may decline to 40% if substrate compaction, vegetation dieback, or drainage blockage occurs. A bioswale designed to filter runoff from a one-inch storm event may underperform if sediment accumulation reduces infiltration capacity. These are not failure modes that a standard asset management system is configured to detect. They require continuous monitoring, AI-powered change detection, and adaptive management workflows that respond to the dynamic condition of living infrastructure.
Four Distinct Management Challenges That Nature-Based Assets Present — and That Traditional Systems Ignore
The Living Asset Problem
Trees grow, green roofs mature, bioswales settle. Condition changes continuously in ways static registers do not capture.
A conventional asset register records installation date, species or type, and a static condition grade. For nature-based assets, condition is not a snapshot — it is a trajectory. A 75% canopy cover tree with early-stage crown dieback requires different management than the same tree at 90% canopy cover with full vigour, but both may be recorded as "good" in a spreadsheet inventory that is updated once every three years. The performance of nature-based infrastructure degrades gradually, then suddenly — and without continuous monitoring, the inflection point from healthy to declining is invisible until the asset requires expensive remediation or replacement.
Green assets produce measurable benefits. Most organisations have no operational system to quantify them.
The business case for nature-based infrastructure rests on ecosystem service benefits — stormwater retention, heat island reduction, carbon sequestration, air quality improvement. Yet most infrastructure operators cannot answer the question that funders and regulators increasingly ask: what ecosystem service benefit did your green infrastructure portfolio deliver this year, and how does that compare to last year? The data required to answer that question — tree canopy cover change, green roof retention rates, bioswale infiltration performance, pollutant removal efficiency — is either not collected, collected manually at intervals too infrequent to detect trends, or calculated using generic models that do not reflect actual asset condition. An operations director cannot optimise a portfolio whose benefits they cannot measure.
Unmeasured Benefits + Untracked Performance = Weak Investment Case
The Green-Grey Integration Gap
Nature-based and engineered assets are managed in separate systems. Their combined performance is invisible.
Most infrastructure portfolios operate green and grey assets in the same catchment, site, or corridor — yet manage them in completely separate systems. The stormwater engineer tracks pipe capacity, pump station performance, and treatment plant throughput in the asset management system. The urban forestry team tracks tree planting, canopy cover, and green roof inspections in a separate database or spreadsheet. Neither system can answer the question that matters most: how is the combined green-grey system performing relative to its design objectives? When a flood event exceeds pipe capacity, did the tree canopy and bioswale network provide the stormwater retention that the design assumed? Without an integrated management platform that treats both asset classes in the same operational view, this question remains unanswered until the next flood study.
Separate Systems + No Combined View = Suboptimal Catchment Performance
The Resilience Reporting Requirement
ISB, TCFD, and GRESB now require climate resilience data. Nature-based asset performance data is a key input.
Climate resilience disclosure under ISSB S2 and TCFD requires infrastructure operators to report on climate adaptation measures and their effectiveness. Nature-based solutions are increasingly recognised as a core adaptation strategy, but reporting their effectiveness requires quantified performance data — canopy cover change rates, green roof survival and performance rates, stormwater retention volumes, urban heat island temperature differentials. Without an operational system that collects, analyses, and reports nature-based asset performance data in the formats that ESG frameworks require, infrastructure operators cannot substantiate their adaptation claims with the evidence that auditors and rating agencies demand.
Adaptation Claims + No Performance Evidence = Disclosure Risk
Urban Tree Canopy · Green Roof Monitoring · Bioretention · Ecosystem Services · AI Assessment
When a Tree Is Infrastructure, Its Health, Growth, and Ecosystem Service Contribution Must Be Tracked Like Any Other Asset.
iFactory's nature-based solutions module applies AI-powered monitoring, satellite imagery analysis, IoT sensor integration, and ecosystem service modeling to every green asset in your portfolio — delivering quantified performance data with the same rigour your grey assets receive.
Quantified Ecosystem Service Benefits: What Nature-Based Infrastructure Delivers — and How iFactory Measures It
The argument for investing in nature-based infrastructure has moved from qualitative to quantitative. Regulators, funders, and communities now expect measured performance data for every category of ecosystem service benefit. iFactory's AI engine ingests satellite imagery, IoT sensor data, weather station feeds, and LiDAR surveys to calculate, track, and report the ecosystem service performance of every green asset in the portfolio — in formats that support capital planning, ESG disclosure, and regulatory compliance.
iFactory calculates stormwater retention volumes for tree canopy, green roofs, and bioretention systems using site-specific rainfall data, canopy interception models, and IoT soil moisture sensor inputs. The platform tracks annual runoff reduction per asset and aggregates to catchment-level performance metrics that inform combined green-grey system optimisation. Data is exportable for stormwater management program reporting, regulatory compliance submissions, and green infrastructure performance bonds.
AI Inputs: Rainfall data, canopy cover analysis, soil moisture sensors, LiDAR-derived leaf area index
Urban Heat Island Mitigation
Canopy shade coverage, evapotranspiration cooling, surface temperature reduction
The platform models urban heat island mitigation using land surface temperature data from satellite thermal bands, canopy shade coverage analysis from LiDAR and multispectral imagery, and evapotranspiration rates from weather station and IoT sensor inputs. iFactory generates district-level temperature differential reports showing the cooling contribution of existing tree canopy and green roof assets, and simulates the additional cooling benefit of proposed planting programmes to support investment targeting for maximum heat mitigation impact per dollar spent.
AI Inputs: Landsat thermal data, multispectral imagery, weather station data, IoT temperature sensors
Carbon Sequestration and Air Quality
CO2 absorption, PM2.5 and NO2 filtration, oxygen production
iFactory calculates annual carbon sequestration per tree and per green roof area using species-specific allometric equations, canopy volume estimates from LiDAR and satellite imagery, and growth rate projections calibrated to local climate conditions. Air quality improvement is modelled using pollutant concentration data from monitoring stations, canopy cover density, and deposition velocity rates by pollutant type. The platform generates carbon and air quality benefit reports that support carbon accounting, sustainability disclosure, and health impact assessments for community benefit reporting.
AI Inputs: LiDAR canopy volume, species inventory, air quality monitoring data, growth models
How iFactory Monitors and Manages Each Nature-Based Asset Type
Different nature-based asset types require different monitoring technologies, performance metrics, and management workflows. iFactory's AI platform is configured to handle the specific characteristics of each green asset class — from urban tree canopy to green roofs to bioretention systems — within a single integrated management environment.
Asset Type 01
Urban Tree Canopy — AI-Powered Health Assessment, Growth Tracking, and Canopy Cover Analysis
Living Asset Intelligence
iFactory ingests high-resolution satellite imagery, aerial LiDAR data, and street-level mobile sensing feeds to build a continuously updated digital inventory of every tree in the infrastructure portfolio. The AI engine applies deep learning models trained on multispectral and thermal imagery to assess individual tree health, detect early signs of pest infestation, water stress, and disease, and calculate canopy cover metrics at the asset, street, neighbourhood, and portfolio levels. Growth rates are tracked against species-specific benchmarks calibrated to local climate and soil conditions, enabling the platform to project future canopy cover under different management scenarios. When a tree's health score drops below a configurable threshold, the platform generates a work order for arborist inspection and intervention — closing the loop between remote sensing and field operations that currently relies on manual inspection cycles of three to five years.
AI health scoring from satellite and LiDAR data
Growth rate tracking and canopy projection
Threshold-based arborist work order generation
Asset Type 02
Green Roofs and Vegetated Surfaces — Real-Time Performance Monitoring and Vegetation Condition Tracking
Vertical Green Infrastructure
iFactory connects to IoT soil moisture sensors, drainage flow meters, and weather station data installed on green roofs and vegetated surfaces to track stormwater retention performance, vegetation health, and irrigation requirements in real time. The AI engine analyses vegetation cover from multispectral satellite and drone imagery, calculates the Normalised Difference Vegetation Index trend for each roof section, and detects vegetation dieback or weed colonisation before it is visible during manual inspections. When retention performance falls below design specifications or vegetation cover declines below a configurable threshold, the platform generates an intervention alert with a recommended maintenance action — fertilisation, irrigation adjustment, replanting, or drainage inspection. Performance data is aggregated to portfolio level for capital planning, warranty compliance, and ecosystem service benefit reporting.
IoT sensor-driven retention performance tracking
NDVI vegetation health monitoring from satellite
Automated maintenance intervention alerts
Asset Type 03
Bioretention Systems and Bioswales — Infiltration Performance, Sediment Accumulation, and Pollutant Removal Tracking
Green-Grey Hybrid
iFactory monitors bioretention system performance through IoT water level sensors, inflow and outflow metering, and soil moisture probes integrated into the platform. The AI engine calculates infiltration rates, hydraulic retention times, and pollutant removal efficiency using continuous sensor data and periodic water quality sampling results logged in the platform. Sediment accumulation in the forebay and filter media is tracked through a combination of sensor data and inspection records, with the platform predicting when maintenance intervention — sediment removal, media replacement, or vegetation management — will be required based on accumulation rates and design specifications. When a bioswale's infiltration rate drops below design performance, the platform generates a maintenance work order and adjusts the stormwater retention credit claim for the affected catchment.
Continuous infiltration rate monitoring
Sediment accumulation prediction alerts
Pollutant removal efficiency tracking
"
Our city had invested over forty million dollars in green infrastructure over six years — trees, green roofs, bioswales, rain gardens. When the city council asked for the quantified benefits of that investment, we could show them planting numbers and inspection records, but we could not tell them how much stormwater the tree canopy retained last year, what the urban heat island reduction was in the districts where we planted the most trees, or how the green roof portfolio performed against design specifications. The first time we ran iFactory's AI canopy analysis across the entire city, we generated more ecosystem service performance data in one week than we had produced manually in the previous five years. That data changed the conversation from whether green infrastructure was worth the investment to where the next tranche of funding should be deployed for maximum impact.
— Operations Director, Urban Green Infrastructure Programme — 18 Years Public Infrastructure Management
Conclusion
Nature-based infrastructure is no longer a pilot programme or a community amenity. It is a core component of urban resilience strategy, stormwater management planning, climate adaptation investment, and ESG disclosure — and it demands the same management rigour that infrastructure operators apply to their grey assets. The technology to monitor tree health from space, track green roof performance through IoT sensors, model bioswale infiltration rates in real time, and quantify ecosystem service benefits at portfolio scale exists today. The gap is not in the technology. It is in the management platform that connects it.
iFactory's AI-powered nature-based infrastructure module gives operations directors the platform to monitor urban tree canopy health, green roof performance, bioretention system effectiveness, and ecosystem service benefits across every green asset in the portfolio — with AI-driven satellite analysis, IoT sensor integration, automated condition assessment, and quantified benefit reporting that supports capital planning, regulatory compliance, and climate resilience disclosure. Book a Demo to see how the platform maps to your green infrastructure portfolio, or talk to an expert about configuring AI-powered nature-based asset monitoring for your organisation's specific green asset mix and reporting requirements.
Frequently Asked Questions
iFactory integrates data from multiple remote sensing and ground-based sources to build a comprehensive urban forest monitoring capability. High-resolution multispectral satellite imagery from platforms including WorldView, Sentinel-2, and Planet provides regular canopy cover assessment and vegetation health indices. Aerial LiDAR surveys, conducted annually or biennially depending on portfolio size, deliver precise tree height, crown diameter, and canopy volume measurements. Street-level mobile sensing data can be integrated from municipal vehicles or service fleet drives to capture trunk diameter, low-branch height, and visible condition indicators at curb level. For organisations with existing tree inventory databases, iFactory imports and reconciles existing records with remote sensing data to build a continuously updated digital forest inventory. The AI engine fuses these data sources to generate individual tree health scores, canopy cover metrics, growth rate projections, and early warning alerts for pest, disease, and water stress detection. Book a Demo to see a live urban forest monitoring dashboard configured for a sample city portfolio.
iFactory calculates ecosystem service benefits using established peer-reviewed models calibrated to local climate, species, and site conditions. Stormwater retention is modelled using the i-Tree HydroPlus framework, which combines rainfall data, canopy interception rates derived from LiDAR leaf area index measurements, soil infiltration rates from IoT sensor data, and surface imperviousness from GIS layers. Urban heat island mitigation is assessed using land surface temperature data from satellite thermal bands combined with canopy shade coverage analysis, evapotranspiration rates from weather station data, and surface albedo measurements for green roof areas. Carbon sequestration is calculated using species-specific allometric equations from the US Forest Service and IPCC guidelines, with growth rates calibrated to local conditions using tree-ring increment data or repeat LiDAR measurements. Each benefit calculation is documented with methodology references, data sources, and confidence intervals in the platform's audit trail — ensuring that ecosystem service benefit claims are defensible in regulatory and funding contexts. Talk to an expert to discuss the ecosystem service modelling framework for your specific green infrastructure portfolio.
Yes. iFactory is designed as a unified infrastructure management platform that treats green and grey assets within the same operational environment. The platform maintains a single asset register where both nature-based assets and traditional engineered assets are registered with their respective attribute schemas, performance metrics, and management workflows. Stormwater infrastructure performance data — pipe flow, pump station operation, treatment plant throughput — is ingested from existing SCADA and CMMS systems alongside green infrastructure performance data from IoT sensors, satellite imagery, and field inspections. The combined green-grey view enables operations directors to assess catchment-level performance, model the impact of green asset degradation on grey system demand, and optimise maintenance and capital investment across the full infrastructure portfolio. This integration is critical for infrastructure operators who need to demonstrate how their nature-based investments are reducing the load on grey systems and extending the service life of engineered assets. Book a Demo to see the green-grey integration architecture configured for a sample catchment.
iFactory's nature-based infrastructure module generates quantified performance data that directly supports disclosure under ISSB S2 climate resilience requirements, TCFD adaptation measures reporting, GRESB Infrastructure green building and nature-based solutions indicators, and CDP climate change adaptation and biodiversity disclosures. The platform produces standardised reports showing tree canopy coverage change year-on-year, green roof performance against design specifications, stormwater retention volumes by catchment, urban heat island temperature differentials by district, and carbon sequestration totals by asset class. Each report includes the data sources, calculation methodology, and confidence level for each metric, providing the audit trail that assurance providers and rating agencies require. For organisations subject to the EU Nature Restoration Law, the platform supports no-net-loss and net-gain reporting for urban green space and tree canopy cover with compliance-ready outputs. Talk to an expert to review the disclosure outputs applicable to your regulatory and investor reporting obligations.
iFactory's nature-based infrastructure module deployment follows a phased sequence designed to deliver early visibility while building towards full capability. Weeks one to two cover green asset inventory compilation, satellite imagery procurement specification, and IoT sensor deployment planning for green roofs and bioswales. Weeks three to four focus on AI model calibration for tree canopy health assessment and ecosystem service calculation, using existing LiDAR or satellite data where available. Weeks five to six cover IoT sensor installation and platform integration for green roof drainage and soil moisture monitoring. Weeks seven to eight are dedicated to dashboard configuration, ecosystem service benefit reporting templates, and integration with existing grey infrastructure asset systems. The first urban forest health assessment and canopy cover report is typically available within thirty days using satellite imagery analysis. Full IoT-enabled bioswale and green roof performance monitoring is operational within eight weeks. The complete green-grey integrated management view with combined catchment-level performance reporting is delivered within twelve weeks. Book a Demo to build the implementation plan specific to your green infrastructure portfolio size, asset types, and current monitoring capability.
Your Green Infrastructure Already Delivers Measurable Benefits. The Only Question Is Whether You Can Quantify Them.
iFactory's AI-powered nature-based solutions module — urban tree canopy health monitoring, green roof performance tracking, bioretention system management, and quantified ecosystem service benefits. The management platform your green infrastructure portfolio needs to prove its value.