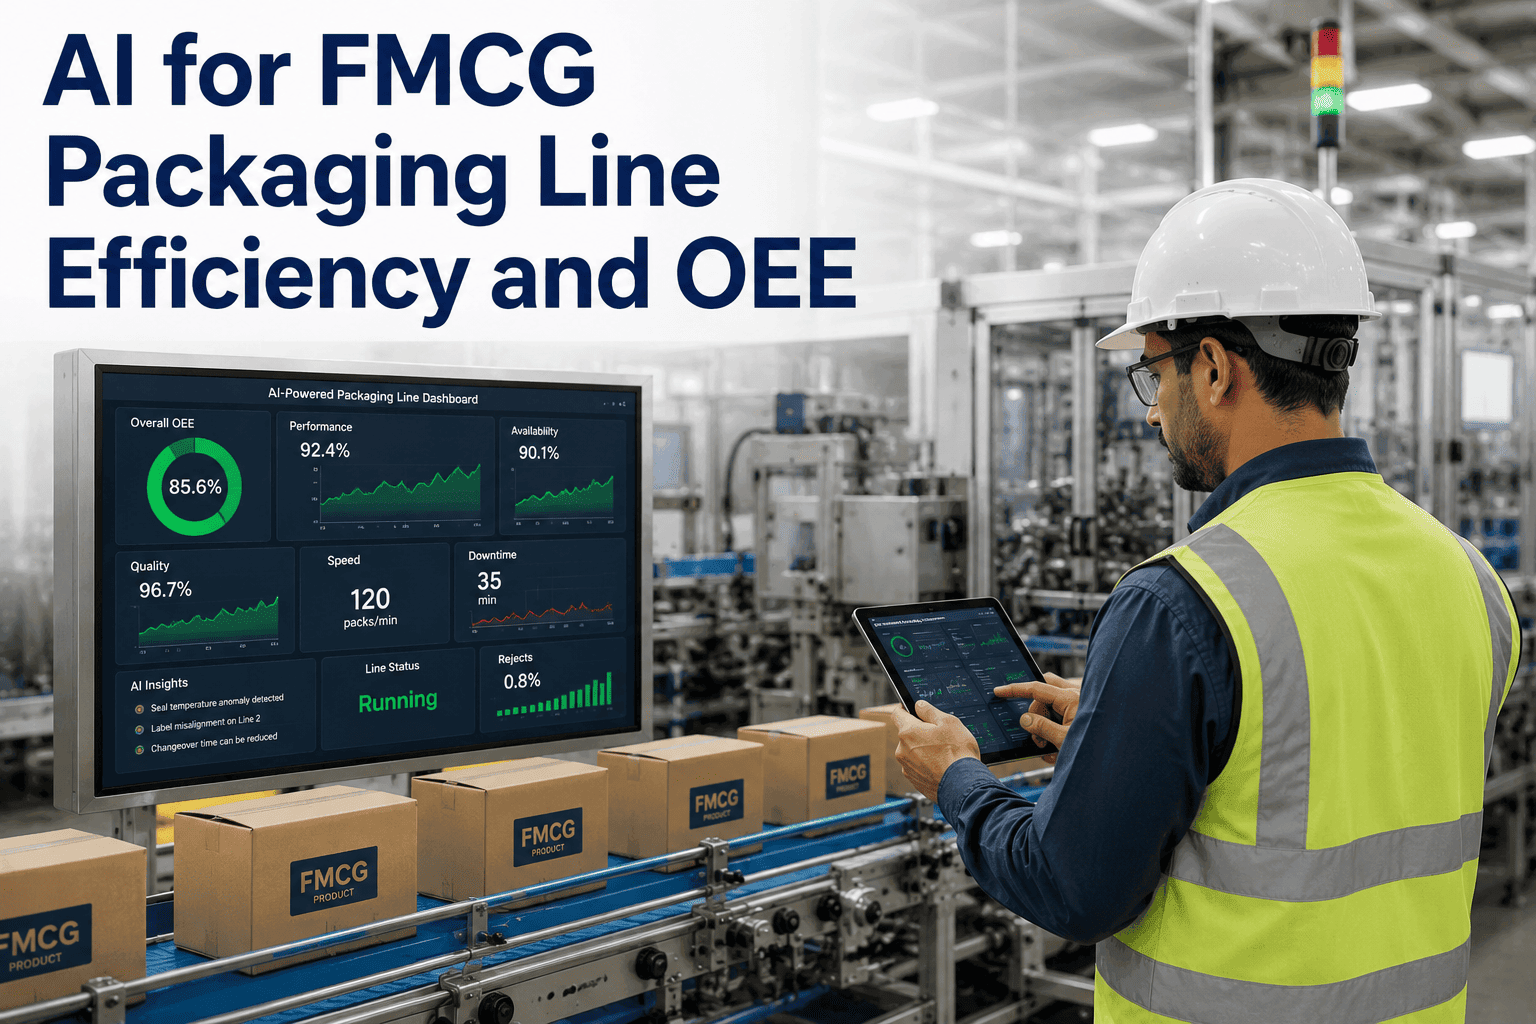
A packaging line running at the industry-average 60% OEE loses close to ten hours of productive capacity every single day to jams, micro-stops, and SKU changeovers that never show up as a single big failure. Plant managers chase the loss line by line, shift by shift, and rarely find one root cause because there isn't one — it's forty small stoppages hiding inside a shift report. The lines that break 70-75% OEE do it by catching those forty stoppages individually, in real time, which is exactly the kind of pattern recognition that AI-driven line monitoring was built for.
FMCG & CPG Packaging Intelligence
Why Your Packaging Line Loses 40% of Its Capacity Before Anyone Notices
High-speed FMCG lines don't fail loudly. They bleed minutes through micro-stops, slow changeovers, and speed loss that never reaches the maintenance log — until AI starts counting every second.
60-75%
Typical FMCG line OEE
82%+
World-class benchmark
40x
Micro-jams possible per shift
The Loss Hiding Inside Every Shift Report
Ask a line operator why the shift finished short and they'll usually point to one visible event — a jam, a changeover that ran long, a quality hold. What they rarely see is the accumulation underneath: dozens of stoppages under thirty seconds each that a manual log simply cannot capture at that resolution. On a high-speed filling or wrapping line, a jam that clears in twenty seconds can recur forty times in a single shift, and forty times twenty seconds is more than thirteen minutes of dead machine time that never appears as a distinct line item anywhere.
01
Micro-Stoppages
Sub-minute jams and sensor faults on fillers, labellers, and cartoners that accumulate into the single largest OEE loss category on high-speed lines, almost entirely invisible to manual tracking.
02
Changeover Drag
Time between the last good pack of one SKU and the first good pack of the next, inflated by tooling searches, manual settings entry, and inconsistent operator technique across shifts.
03
Speed Loss
Machines quietly running below rated cycle time because nobody is watching the gap between actual and ideal speed second by second across an eight-hour shift.
04
Quality Rejects
Fill weight drift, seal defects, and label misapplication caught late at end-of-line inspection rather than at the point where the drift actually began.
What World-Class Lines Do Differently
The gap between a 60% line and an 82% line is not a different machine — it is almost always the same equipment operated with better visibility. World-class FMCG plants instrument every stoppage down to the second, calculate performance rate against the correct ideal cycle time for each SKU format, and treat changeover as a measured, trended number rather than a category buried inside "planned downtime." AI closes that visibility gap automatically, watching every machine in the line cascade and surfacing the three to five root causes generating the bulk of stoppages without anyone needing to review a shift log by hand.
OEE Distribution Across FMCG Packaging Lines
Reactive, manual-log lines
60-68%
Sensor-monitored lines
70-76%
AI-monitored, root-cause-driven lines
82-88%
A single line moving from 60% to 75% OEE on a line valued at $5,000 per production hour represents roughly $1.2M in recovered annual output — before counting the compounding effect across a multi-line facility.
Inside a Changeover: Where the Minutes Actually Go
Changeover is the loss category plant managers understand best and control least. Every SKU switch on a packaging line involves the same sequence of physical and digital steps, and the gap between a top-quartile changeover and a median one is almost always concentrated in two or three of these steps rather than spread evenly across all of them.
Last Good Pack
Line stops production of the outgoing SKU. AI timestamps this moment automatically rather than relying on an operator's manual entry.
Tooling & Format Change
Physical changeguides, mandrels, and format parts are swapped. This is where trained AI vision guides can flag missing or mismatched components before restart.
Parameter Reload
Recipe parameters for the new SKU load automatically from the correct cycle-time database rather than being keyed in by hand under time pressure.
First Good Pack
AI confirms the new SKU is running to spec and closes the changeover clock — the number that gets trended for the next SMED review.
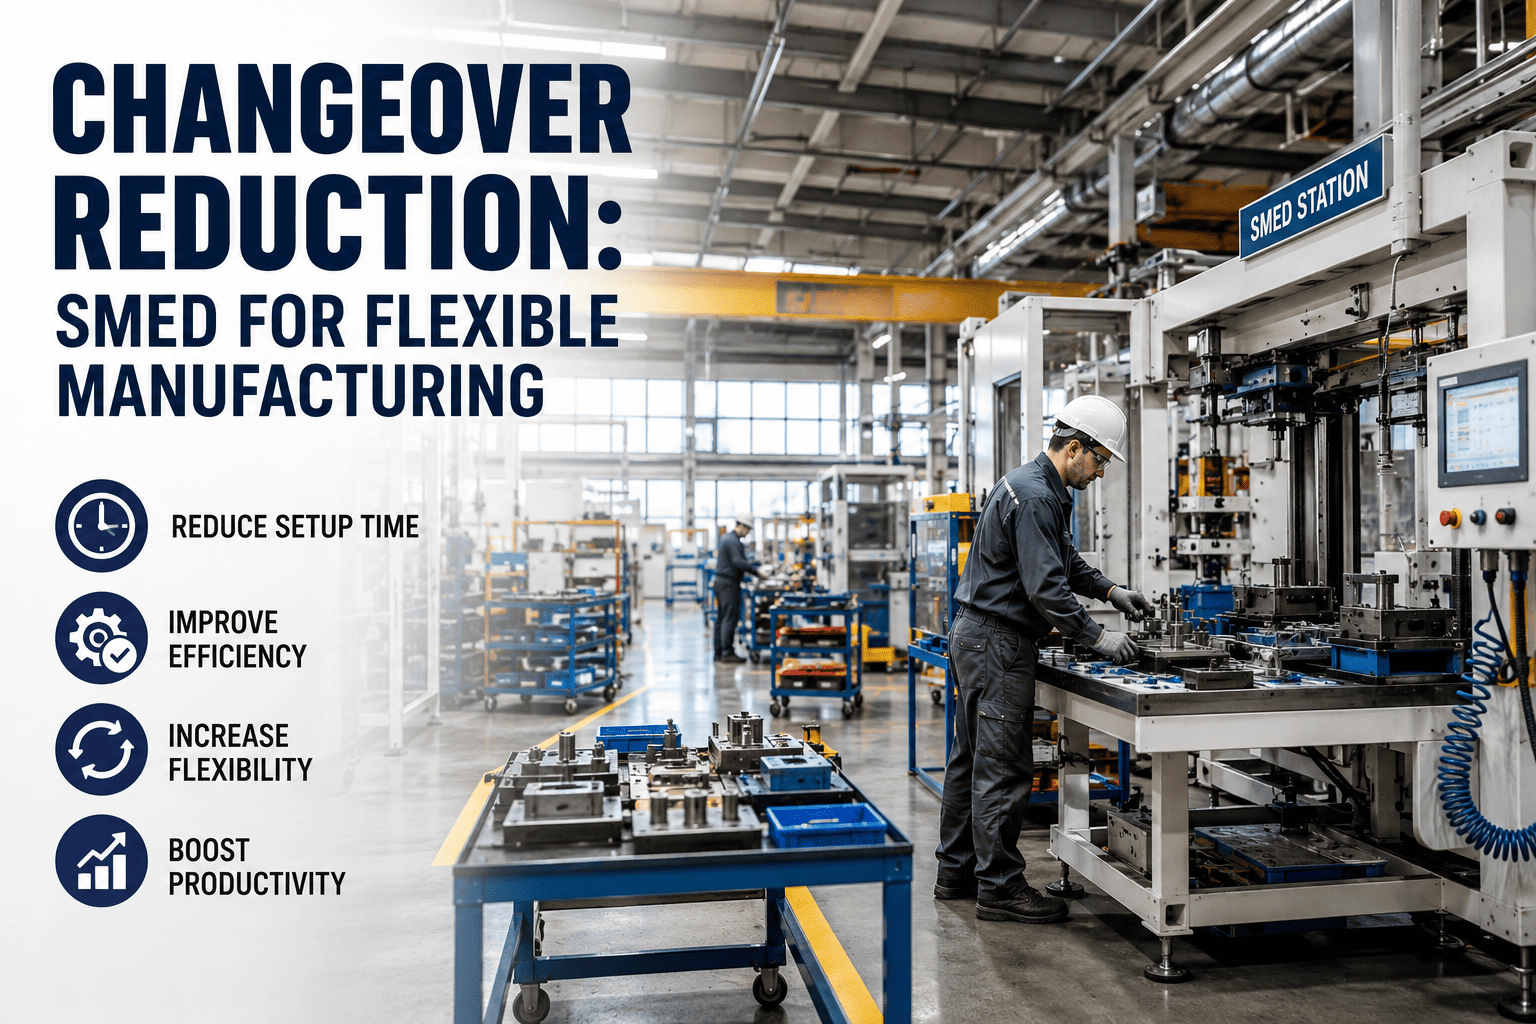
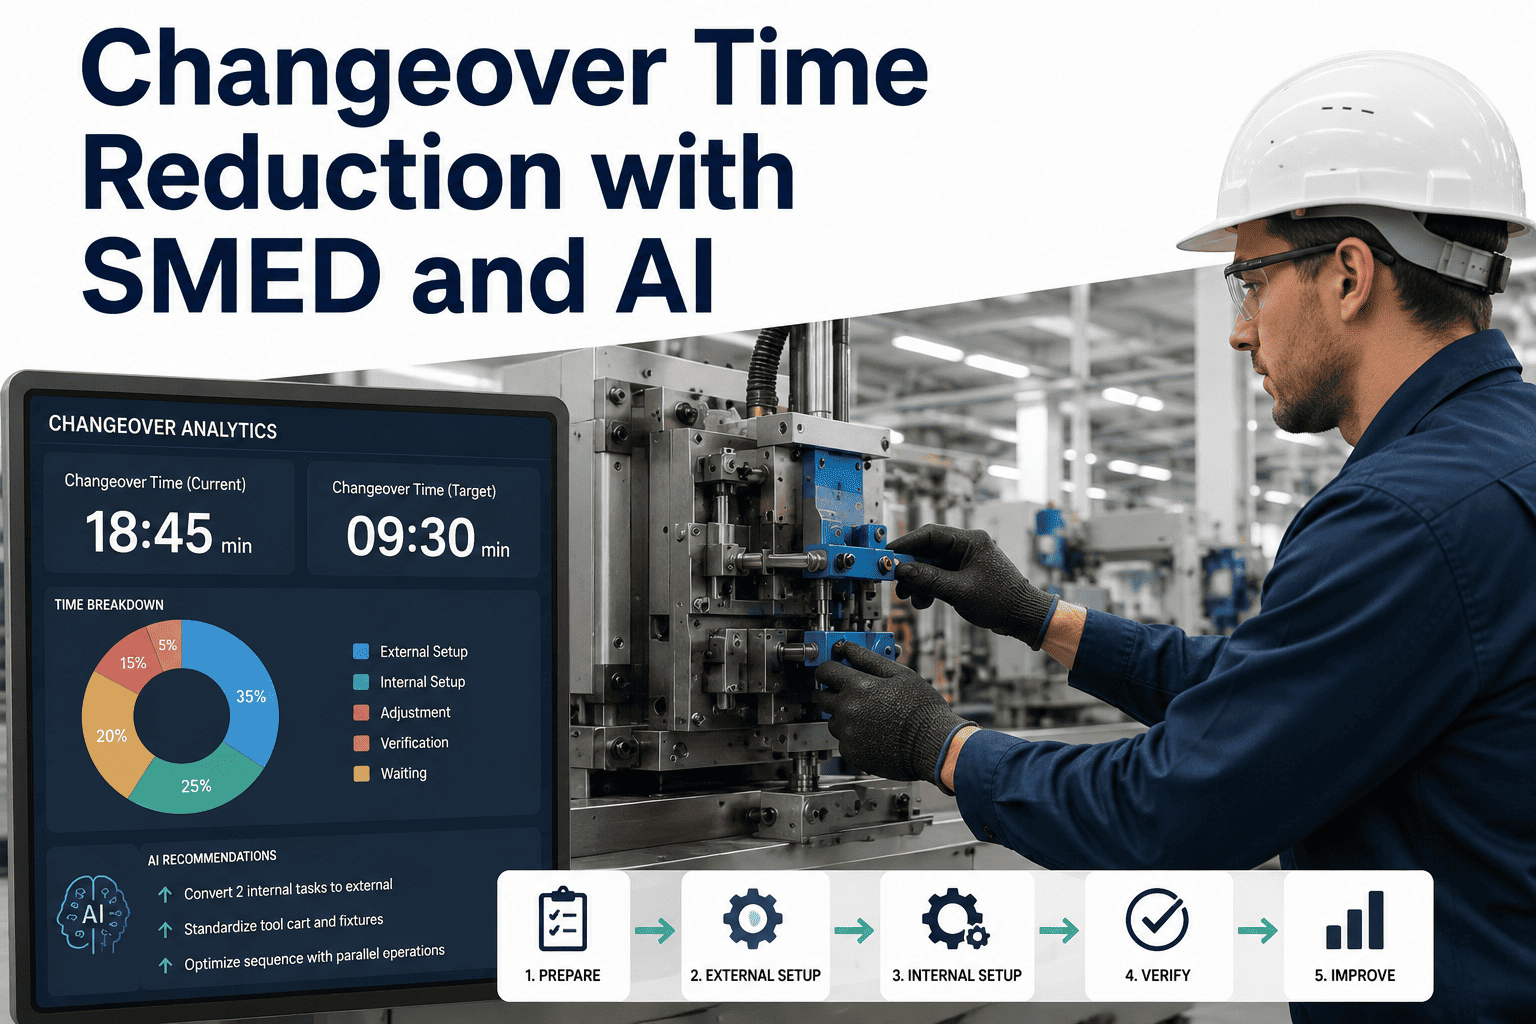
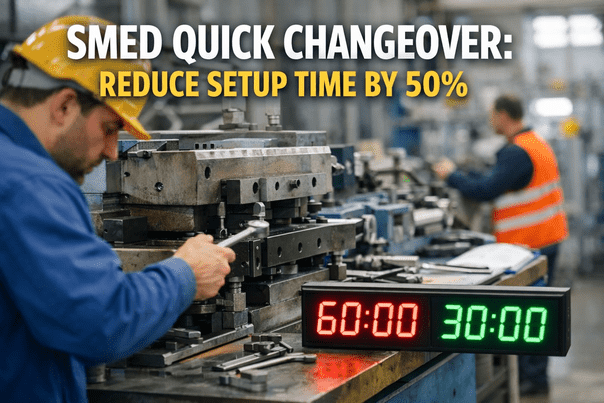
The pattern holds across formats and package types: the physical tooling swap rarely explains the full gap between a top-quartile and a median changeover. More often it is the steps around the physical work — walking to a parts cage, searching for the right cycle-time setting, waiting on a second operator to confirm a setup — that eat the extra minutes. SMED programs succeed when they separate what can happen while the line is still running the old SKU from what genuinely has to wait until the line stops, and AI-timestamped changeover data is what makes that separation measurable instead of anecdotal.
Every minute of changeover drag and every uncounted micro-stop is production capacity you already paid for and never got to use. See what your own line's loss breakdown looks like with a live walkthrough of AI-driven OEE monitoring on your data.
Book a 30-minute demo and bring last month's downtime log.
Where AI Fits Across the Packaging Line
AI does not replace the SCADA and PLC layer already running your line — it sits above it, correlating signals that were always being generated but never connected. The result is a system that watches vision, sensor, and machine-state data together and tells operators what is actually causing the loss rather than just reporting that a loss occurred.
Micro-Stop Root Cause
Correlates every sub-minute stoppage against machine state, SKU, shift, and operator to surface the handful of causes generating most of the lost time.
Vision-Based Quality
Cameras at fill, seal, and label stations catch defect drift a shift before it would trip a manual quality hold, cutting scrap and rework.
Per-SKU Cycle Tracking
Performance rate calculated against the correct ideal cycle time for every product format instead of one blended line average that hides real losses.
Changeover Trending
Automatic last-pack-to-first-pack timing feeds directly into SMED prioritization instead of a manually logged, easily disputed number.
Where the Losses Concentrate by Line Type
Not every machine on the line loses time the same way, and lumping the whole line into one OEE number hides which station actually needs attention first. Breaking the analysis down by machine type shows a consistent pattern across most FMCG facilities: fillers and labellers account for the majority of micro-stops, while cartoners and case packers carry more of the changeover burden.
Fillers
Highest micro-stop frequency on most lines, driven by nozzle drips, foam sensing errors, and container jams. AI vision at the filler head catches fill-weight drift before it produces an out-of-spec batch.
Labellers
Web breaks, splice failures, and misapplication account for a large share of quality-related stops. Splice-time tracking by operator turns a training gap into a coaching opportunity instead of a recurring mystery.
Cartoners and Case Packers
These stations carry the heaviest changeover load since format parts, glue settings, and carton blanks all change with the SKU. AI-guided setup checklists reduce the tooling-search time that dominates a manual changeover.
End-of-Line Inspection
Vision systems at the reject station now do more than pass or fail a pack — they track defect drift across a shift and flag a developing problem before it produces a reject spike.
What a Ten-Point OEE Gap Actually Costs Over a Year
It's easy to treat OEE as an abstract efficiency score, but the dollar figure behind it is concrete and compounding. A single line stuck at 60% OEE against a realistic 75% target isn't losing "some capacity" — it's losing roughly a quarter of its theoretical output, every day, for as long as the visibility gap persists. Multiply that across a facility running six or more lines and the number stops being a rounding error in the annual budget and starts being one of the largest addressable line items a plant manager controls.
$36,000
Daily revenue at risk on a single line stuck at 60% OEE versus 85% world-class, at $5,000/hour production value
$13.1M
Annual value of that same daily gap left unaddressed on one line for a full year
$8-15M
Typical annual opportunity identified across a multi-line FMCG facility once root causes are prioritized
70-80%
Share of unplanned downtime events that systematic, data-driven maintenance can eliminate before they occur
How a Rollout Actually Unfolds
Plant teams considering AI-driven OEE monitoring usually want to know one thing first: how disruptive is this going to be to a line that's already running production every shift. The honest answer is that a well-run rollout adds monitoring in parallel to existing operations rather than requiring a line stoppage, and the phased structure below is how most FMCG facilities move from first connection to measurable OEE gain.
1
Connect & Baseline
Existing PLC, sensor, and vision data streams are connected without touching line operations, and the model begins learning normal versus abnormal behavior across a few weeks of production.
2
First Root-Cause Findings
The platform surfaces the three to five causes generating most micro-stops on each line, giving maintenance and engineering teams a prioritized, evidence-backed list instead of a hunch.
3
Targeted Fixes
Maintenance and changeover improvements are applied against the ranked findings, and the platform tracks whether each fix actually moved the OEE needle before the next priority is tackled.
4
Facility-Wide Scaling
Patterns validated on the first line are checked against similar equipment elsewhere in the facility, so a fix found once doesn't have to be rediscovered line by line.
Frequently Asked Questions
How is this different from the OEE dashboard our line already has?
Most existing OEE dashboards report totals — availability, performance, and quality percentages calculated at the end of a shift from PLC counters. What they typically cannot do is explain why those numbers landed where they did or which of the dozens of contributing stoppages mattered most. AI-driven monitoring adds a root-cause layer on top of the same underlying signals, clustering micro-stops by cause, machine, SKU, and operator so the line team gets a ranked list of what to fix first rather than a single aggregate score. It is complementary to your existing dashboard, not a replacement for it.
See it running against a real shift's data in a demo.
Do we need new sensors or can this work with our current PLCs?
In most FMCG plants, the packaging line already generates far more signal than gets used — PLC counters, servo drive data, and existing sensors typically provide enough resolution to start. The AI platform connects to that existing data layer first, and additional lightweight IoT sensors or cameras are only recommended where a specific blind spot is identified, such as a machine with no digital stop-cause logging today. Most deployments start with the data already available and add hardware selectively rather than as a blanket requirement.
Ask our team to review your current instrumentation.
How long does it take to see a measurable OEE improvement?
Facilities typically see the first actionable root-cause findings within two to four weeks of connecting the platform, since the model needs enough production cycles to distinguish a recurring pattern from a one-off event. Measurable OEE improvement — driven by the maintenance and changeover fixes those findings enable — usually follows within the next one to two quarters as the highest-impact causes get addressed first. Packaging sector deployments have reported OEE gains in the range of 20 to 30 points over twelve months when root-cause findings are consistently acted on by the line team.
Can this handle a facility running six or more lines with different formats?
Yes — multi-line, multi-format facilities are where the aggregate savings are largest, since the same root-cause patterns often repeat across lines running similar equipment. The platform tracks each line and each SKU format independently against its correct ideal cycle time, then rolls findings up to a facility-level view so plant management can compare lines against each other and prioritize capital or maintenance spend where it will move the most output. Multi-line facilities have reported $8-15M in annual OEE-driven opportunity once findings are prioritized and acted on.
Walk through a multi-line rollout plan with us.
Does faster changeover come at the cost of more quality risk during SKU switches?
The opposite is typically true. Rushed manual changeovers are a common source of the fill weight and seal quality issues that show up in the first few minutes of a new SKU run, because operators are working under time pressure with manually entered parameters. AI-guided changeover reduces that risk by auto-loading verified recipe parameters and confirming first-good-pack quality before the changeover clock closes, which tends to reduce both changeover time and the early-run quality holds that follow a rushed switch.
Stop Losing Capacity You Already Paid For
See Your Own Line's Hidden Loss Breakdown in 30 Minutes
Bring a month of downtime logs from any packaging line. We'll run the root-cause analysis live and show exactly where your OEE points are hiding — no new hardware required to start the conversation.