How to Reduce Changeover Time by 50% with SMED and Cobot-Assisted Automation
By Ethan Walker on May 20, 2026
Changeover time — the minutes lost between the last good unit of one production run and the first good unit of the next — is one of the most underestimated drains on manufacturing OEE. For most discrete and process manufacturers, setup and format-change windows consume 15–40% of available production time. SMED (Single-Minute Exchange of Die), first formalized by Shigeo Shingo, offered the original playbook for compressing that window. Cobot-assisted automation is the 2026 execution layer that finally makes 50%+ reductions achievable at scale — without the capital intensity of hard automation and without retraining entire workforces. This guide walks U.S. manufacturing operations teams through the combined methodology, the implementation sequence, and the measurement framework that proves ROI.
OEE & Production Efficiency — 2026
How to Reduce Changeover Time by 50% with SMED and Cobot-Assisted Automation
A field-tested methodology for discrete and process manufacturers targeting measurable setup time reduction
40%
Avg. Production Time Lost to Changeover
50%+
Changeover Reduction — SMED + Cobot
$220K
Avg. Annual OEE Recovery Per Line
8 mo
Typical ROI Payback Period
Why Changeover Time Is the Hidden OEE Killer
Most manufacturers track uptime, throughput, and defect rates. Far fewer track changeover with the same rigor — which means the loss stays invisible in aggregate OEE dashboards until someone does the math. A packaging line running three format changes per shift at 22 minutes each is burning 66 minutes of capacity before the first unit rolls. At $1,800 per hour of throughput, that is $1,980 in lost output per shift, or roughly $1.4 million annually on a single line running two-shift operations.
The challenge is structural: changeover involves a blend of physical tasks (tool swaps, fixture adjustments, material loading), cognitive tasks (recipe selection, parameter entry, first-article inspection), and coordination tasks (staging, handoffs, sign-offs). Traditional SMED addresses the physical and coordination layers well. It has historically left the cognitive layer — particularly parameter-heavy format changes in process manufacturing — as the residual time sink that resists further reduction. Cobots, combined with digital changeover tracking, close that gap.
Changeover Loss Category
% of Total Changeover Time
Primary Reduction Lever
Tool & fixture retrieval
18–24%
SMED external conversion + shadow boards
Physical adjustment & swap tasks
28–35%
Cobot-assisted mechanical tasks
Recipe / parameter entry
12–16%
Digital changeover tracking + auto-download
First-article inspection
14–20%
Cobot-integrated vision QC
Coordination & waiting
10–18%
Parallel task scheduling + digital work orders
Ready to quantify changeover losses on your specific lines? Book a demo with iFactory's OEE team and get a line-specific changeover assessment based on your production mix.
The SMED Framework: What It Actually Requires to Work
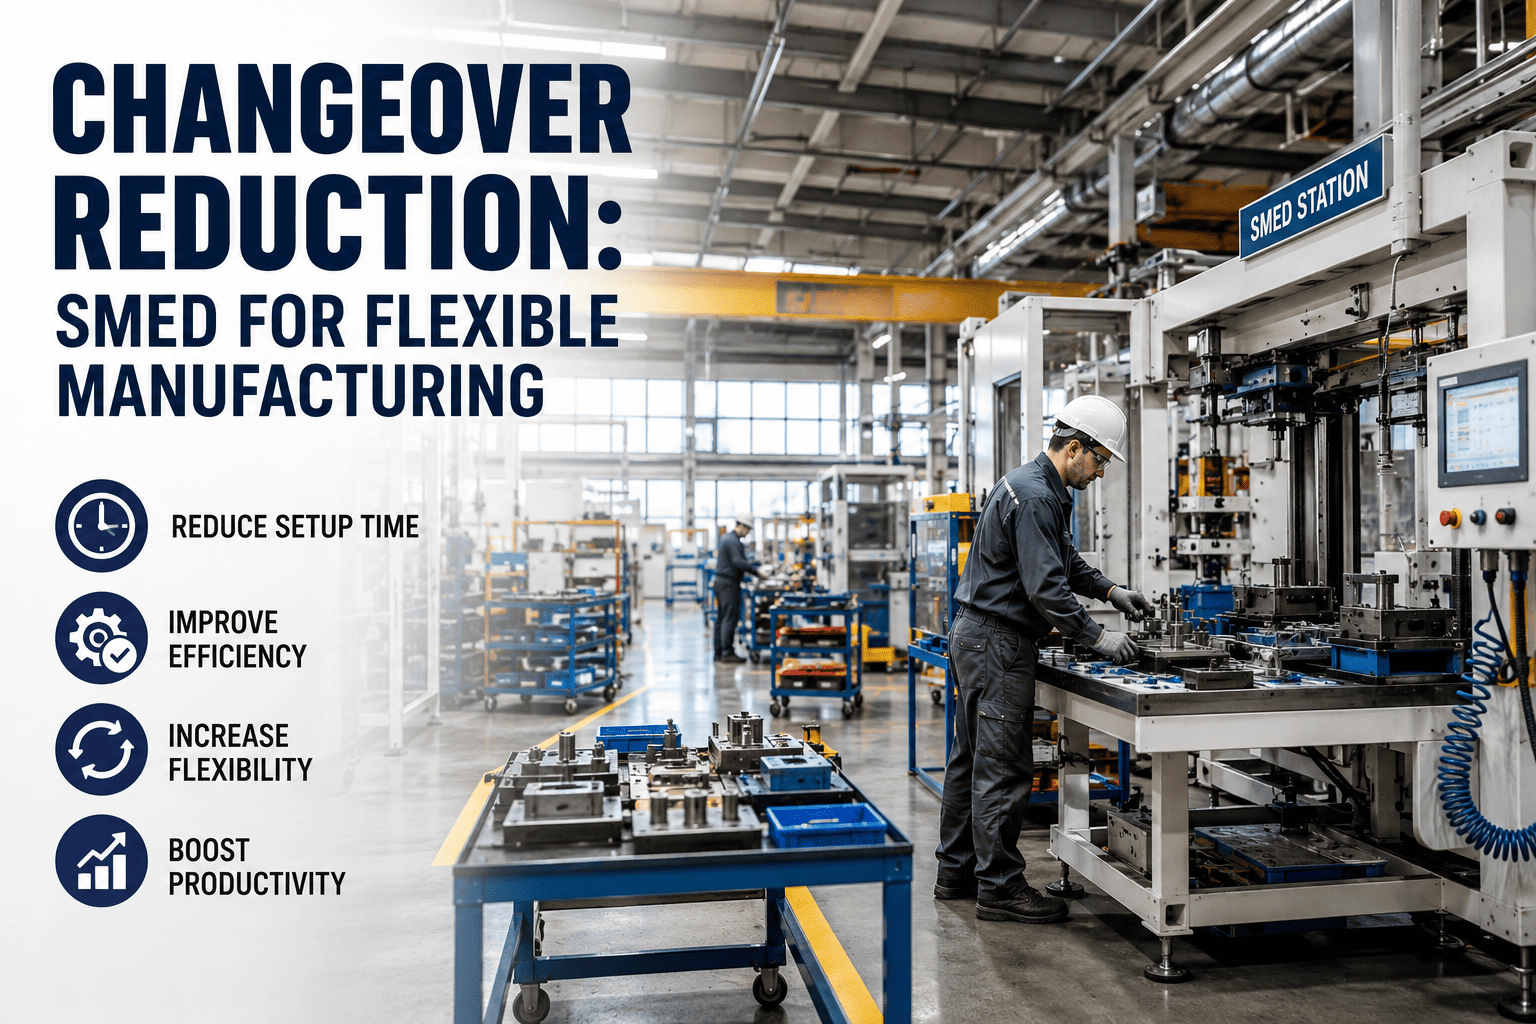
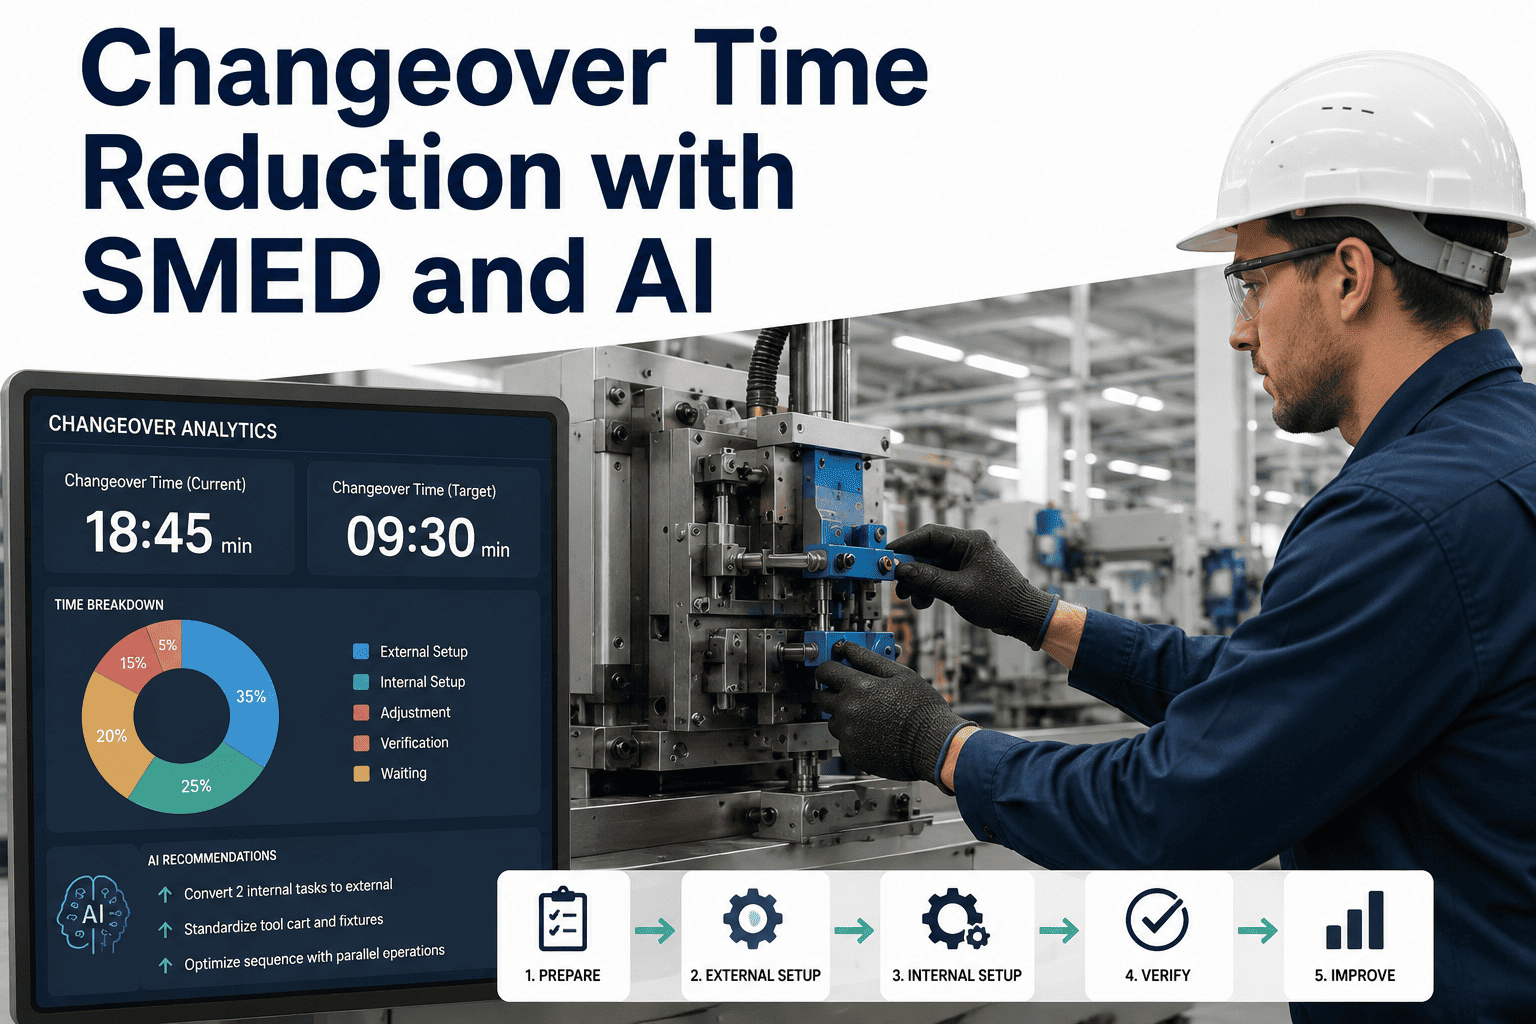
SMED is not a one-day kaizen event. It is a systematic reclassification and redesign discipline that follows a specific sequence. Teams that treat SMED as a tool box — selecting tactics without the underlying analysis — consistently plateau at 20–25% reduction and stall. The full methodology has four distinct stages, and each stage is a prerequisite for the next.
01
Observation & Time Study
Video every changeover for a minimum of five cycles. Timestamp every discrete activity. Do not rely on operator estimates — they consistently undercount preparation and adjustment time by 30–40%. iFactory's changeover tracking module captures timestamped digital records that replace manual observation sheets.
Output: Verified changeover time breakdown by task category
02
Internal / External Classification
Internal tasks require the machine to be stopped. External tasks can be performed while the previous run is still active. In a typical unoptimized changeover, 60–70% of tasks are classified as internal when 30–40% could legally be converted to external with no capital investment — only procedure and staging redesign.
Redesign procedures, staging areas, and material flows so that classified-external tasks are executed before machine stop. This stage alone typically yields 25–35% changeover time reduction with minimal capital expenditure. Shadow boards, pre-staged carts, and standardized kitting protocols are the primary tools.
Output: New SOPs and physical staging redesign
04
Internal Task Streamlining
Reduce the time required for tasks that must remain internal: quick-release clamps replace threaded fasteners, standardized tooling eliminates adjustment, one-touch fixtures replace multi-point adjustment. This is the stage where cobots deliver transformative acceleration — executing repetitive physical tasks in parallel with human operators at consistent cycle time.
Output: Redesigned tooling, fixtures, and cobot task assignments
Where Cobots Accelerate What SMED Cannot
Cobots — collaborative robots designed to work alongside human operators without safety caging — address the physical execution ceiling that manual SMED hits. After the methodology reduces changeover from 45 minutes to 28 minutes through reclassification and procedure redesign, the remaining 28 minutes is dominated by tasks that are physically irreducible for a human: consistent torque application across multiple fastener points, precise positional adjustments requiring submillimeter repeatability, and repetitive part-swap sequences that fatigue operators and introduce variability.
Task Type
Manual Only
SMED + Cobot
Time Saved
Die / mold swap (12-point)
8.4 min
3.1 min
63% faster
Fixture alignment & torque
6.2 min
2.4 min
61% faster
Material loading / reel change
4.8 min
2.2 min
54% faster
First-article dimensional check
5.5 min
1.8 min
67% faster
Parameter entry & verification
3.2 min
0.4 min
88% faster
The parameter entry row is particularly significant. When iFactory's digital changeover tracking integrates with the cobot controller, recipe parameters download automatically at changeover trigger. The operator confirms — one tap — rather than manually entering 12–20 fields. This eliminates the single largest source of first-article failures in format-change-intensive environments: parameter transcription error.
See how iFactory's changeover tracking integrates with cobot workflows to eliminate manual parameter entry. Book a technical demo with our OEE specialists.
Implementation Roadmap: 12 Weeks from Baseline to Full Deployment
The sequence matters as much as the components. Organizations that deploy cobots before completing SMED analysis consistently report poor ROI — the cobot accelerates a broken process rather than an optimized one. The correct sequence is methodology first, automation second.
1
Weeks 1–2
Baseline Measurement & Time Study
Deploy iFactory's changeover tracking on target lines. Capture timestamped activity logs for a minimum of five changeover cycles per line. Quantify current state: total changeover time, variance between operators, and breakdown by task category. Establish the baseline OEE impact in dollar terms.
Output: Verified baseline + dollar-value loss quantification
2
Weeks 3–4
Internal/External Classification & SOP Redesign
Conduct SMED classification workshops with operators and maintenance leads. Reclassify task list. Redesign staging areas, build shadow boards, and document revised standard work. Redeploy tracking to measure impact of procedural changes alone — before any hardware investment.
Output: 20–30% reduction from procedure redesign alone
3
Weeks 5–7
Cobot Task Selection & Cell Design
Identify internal tasks with the highest time-and-consistency improvement potential for cobot assignment. Design the cobot cell around changeover task flow — not around continuous production flow. Program and validate cobot sequences on a testbed before line deployment. Integrate recipe download trigger with iFactory changeover tracking.
Output: Validated cobot sequences + integration test sign-off
4
Weeks 8–9
Pilot Line Deployment & Operator Qualification
Deploy on a single line. Run a minimum of ten changeover cycles with full observation. Measure total changeover time, task-by-task performance, and first-article pass rate. Train operators on cobot collaboration protocols — average training time is 4–6 hours. Capture operator feedback for procedure refinement.
Output: Pilot performance report vs. baseline
5
Weeks 10–12
Full Rollout & KPI Dashboard Activation
Scale across target lines. Activate iFactory's OEE and changeover tracking dashboards for supervisors and plant managers. Set alert thresholds for changeover time overruns. Run monthly review cycles to identify remaining variance and continuous improvement opportunities as operator experience accumulates.
Ready to Start Measuring Changeover on Your Lines?
iFactory's changeover and setup time tracking gives you the baseline data you need before committing to any capital investment — and the ongoing visibility to sustain gains after deployment.
A 50% reduction target is only meaningful if the measurement methodology is consistent. Teams that measure "changeover time" without a standard start and stop definition will report different numbers from the same event. The following framework is the one iFactory's changeover tracking module enforces by default — and it matches the SEMI and AIAG definitions used in automotive and electronics manufacturing audits.
Total Changeover Time (TCT)
Last conforming unit of previous run → First conforming unit of new run. The primary reduction target. Does not stop at machine start — it includes first-article inspection and approval.
Target: Reduce by 50% from baseline
Internal Task Time (ITT)
Time machine is stopped for changeover tasks only. Should decrease as external conversion progresses. Primary indicator of SMED methodology effectiveness.
Target: Below 60% of pre-SMED ITT
Changeover Time Variance (CTV)
Standard deviation across changeover cycles, operators, and shifts. High variance indicates non-standardized execution — a leading indicator of future regression. Cobots reduce CTV by removing human execution variability.
Target: CTV below 10% of mean TCT
First-Article Pass Rate (FAPR)
Percentage of changeovers where the first inspected unit meets spec without rework or adjustment. Low FAPR extends effective changeover time well beyond measured TCT and is the most common source of improvement program plateau.
Target: Above 95% FAPR
Changeover OEE Impact ($)
TCT × changeovers per shift × throughput rate × shift cost. This is the executive metric that justifies investment and sustains program priority. iFactory calculates this automatically from line configuration data.
Track weekly — report monthly to leadership
Cobot Task Cycle Conformance
Percentage of cobot-assigned tasks completed within programmed cycle time. Deviations flag tooling wear, fixture misalignment, or material staging failures before they cause changeover time overruns.
Target: Above 98% conformance
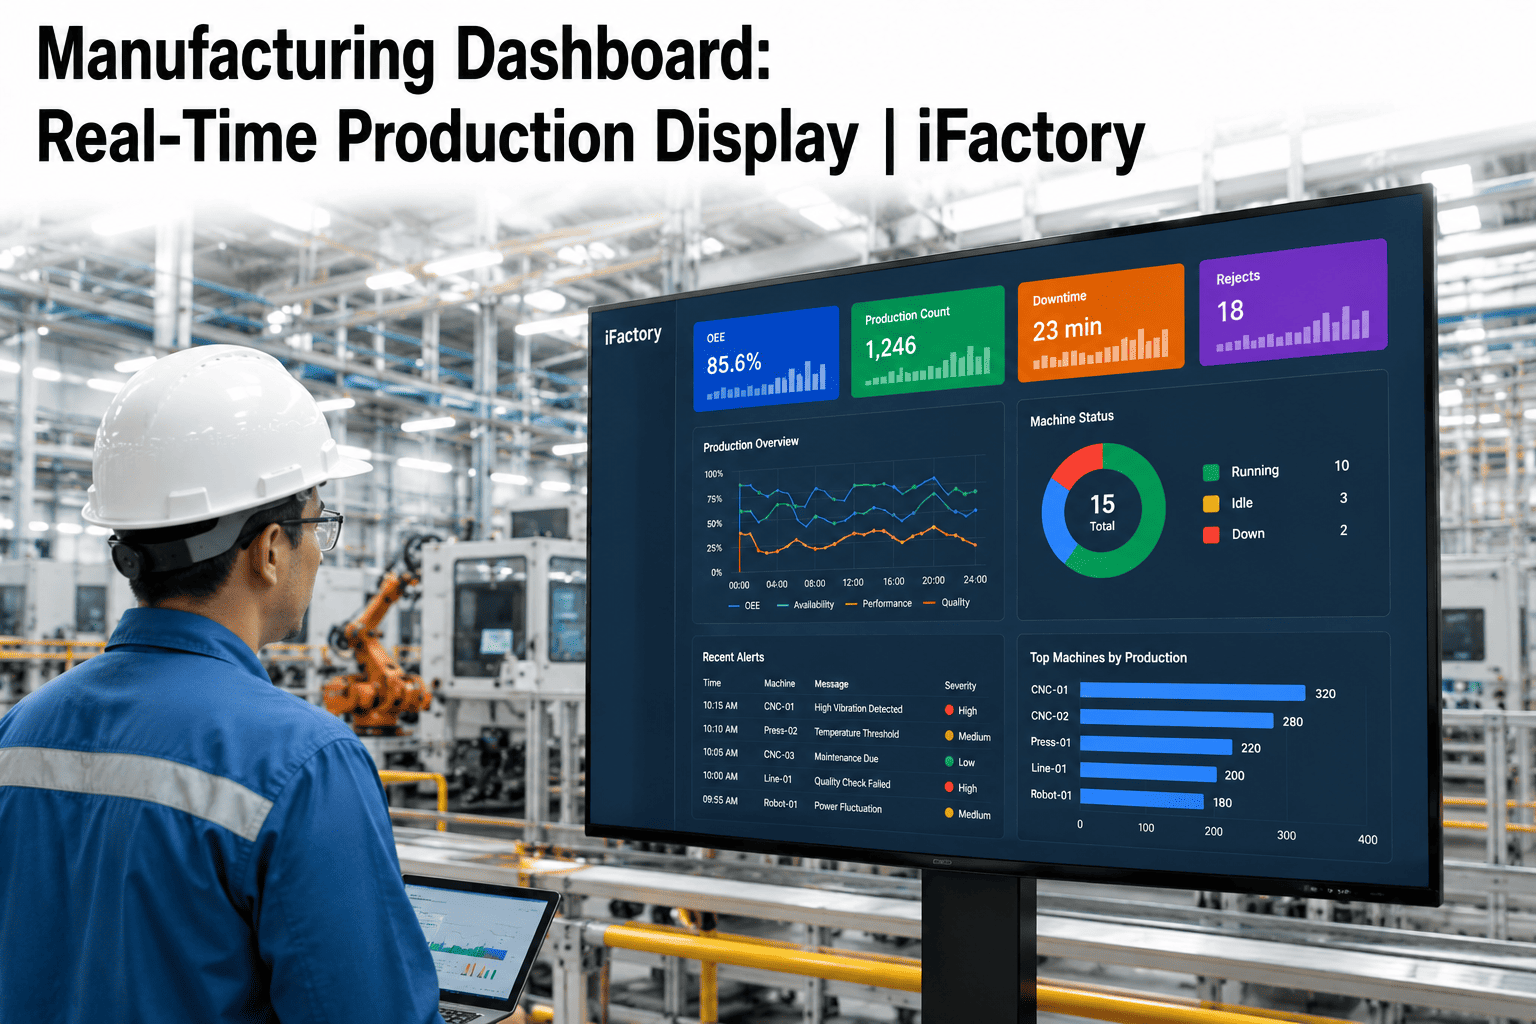
iFactory's OEE dashboard tracks all six of these KPIs automatically. Book a demo to see how the changeover tracking module integrates with your existing line data sources.
ROI Model: What 50% Changeover Reduction Actually Returns
The financial case for combined SMED and cobot investment is straightforward to model, but the numbers are consistently underestimated because most teams focus only on direct labor savings. The full value pools are broader.
Capacity hours recovered per line per year (50% reduction, 3 changeovers/shift, 2 shifts)
480–720 hrs
Revenue equivalent at $1,800/hr throughput
$864K–$1.3M
Reduction in planned downtime classification for changeover
−40–55%
OEE Availability improvement (typical)
+6–11 pts
Based on iFactory customer data across 22 discrete and process manufacturing lines, 2024–2025.
Reduction in changeover-related rework and scrap
−58–72%
First-article pass rate improvement
+18–28 pts
Operator direct labor savings per changeover (parameter entry + adjustment)
8–14 min
Annual labor cost avoided per line (at $32/hr, 3 changeovers/shift)
$47K–$82K
First-article quality improvement is the most frequently underestimated ROI source — rework time is rarely captured in baseline changeover measurements.
Increase in feasible SKU variants per shift
+35–60%
Minimum economic run length reduction
−40–50%
Customer order lead time improvement
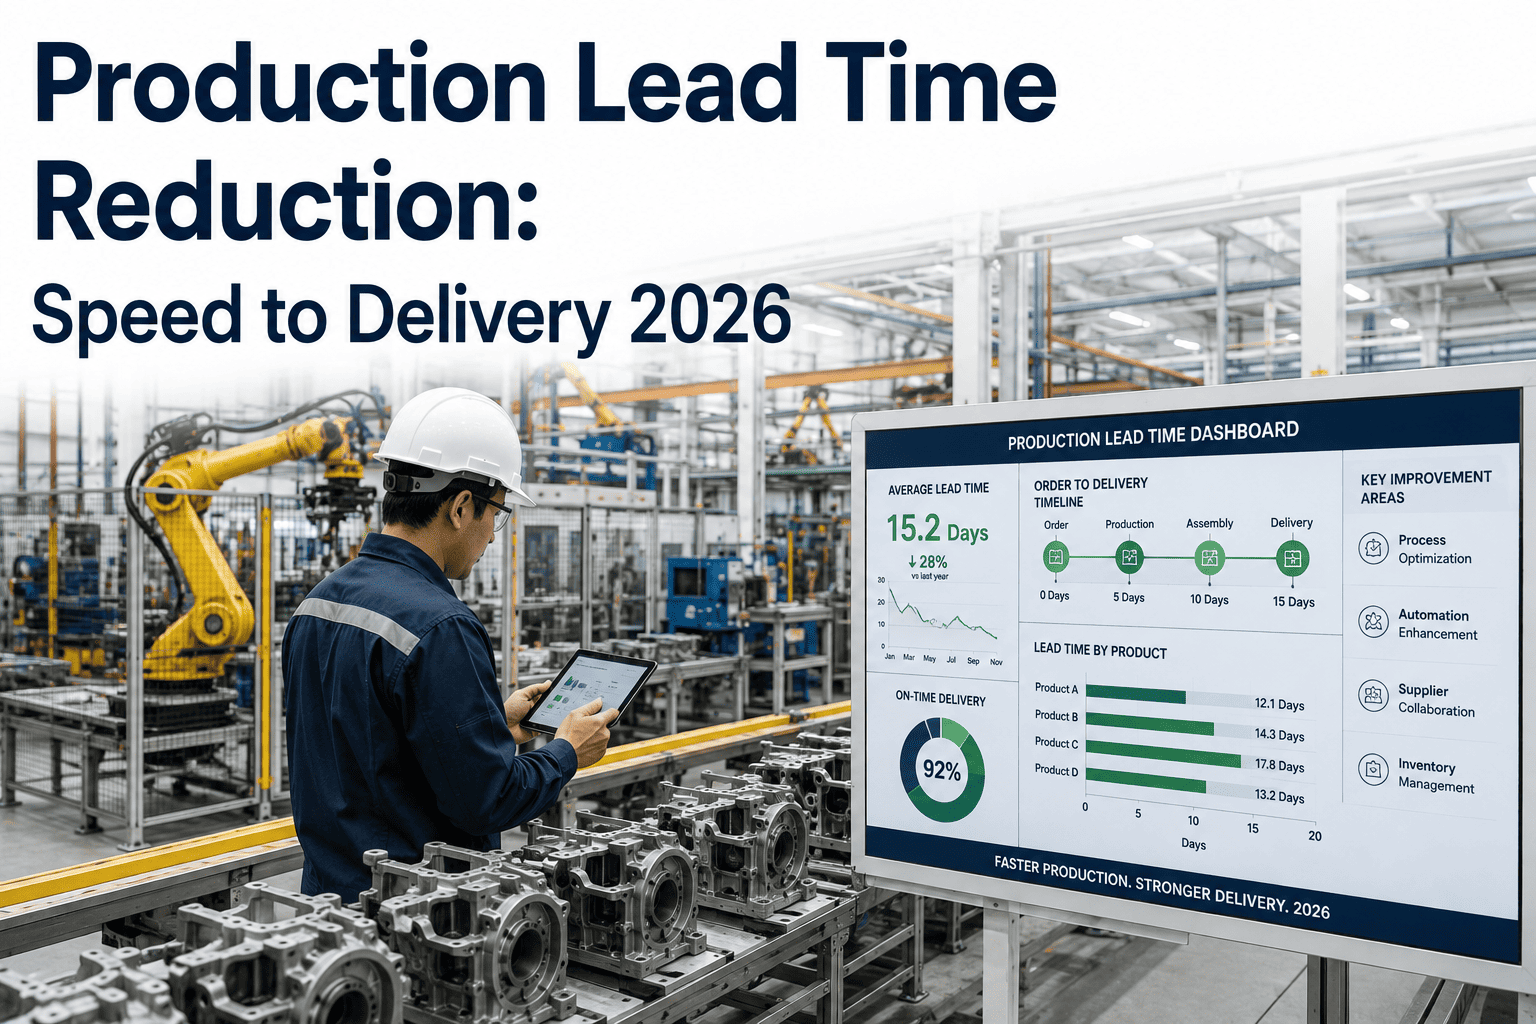
−2–4 days
Inventory carrying cost reduction from smaller batch sizing
$80K–$240K/yr
Flexibility gains compound over time as sales teams learn to compete on lead time — a strategic benefit that is absent from most ROI models at project approval stage.
Expert Review
Sandra K., VP of Manufacturing Operations
Tier 1 Automotive Supplier, 3 Plants, Midwest Region
"We ran three SMED programs over eight years with reasonable results — 20 to 25% reduction on our best lines, then a plateau we could not break through. The difference when we added cobots and iFactory's changeover tracking was that we finally had data granular enough to see where the remaining time was going. It turned out that 31% of our remaining changeover time was first-article inspection and parameter-entry verification — tasks we had categorized as 'essential' but that were actually highly reducible. With cobot-assisted first-article and auto-recipe download through iFactory, we hit 52% total reduction versus our original baseline within six months. The ROI in year one was $1.7 million across four lines. More important to me strategically: we can now run lot sizes that our competitors cannot economically match. That has changed how our sales team prices short-run business."
52%
Changeover Reduction
$1.7M
ROI in Year 1
4 Lines
Deployed Across
6 mo
To Full Result
Frequently Asked Questions
SMED was originally developed for stamping presses (discrete), but the methodology applies directly to process manufacturing — particularly in food and beverage, pharmaceuticals, and chemicals where format changes involve CIP cycles, recipe parameter transitions, and line flush sequences. The classification logic (internal vs. external) is identical; the task types differ. In process environments, the largest SMED gains typically come from converting CIP preparation and recipe staging to external activities, which are often performed reactively today. iFactory's changeover tracking supports both manufacturing types with configurable task category libraries.
A single cobot unit for changeover assistance — including the arm, end-of-arm tooling for the specific task set, safety assessment, and initial programming — typically ranges from $75,000 to $140,000 fully installed. For lines with four or more format changes per shift, this investment typically achieves positive ROI within 8–14 months through capacity recovery and labor savings alone. The correct economic comparison is not cobot cost vs. zero investment — it is cobot cost vs. the annual OEE loss from current changeover time, which for most lines is $400,000 to $1.2 million per year.
Operator resistance to cobots in changeover applications is significantly lower than in continuous production applications, for a straightforward reason: changeover is universally recognized as the most physically demanding and least satisfying part of an operator's shift. Torque applications across 12-point dies, repetitive material loading under time pressure, and manual first-article measurement are tasks operators routinely identify as the ones they most want to eliminate. Framing cobot deployment as removal of the least desirable changeover tasks — not as replacement of the operator — is accurate and typically receives strong floor-level support when operators are involved in the task selection process from the beginning.
iFactory's changeover tracking module integrates with major cobot platforms — Universal Robots, FANUC CRX, KUKA iiwa, and ABB GoFa — through standard OPC-UA and REST API interfaces. When a changeover event is triggered in iFactory, the system sends the recipe identifier to the cobot controller, which loads the corresponding task program and parameter set automatically. Task-level timestamps from the cobot stream back to iFactory in real time, providing granular visibility into which cobot steps are on-cycle and which are running long. Integration setup typically requires 2–4 days of configuration work per line.
Changeover gains regress without measurement infrastructure — this is the most consistent finding across SMED program retrospectives. Teams that achieve 40% reductions and then deprioritize tracking typically regress 15–25% within 18 months as procedures drift, staging disciplines erode, and operator turnover introduces variation. The combination of digital changeover tracking (which makes regression immediately visible) and cobot-assisted execution (which eliminates human execution variability from the highest-impact tasks) creates a sustainable floor that manual SMED programs cannot match. iFactory's automated KPI alerts flag changeover time overruns in real time, enabling rapid intervention before gains erode.
Conclusion: The 50% Target Is Achievable — with the Right Sequence
A 50% reduction in changeover time is not a theoretical benchmark. It is a documented outcome from combining SMED methodology with cobot-assisted execution and digital tracking infrastructure, applied in the correct sequence: measure first, reclassify second, standardize third, automate fourth. Teams that follow this sequence consistently achieve the target. Teams that shortcut to cobot deployment without completing SMED analysis automate their existing inefficiencies and plateau well short of it.
The strategic value extends beyond the OEE numbers. Manufacturers that compress changeover time below the economic threshold for small-batch production gain a competitive capability — the ability to run shorter lot sizes profitably — that compounds over time as customer demand for product variety and shorter lead times continues to increase. In an environment where many manufacturers are still treating setup time as an immovable constraint, the ones who eliminate it build a structural advantage that is difficult for competitors to replicate quickly.
iFactory's changeover and setup time tracking gives operations teams the measurement foundation, the KPI visibility, and the cobot integration layer to execute this methodology without building a custom data infrastructure from scratch.
If your lines are losing more than 20 minutes per changeover, the gap between where you are and where you could be is quantifiable today. Book a demo with iFactory's OEE team and get a line-specific changeover loss assessment within one week.
Ready to Eliminate Changeover as a Production Constraint?
Get a site-specific changeover ROI model — including an estimated capacity recovery calculation based on your line configuration, changeover frequency, and throughput rate.