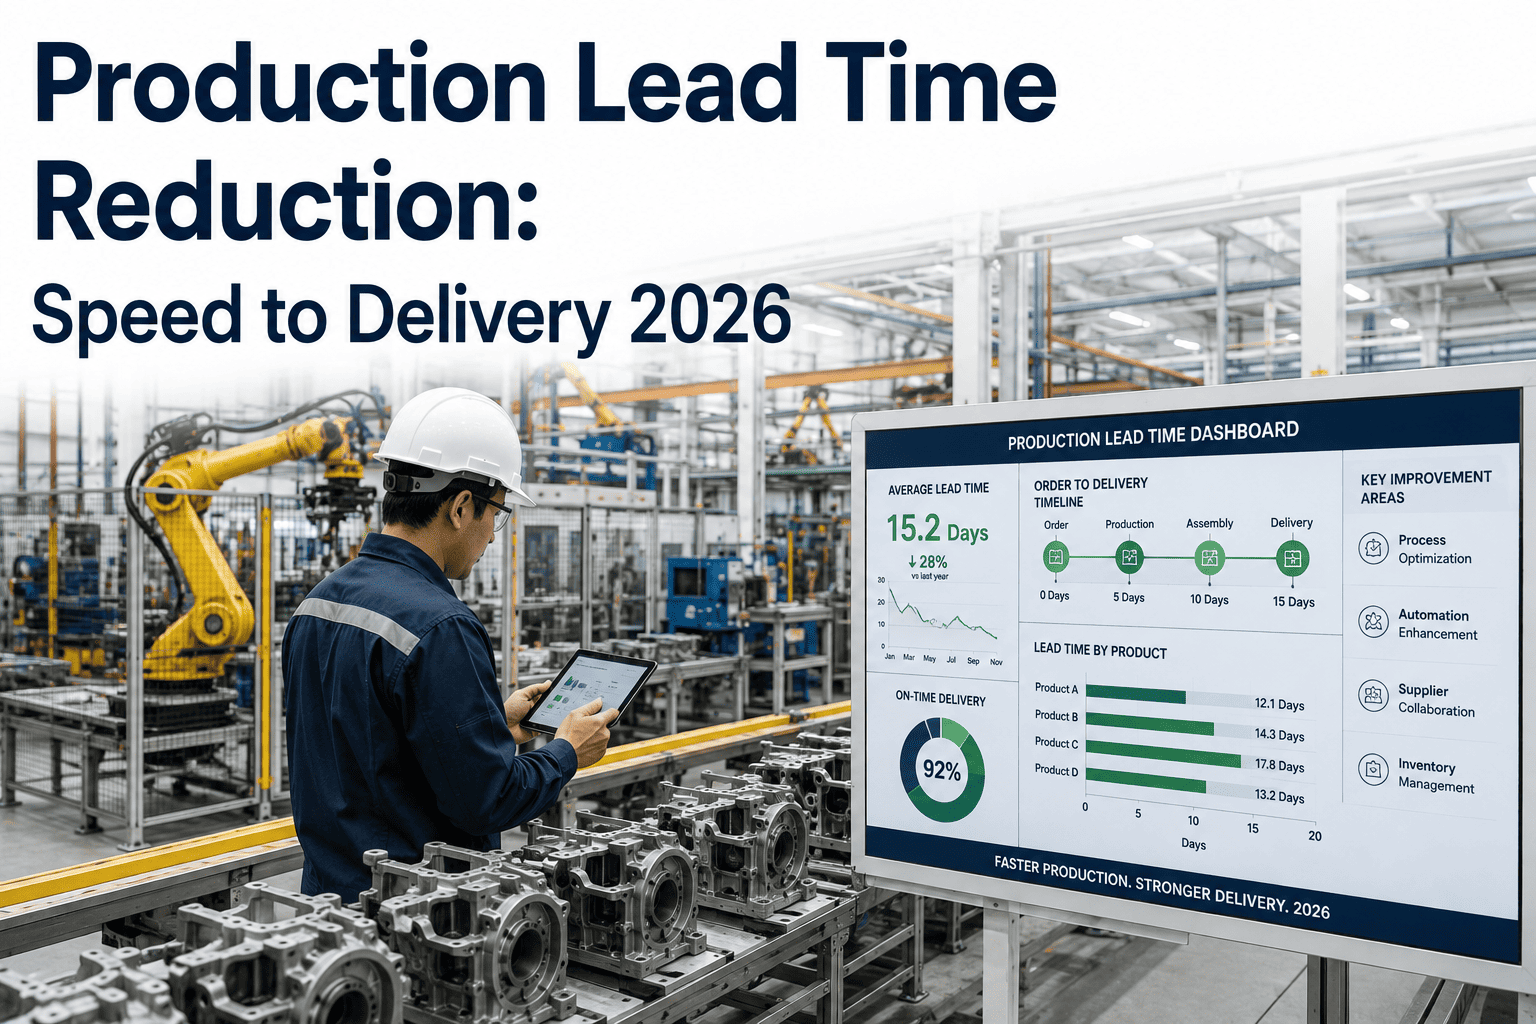
Ask most plant managers how much of their lead time is actual processing versus waiting, and the guess is almost always wrong in the same direction — they underestimate how much of it is queue time. In a typical job shop, real machining, assembly, or testing work accounts for only 10 to 20 percent of total lead time, and the remaining 80 to 90 percent is parts sitting in queues waiting for a machine, an operator, or enough units to form a batch. That imbalance is exactly why lead time reduction rarely requires faster machines. Book a session with the iFactory team to see where your own lead time is actually going.
Production Planning · Delivery Speed
Production Lead Time Reduction: Where Manufacturing Speed Actually Comes From in 2026
Most lead time is waiting, not working. Process compression, parallel operations, and queue time elimination cut delivery time without buying a single new machine.
Where a Typical Job's Time Actually Goes
Actual processing
10–20%
Queue, wait & move time
80–90%
The largest lead time reduction opportunity is almost never on the machine — it is in the space between operations.
Breaking Down the Clock
The Four Components That Make Up Total Manufacturing Lead Time
Processing Time
The actual work — machining, assembly, testing — that transforms the part. This is the smallest component in most facilities and the one furthest along the diminishing-returns curve for further speed-up.
Setup and Changeover Time
Time spent preparing machinery, tooling, and fixtures for a specific batch. Long setups force large batches to amortize the changeover cost, which then increases queue time downstream.
Queue Time
The duration a part waits in line before the next operation, because other jobs are ahead of it or the resource is occupied. In most plants this is the single largest component of total lead time.
Wait and Move Time
Time lost to missing information — drawings not staged, programs not loaded, certifications not verified — plus physical transport between work centers, both of which are information and layout problems rather than capacity problems.
What Actually Moves the Needle
Five Strategies That Compress Lead Time Without New Capacity
01
Control Work-in-Process at the Point of Release
Releasing work to the floor only when capacity actually exists to process it prevents the WIP accumulation that causes congestion. Facilities implementing capacity-based work release commonly see lead time reductions in the 30 to 50 percent range within three to six months, without touching processing speed.
02
Reduce Changeover Time to Enable Smaller Batches
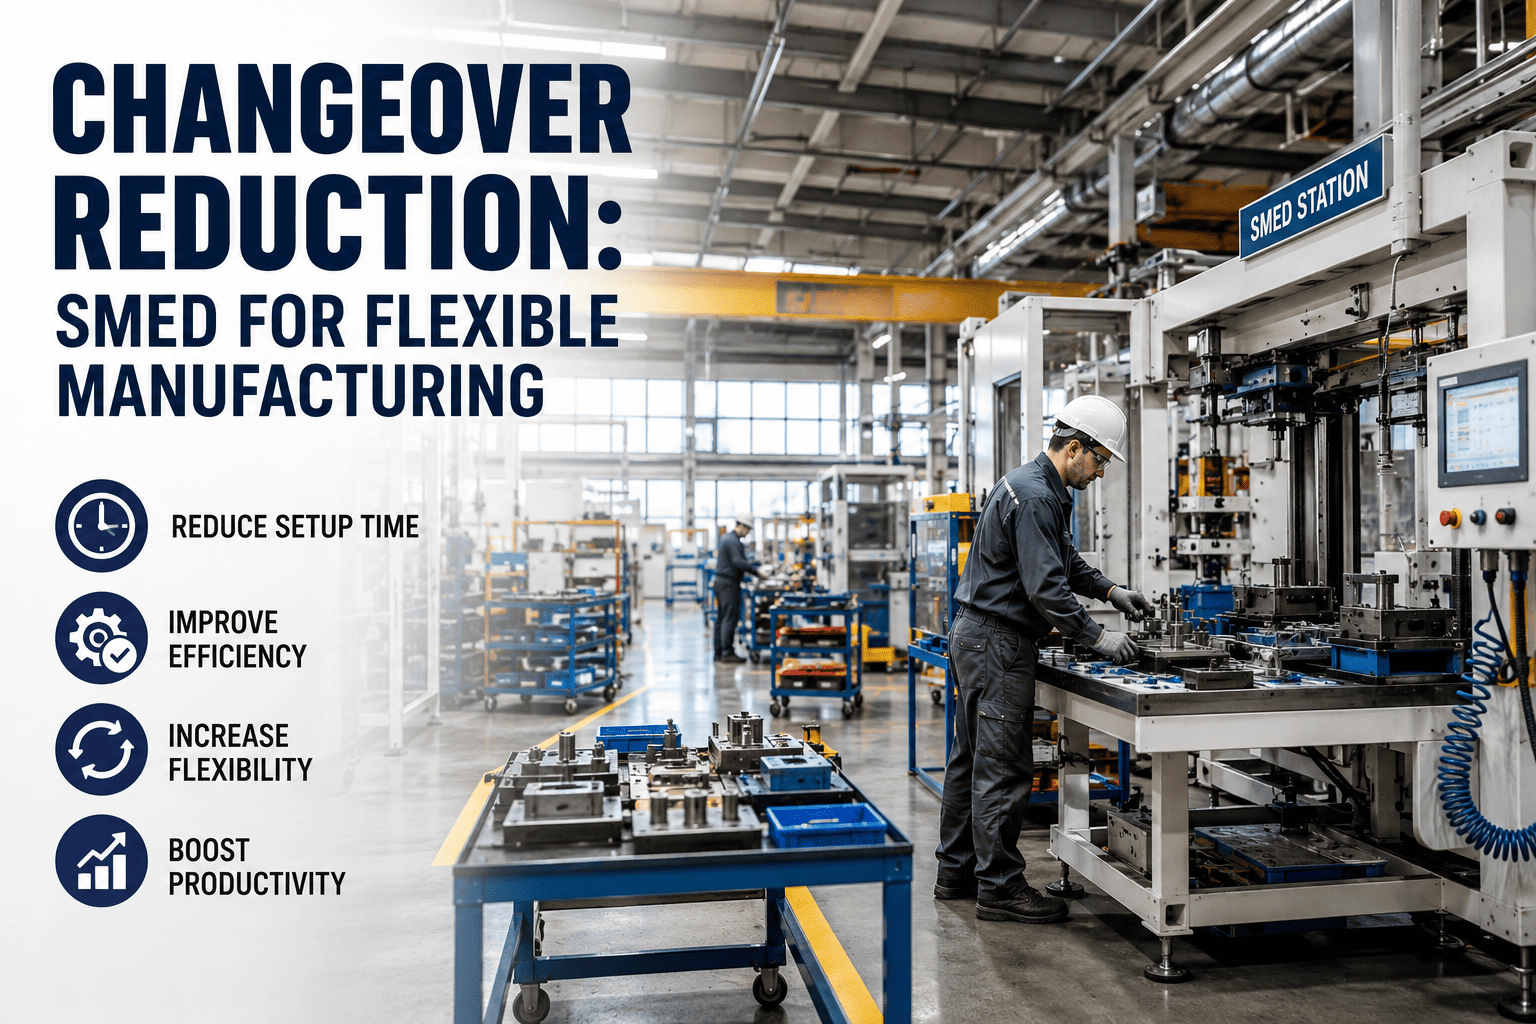
Single-Minute Exchange of Dies separates internal setup tasks that require the machine stopped from external tasks that can be prepared in advance, cutting a 90-minute changeover to 15 minutes and enabling far smaller, faster-flowing batches.
03
Overlap Operations Instead of Running Them Sequentially
Where quality requirements allow, starting a downstream operation on the first units of a batch before the entire batch finishes the prior operation removes lead time without any change to individual operation speed.
04
Sequence Jobs to Minimize Total Flow Time
Balancing load across parallel resources and sequencing jobs deliberately, rather than first-come-first-served, reduces localized congestion at bottleneck operations that otherwise dominate total lead time.
05
Close the Information Gap Before the Part Arrives
Ensuring drawings, NC programs, and inspection criteria are staged and verified before a job reaches the next work center eliminates wait time that has nothing to do with machine availability.
See Where Your Own Queue Time Is Hiding
iFactory Maps Lead Time by Component, Not Just as One Aggregate Number
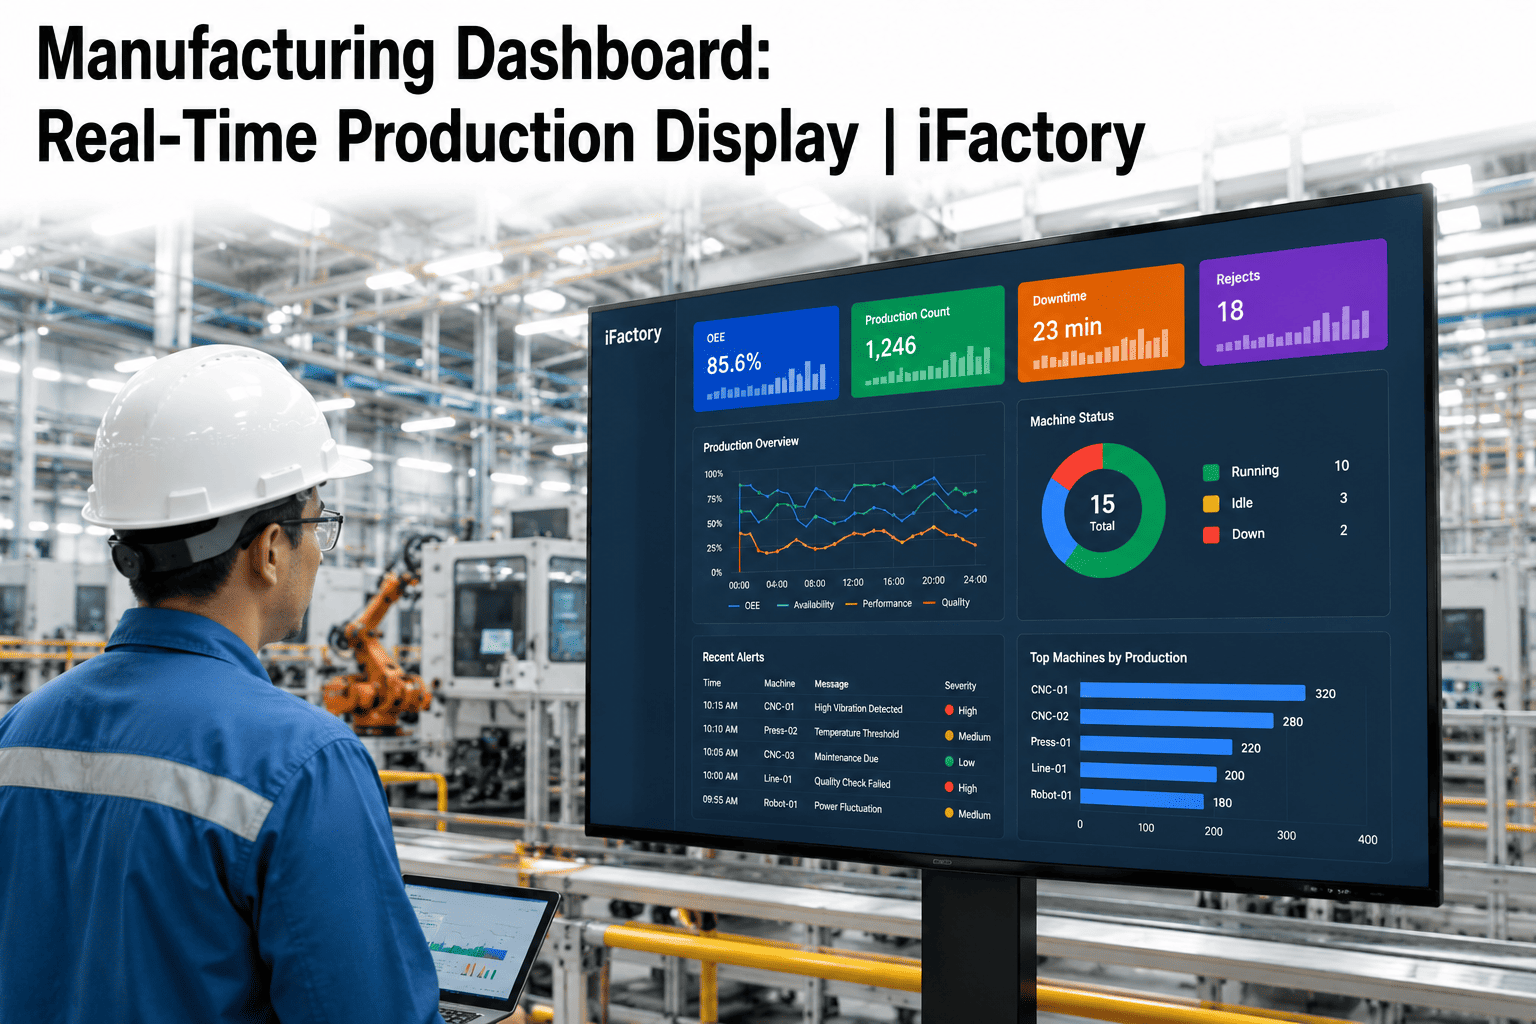
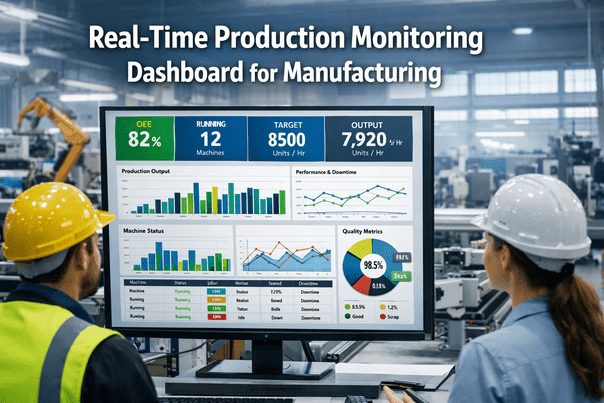
Knowing that lead time is too long does not tell you what to fix. iFactory breaks down processing, setup, queue, and wait time by work center so you can target the specific bottleneck actually driving your delivery delays.
Tracking Progress
Metrics That Distinguish Real Lead Time Improvement From a One-Time Fluke
| Metric | What It Measures | Why It Matters |
|---|---|---|
| Average queue time per operation | Time parts wait between processing steps | The largest lever for lead time reduction in most plants |
| WIP-to-throughput ratio | Work-in-process relative to output rate | Rising WIP without rising output signals growing congestion |
| On-time delivery rate | Orders shipped by promised date | The customer-facing outcome that lead time work is meant to protect |
| Changeover duration | Time from last good part to first good part of next run | Directly limits how small a batch can economically be |
The mistake I see most often is a plant investing in a faster machine to cut lead time when the actual delay is a part sitting in a queue for three days waiting for the next operation. Faster processing on a bottleneck that already has ample capacity does nothing for the customer's delivery date, because the part still waits the same amount of time either side of that faster operation. Attacking queue time through disciplined work release and smaller batches costs almost nothing to implement and consistently delivers the largest single improvement, because it targets the 80 percent of the lead time clock that was never actually about the work itself.
Odalys Feinberg-Achterberg
Manufacturing Operations Specialist · 18 years designing production planning and flow improvement programmes across automotive and heavy industrial manufacturing
Where Lead Time Projects Go Wrong
Four Common Mistakes That Waste Lead Time Reduction Effort
Speeding Up a Non-Bottleneck Operation
Investing in faster processing at a work center that already has spare capacity does nothing for the customer's delivery date, because parts still wait the same amount of time on either side of it.
Releasing Work Early "To Be Safe"
Pushing jobs to the floor ahead of when capacity can actually process them feels productive but only builds queues faster, increasing total WIP without increasing throughput.
Treating Batch Size as Fixed
Assuming current batch sizes are a constraint rather than a choice skips the highest-leverage lever available — reducing changeover time to make smaller batches economical.
Ignoring Information Wait Time
Focusing only on machine and labor capacity while missing/delayed drawings, programs, or inspection criteria continue to stall jobs at the next work center regardless of how much capacity is freed up elsewhere.
Planning Team Questions
Lead Time Reduction — Frequently Asked
Why does reducing batch size help lead time when it means more setups and changeovers?
Smaller batches do add more changeovers, but the tradeoff strongly favors flow once setup time itself has been reduced through methods like SMED — a part in a small batch spends far less time waiting for the rest of its batch to finish the current operation before moving to the next one, and smaller batches also surface quality issues earlier since a defect is caught after a handful of units instead of after an entire large batch has already been processed. The net effect on total lead time is almost always a reduction even after accounting for the additional setup frequency. Book a demo to see the batch-size tradeoff modeled against your own changeover times.
Is it possible to reduce lead time without any capital investment in new equipment?
Yes — the majority of proven lead time reduction strategies, including work-in-process control at release, batch size reduction, job sequencing, and closing information gaps before parts arrive at a station, require no capital investment at all. They target queue and wait time rather than processing capacity, which is exactly why they tend to deliver faster payback than a capacity expansion aimed at speeding up an operation that was never the actual constraint on delivery time.
How do we identify which operation is actually the bottleneck driving our lead time?
The bottleneck is the operation with the largest and most consistent queue in front of it across time, not necessarily the slowest individual machine — a fast machine that everything routes through can still be the bottleneck if enough jobs compete for its time. Tracking queue length and wait time by work center over several weeks, rather than relying on anecdotal impressions from the floor, is the most reliable way to identify where congestion is actually accumulating. Contact our support team for help setting up work-center-level lead time tracking.
Does reducing lead time increase the risk of missing deliveries if something goes wrong?
Properly executed lead time reduction actually improves delivery reliability rather than degrading it, because shorter, more predictable flow through the plant means less time for a disruption to compound before it is noticed and corrected, and smaller batches limit how much work-in-process is exposed to a single quality or equipment issue at any given moment. The risk scenario people worry about — cutting safety stock or buffer time too aggressively — is a separate decision from compressing queue and wait time, and the two should not be conflated.
How long does it typically take to see measurable lead time improvement after implementing these strategies?
Facilities that implement disciplined work-in-process control at the point of work release commonly see measurable lead time reductions within three to six months, since the mechanism — preventing overloaded queues from forming in the first place — takes effect as soon as the release discipline is applied consistently. Changeover reduction through SMED typically shows results faster on the specific operations targeted, often within a few weeks of implementing the internal/external setup split, though scaling it across every changeover in the plant takes longer.
Most of Your Lead Time Is Waiting, Not Working
Find and Fix the Queue Time That's Actually Driving Your Delivery Dates
iFactory breaks lead time down by work center so you can see exactly where parts are sitting, not just how long the total cycle takes — turning a vague "lead time is too long" problem into a specific, fixable bottleneck.