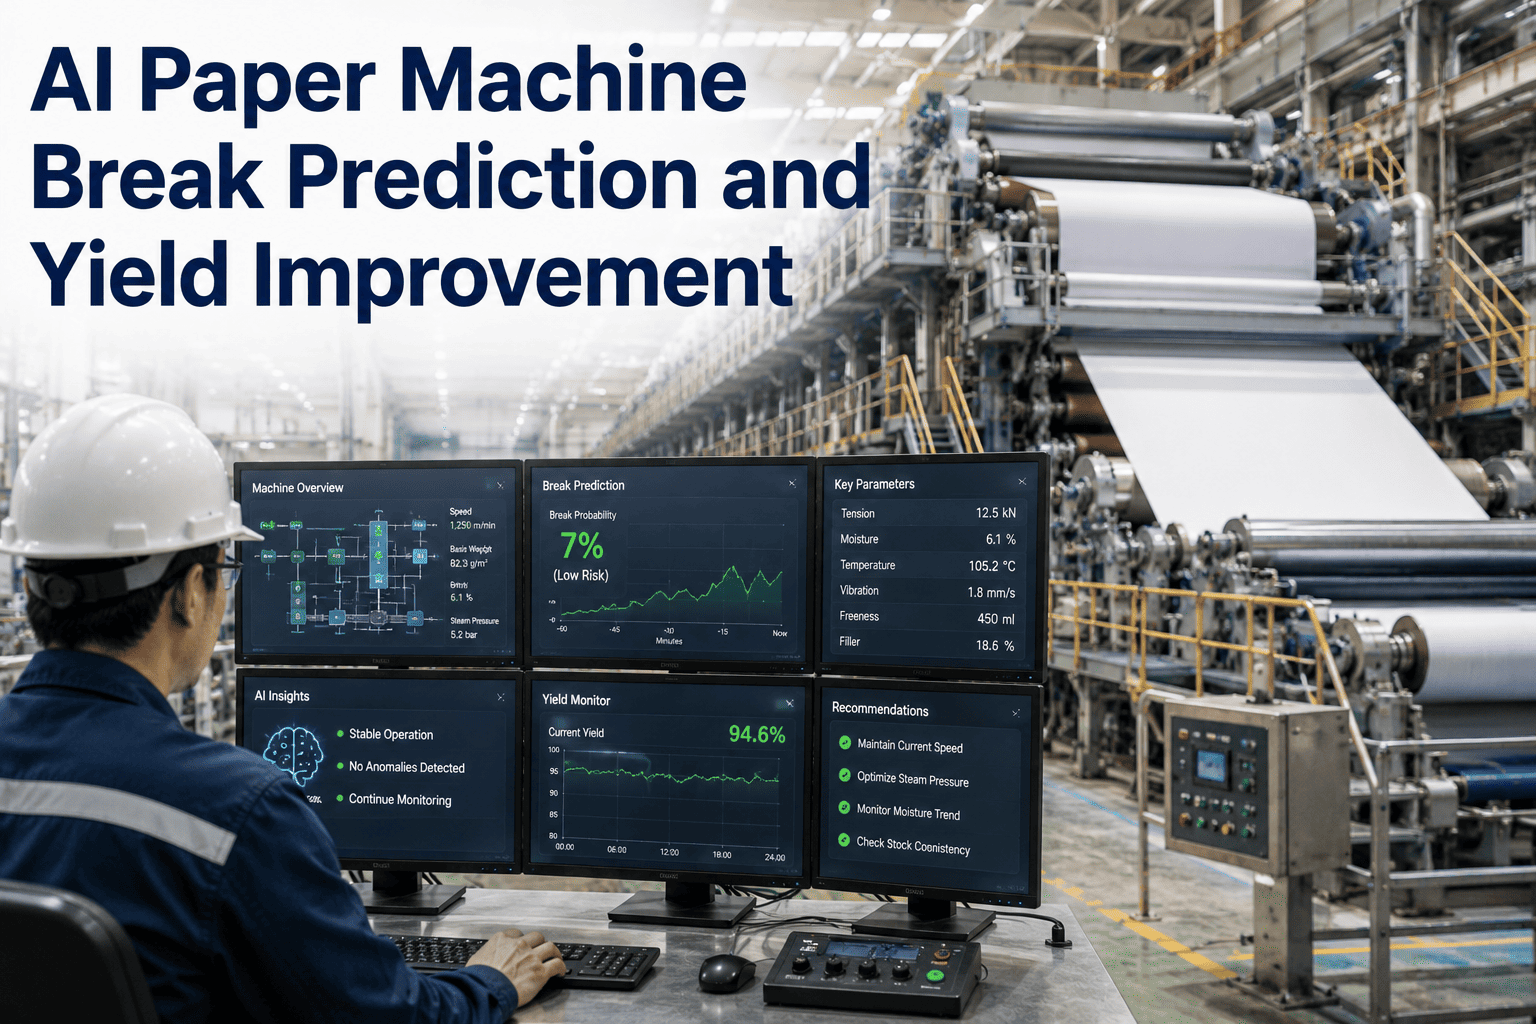
On a fully running paper machine, the wet end can break as often as fifteen times in a single day and up to thirty-five times in a month, and each one shuts the whole line down while a crew clears the reel, finds the cause, and threads the sheet back through dozens of rolls. That single interruption routinely costs over an hour of lost production, and on a machine running at full speed that hour can represent $10,000 to $50,000 in lost output and rework combined. Most mills still catch these breaks the way they always have — after the sheet has already parted, when there's nothing left to do but stop and clean up. The wet end is also the hardest section to explain afterward, because the combination of stock consistency, drainage and tension that causes a break rarely shows up as a single obvious alarm. AI models trained on your own break history change that by flagging rising break sensitivity minutes before the sheet actually lets go, and you can see what that looks like against your own machine's data with a free break-data review.
Pulp & Paper · AI Break Prediction
The Break You Didn't See Coming Was Visible in the Data Six Minutes Earlier
Wet-end web breaks are the single largest source of unplanned downtime on most paper machines. AI models trained on your own historian data catch the sensitivity building — before the sheet actually parts.
Where Breaks Actually Concentrate on the Machine
Every paper machine runs on the same underlying logic — a wet end that forms the sheet, a press section that consolidates it, and a dry end that removes the remaining water before the reel. Breaks can happen anywhere along that path, but they are not evenly distributed, and knowing where to concentrate monitoring effort makes a measurable difference in how early a model can flag trouble. The wet end draws the most attention for good reason: it's where the sheet is at its weakest, still mostly water, and where small process interactions can compound into a break faster than an operator can react manually.
Wet End · 65%
Press · 20%
Dry End · 15%
Wet end: drainage, stock consistency and forming-wire tension interact in ways that are hard to isolate after the fact
Press section: consolidation issues tend to follow visible moisture or nip-pressure trends, easier to spot early
Dry end: better understood mechanically, breaks here are the least frequent and the most predictable
What One Break Actually Costs
60+ min
Typical downtime to clear a reel, find the cause, and re-thread the sheet
$10K-50K
Estimated lost output and rework cost per break event on a full-speed machine
35/mo
Wet-end breaks reported on a fully operational machine in a typical month
5%
Even a modest reduction in break frequency, at this scale, adds up to significant annual savings
Why Wet-End Breaks Are the Hardest to Predict
Dry-End Breaks
Mechanically well understood. Tension, temperature and moisture profiles across the dryer section tend to trend visibly before a break, giving operators a workable warning window using conventional trending alone.
Wet-End Breaks
Governed by the interaction of stock consistency, drainage rate, and forming-wire tension — none of which behaves in a simple linear way. A change in one variable can offset another for hours before the combination finally crosses a threshold and the sheet lets go, which is exactly why traditional single-variable alarms miss it, and exactly why root-cause analysis after the fact so often comes back inconclusive.
How Many of Your Breaks Are Actually Predictable?
Our team can run your last twelve months of break history against a trained model, at no cost, and show you how many of those events would have been flagged in advance.
What the Model Actually Watches
Stock consistency
High-volatility signal, checked every few seconds
Drainage / vacuum profile
Tracked continuously across the forming table
Forming-wire tension
Cross-referenced against speed and grade changes
Basis weight profile
Scanned cross-direction, flags localized weak spots
Machine speed and load changes
Grade changes are a known high-risk window for breaks
From Reactive Cleanup to Predictive Warning
1
Historian connection
Read-only connection to your existing DCS or QCS historian, pulling stock, drainage, tension and speed tags alongside logged break events from the past twelve months.
2
Break sensitivity modeling
The model learns the multivariate pattern that preceded each historical break, not a single-variable threshold, so it can catch the combination effect that conventional alarms miss.
3
Live sensitivity scoring
Every second of running production is scored against the learned pattern, with rising sensitivity surfaced to the operator console minutes before a break would historically occur.
4
Root-cause feedback
Every flagged event, whether it led to a break or a near-miss, feeds back into the model, sharpening its sensitivity to your specific machine, furnish, and grade mix over time.
What Mills Report After Deployment
4.2x
More early warnings surfaced compared to conventional single-variable alarms
6 min
Typical lead time between a rising sensitivity flag and a historical break event
15-30%
Reported reduction in wet-end break frequency after model tuning to the specific machine
45 days
Typical time from kickoff to live advisory sensitivity scoring on the machine
Grade Changes Are the Riskiest Window
A disproportionate share of wet-end breaks cluster around grade changes, and it's easy to see why once you look at what's actually happening on the machine during that window. Stock consistency, refining, and additive dosing are all shifting at once, the forming table is adjusting to a new basis weight target, and the machine is often running at a transitional speed that doesn't match either the old grade or the new one. Operators know this intuitively — most mills already treat a grade change as a moment to watch closely — but "watch closely" still relies on someone catching a subtle combination of trends in real time, across dozens of tags, while also managing the change itself. A model that has learned what a healthy grade-change trajectory looks like from hundreds of past transitions can hold that attention continuously, flagging the specific combination of stock and tension drift that has historically preceded a break during exactly this kind of transition, without needing anyone to be staring at the right trend chart at the right second.
Beyond Break Prediction: Where Else AI Helps on the Machine
Break prediction is usually the entry point because the cost of a break is so visible and easy to justify, but the same historian connection and modeling approach extends naturally to other sources of loss on a paper machine that are harder to see day to day.
Moisture
Cross-direction moisture profile control, reducing both over-drying energy waste and moisture-related quality rejects
Broke
Predicting the conditions that lead to broke generation, not just the break event itself, to reduce total fiber loss
Chemistry
Wet-end additive dosing tuned against real-time drainage and retention data instead of a fixed recipe
Dryer energy
Steam and dryer hood optimization based on actual sheet moisture rather than a conservative fixed setpoint
Frequently Asked Questions
Does this require new sensors on our paper machine?
In most cases, no. Paper machines already generate stock consistency, drainage, tension, basis weight and speed data through the existing DCS or QCS system, and that's typically enough to train an initial break-sensitivity model. If a specific gap in instrumentation limits accuracy for your machine, our team will flag it during the historian connection phase rather than assuming it upfront. Reach out to
our support team with details on your current control and quality system to find out what's already usable.
How accurate can break prediction realistically be?
Accuracy depends heavily on how much historical break data your mill has logged and how consistently it's tagged with the process conditions at the time. Mills with at least twelve months of tagged break history and reasonably granular process data typically see models surface a meaningfully higher number of early warnings than conventional single-variable alarms, with several minutes of lead time on wet-end events. No model catches every break, but catching a meaningful share of them earlier still adds up to substantial downtime and cost savings over a year.
Will this change how our operators respond to alarms?
It adds an earlier signal rather than replacing existing alarms. Operators continue responding to conventional threshold alarms exactly as they do today, with the sensitivity score providing additional context — a rising trend that hasn't yet crossed any single threshold but historically preceded a break. Most mills start by having the model surface recommendations on the operator console for review, giving the team time to build confidence before acting more aggressively on early flags.
Does this work across different grades and furnish mixes?
Yes, though the model needs to see break history across your typical grade range to learn how sensitivity patterns shift between them. Grade changes are a known higher-risk window for breaks, and a model trained across multiple grades can account for that shift rather than treating every grade the same way. Mills running a narrow grade slate tend to see the model reach useful accuracy faster, simply because there's less variation to learn.
How long until we see a measurable reduction in break frequency?
Most mills move from historian connection to live advisory sensitivity scoring within about 45 days. Measurable reduction in actual break frequency typically follows a further stretch of shadow-mode validation, as operators build trust in the early warnings and begin acting on them consistently. Book a
free consultation to walk through a realistic timeline for your specific machine and grade mix.
Your Historian Already Has the Warning Signs in It
Every break your machine has ever had is sitting in your process data, along with the pattern that led up to it. Our team can show you what that pattern looks like, at no cost, before you commit to anything.