Post-weld inspection catches bead width and height defects only after the joint has already cooled, and by that point an out-of-tolerance weld usually means full rework or scrap rather than a simple parameter correction on the next pass. A bead that runs three millimeters over the reinforcement height specification looks identical to a compliant weld to an inspector working without measurement tools, which is exactly why geometric non-conformance slips past visual inspection far more often than an obvious defect like spatter or porosity does. AI vision systems measure bead width, reinforcement height, toe angle, and leg length against the qualified weld procedure specification on every single weld rather than a sampled subset, turning a subjective pass or fail call into a logged dimensional measurement checked against the joint's actual tolerance band — see how iFactory's geometry measurement module profiles bead dimensions inline during production.
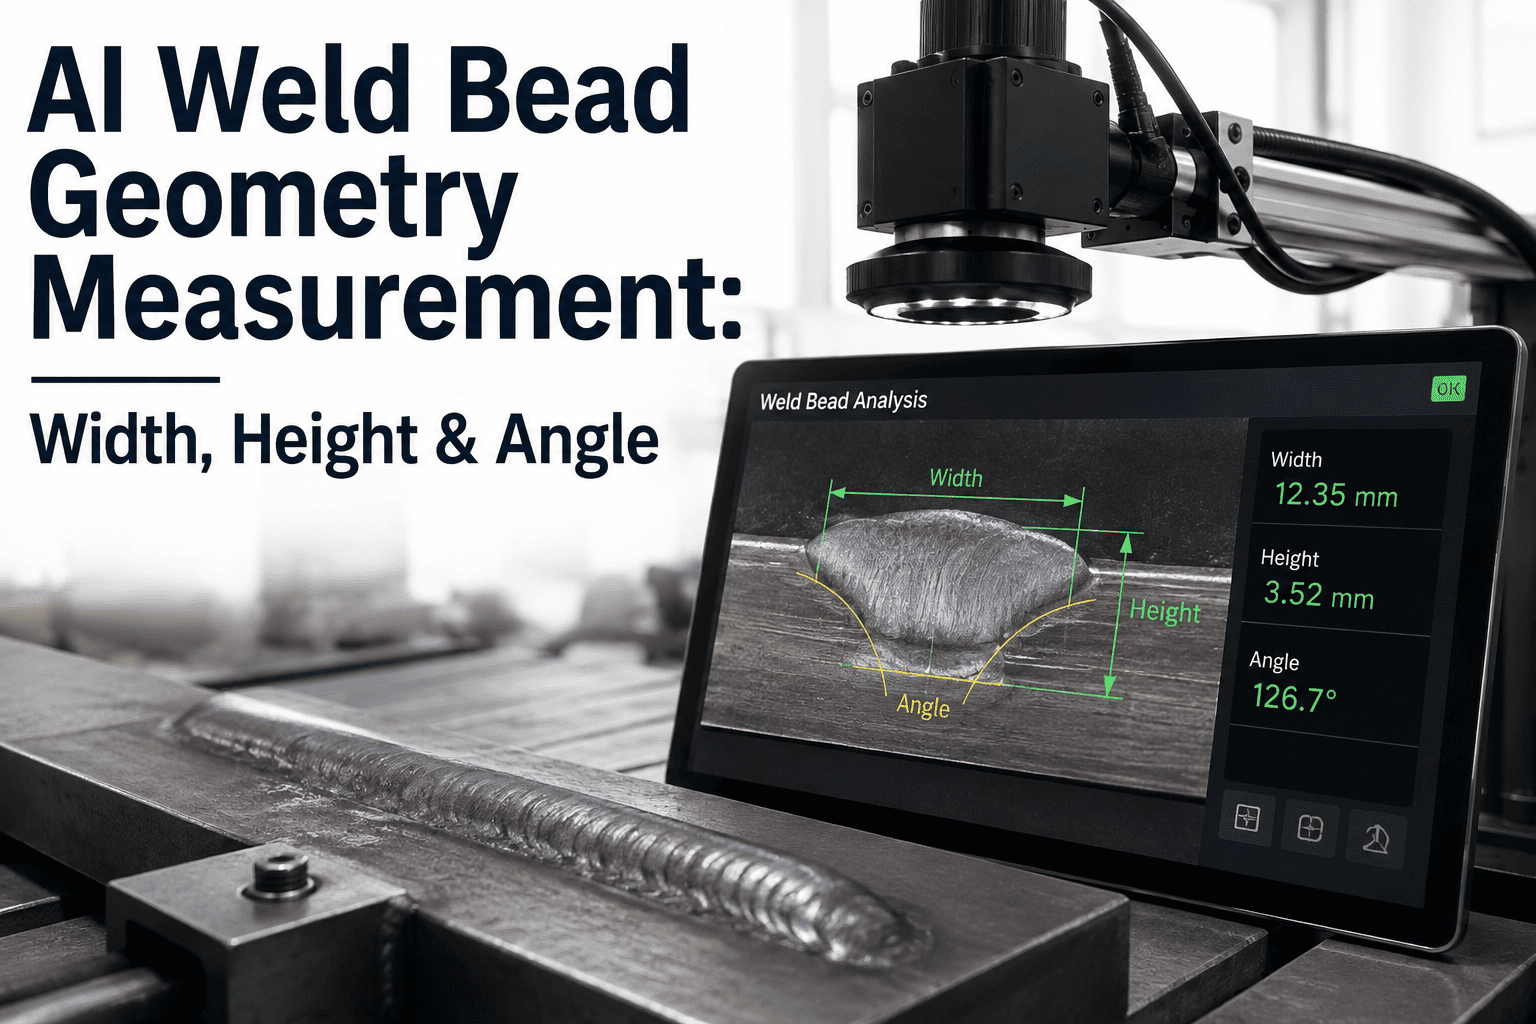
Weld Bead Geometry Measurement: Width, Height & Angle
Every bead carries a shape, and that shape is a measurement, not an impression. AI vision profiles bead width, reinforcement height, toe angle, and leg length against the qualified weld procedure specification on every joint, in production, without slowing the line.
A Weld Can Look Fine and Still Fail Its Dimensional Spec
Surface defects announce themselves. Porosity leaves visible pits, spatter scatters droplets across the surrounding plate, and a crack breaks the bead's continuous line. Geometric non-conformance does none of that. A bead that is two millimeters narrower than the qualified procedure calls for, or a fillet weld with one leg noticeably shorter than the other, can still present a smooth, continuous, defect-free surface to the naked eye — the shape is wrong, but nothing about its appearance signals that to an inspector working without a gauge.
That gap matters because geometry is where a weld's mechanical performance actually lives. Reinforcement height beyond the code limit concentrates stress at the weld toe rather than distributing load smoothly across the joint, creating a fatigue-crack initiation point that has nothing to do with the weld's internal soundness. Insufficient bead width or an under-filled fillet leg reduces the load-bearing cross-section below what the design calculation assumed. Neither of these shows up as a rejectable surface defect under a standard visual weld inspection, which is why geometric drift is one of the most common gaps between what a shop's inspection log says and what its welds actually deliver.
The process side of the problem compounds the inspection side. Bead geometry is a direct output of welding parameters — travel speed, wire feed rate, arc voltage, torch angle, and stick-out distance all shape the resulting bead shape, and small drifts in any one of them accumulate into a geometry deviation gradually rather than all at once. A robot welding the same joint on a thousand consecutive parts can drift on reinforcement height over a shift as a contact tip wears, without a single parameter alarm firing anywhere in the weld controller, because none of the individual parameters ever leaves its own acceptable range. The bead geometry is the only place that cumulative drift actually shows up, which is exactly why measuring it directly, rather than inferring quality from the welding parameters that produced it, catches problems that a parameter-monitoring system alone is structurally unable to see.
The Five Dimensions That Define a Weld's Shape
Every weld procedure specification defines an acceptable range for a small set of geometric parameters. These five show up across nearly every joint type and welding process, from a butt weld on a pressure vessel to a fillet weld on a structural bracket, and each one maps to a specific mechanical consequence when it drifts outside its qualified band.
How Bead Geometry Actually Gets Measured
Manual measurement of bead geometry relies on fillet gauges, weld gauges, and a trained inspector's judgment, applied at sampled points along a seam rather than continuously. It works, but it is slow, it samples rather than covers, and its precision is bounded by what a hand-held gauge and a human eye can resolve. Vision-based measurement replaces the gauge with a camera or laser sensor and calculates the same dimensions from captured geometry, at a speed and consistency a manual process cannot match.
Which method fits a given production line depends mostly on two things: how fast parts move through the station, and how tightly the joint's quality level constrains the acceptable geometry band. A high-volume automotive body shop welding thousands of joints per shift generally needs a method fast enough to keep pace with takt time without becoming the bottleneck station, which tends to point toward laser triangulation or multi-camera systems that capture a full profile in a single pass. A lower-volume fabricator producing pressure-critical joints under a stringent quality level often prioritizes the precision of structured light 3D profilometry over raw throughput, since the cost of a missed geometric defect on that class of joint is disproportionately higher than the cost of a slightly longer inspection cycle.
| Method | How It Works | Parameters Captured | Typical Application |
|---|---|---|---|
| Manual Fillet Gauge | Hand-held gauge applied at sampled points along the seam | Leg length, throat, basic width | Low-volume shops, spot audits |
| Single Camera Passive Vision | High-speed camera with optical filtering images the weld pool or cooled bead directly | Width, height, in-process | In-process GMAW monitoring |
| Laser Line Triangulation | Laser line projected onto the bead, deformation measured by camera to reconstruct profile | Width, height, profile shape | Post-weld inline stations |
| Structured Light 3D Profilometry | Projected light pattern reconstructs a full 3D surface model of the bead | Width, height, toe angle, leg length, throat | High-precision automotive, aerospace joints |
| Multi-Camera AI Vision | Multiple angles eliminate shadow occlusion, AI model measures against qualified geometry | All five parameters, full seam length | Full-line, every-weld coverage |
The gap between these methods is not just precision — it is coverage. A manual gauge applied at three points along a two-meter seam tells you the weld was in spec at those three points. Structured light and multi-camera AI systems capture the profile continuously along the entire seam length, which is the only way to catch the kind of localized drift, a bead that starts in tolerance and narrows over the last 400 millimeters as the torch angle shifts, that a sampled measurement is structurally unable to detect.
Turn Bead Geometry From a Spot Check Into a Continuous Record
iFactory's vision module measures bead width, height, toe angle, and leg length against your qualified weld procedure specification on every joint, and logs the result against the part.
Geometry Tolerance Is Not One Number — It's a Quality Level
ISO 5817 does not define a single acceptable bead geometry; it defines three quality levels — B, C, and D — each with a progressively tighter tolerance band for the same set of geometric parameters, selected based on how critical the joint is to the structure's safety and service life. A pressure-retaining nozzle weld and a light equipment bracket are both welded to the same base standard, but they are qualified against different rows of the same tolerance table.
| Quality Level | Typical Application | Reinforcement Height Tolerance | Undercut Depth Limit |
|---|---|---|---|
| B — Stringent | Pressure vessels, critical structural, fatigue-loaded joints | Tightest band, closest to flush profile | Lowest permitted depth |
| C — Intermediate | General structural steel, most fabricated equipment | Moderate band | Moderate permitted depth |
| D — Moderate | Non-critical brackets, secondary structural members | Widest band | Highest permitted depth |
Enforcing the correct quality level requires knowing which level applies to which weld on which part, and measuring against that specific tolerance band rather than a single plant-wide default. A vision system configured with the qualified weld procedure specification for each joint class can apply the correct quality-level tolerance automatically as parts move down the line, rather than relying on an inspector to remember which drawing revision calls for level B versus level C on a given seam.
Undercut depth is worth calling out separately because it behaves differently from the other four parameters in this table. Width, reinforcement height, penetration, and leg length are all measurements of material that is present in the weld; undercut is a measurement of base metal that has been removed by excessive welding current eroding the joint edge. Because it's a material-loss defect rather than a shape deviation, undercut tends to correlate with fatigue failure more strongly than any single dimensional parameter on its own, which is why every quality level in ISO 5817 treats its depth limit as a hard threshold rather than a range with a wide tolerance band.
The Cost of a Geometry Defect Depends Entirely on When It's Caught
The further a geometric defect travels from the weld station before it's caught, the more expensive its correction becomes — not because the defect itself changes, but because everything built around it, coating, assembly, downstream machining, has to be undone to reach it. Inline profiling immediately after the weld is the practical middle ground most production lines converge on: it doesn't require rebuilding the welding process controller around real-time feedback, but it catches geometry drift before the part accumulates any downstream value that rework would have to sacrifice.
A Geometry Reading Is Only Useful If It's Traceable
A single geometry measurement tells an inspector whether one weld passed. A logged, timestamped, part-linked measurement tells a quality engineer something more useful: whether a process is drifting, which shift produced it, and which welder or robot station it came from. That distinction is what separates a vision system used as a pass or fail gate from one used as an actual process-control input, and it's the difference that shows up when a customer asks for dimensional evidence on a specific serial number months after the part shipped.
Every measurement iFactory's vision module captures is written against the part identifier, the station, the shift, and the specific weld procedure specification revision that was active at the time, so a quality team can pull the full geometric history of a joint on demand rather than reconstructing it from a paper traveler or a sampled inspection log. When the same station starts producing welds that trend toward the edge of their tolerance band, before any individual weld actually fails, that trend is visible in the logged data days before it would surface as a rejected part on the floor. Catching drift at the trend stage is what turns geometry measurement from a final gate into an early-warning system for the welding process itself, and it's the piece manual gauge inspection has never been able to provide, because a sampled measurement doesn't produce a trend line, it produces a series of disconnected spot checks.
This traceability also changes what a warranty claim or a customer audit looks like. Instead of pulling a physical part off the shelf and re-measuring it by hand weeks or months after production, a quality team can retrieve the original inline measurement record tied to that serial number and show the exact width, height, and toe angle values captured at the moment the weld was made, along with the tolerance band it was checked against. For industries where weld integrity documentation is a contractual or regulatory requirement, that record is often worth more to a customer relationship than the inspection itself.
I've walked plenty of shop floors where the weld inspection log shows a clean pass rate and the actual welds are drifting on reinforcement height across an entire shift because nobody's re-checked the gauge calibration or the torch angle since the last setup change. Visual inspection catches the welds that look wrong. It almost never catches the ones that are shaped wrong but look fine, and those are usually the ones that fail a fatigue test eighteen months later, not the ones that fail final inspection today. The shift I've seen work is treating geometry as a continuous measurement problem instead of a periodic gauge check — once you're measuring every weld instead of every tenth one, the drift shows up as a trend line days before it would ever show up as a rejected part.
Frequently Asked Questions
See Bead Geometry Measurement on Your Own Weld Type
iFactory's AI vision module measures width, height, toe angle, and leg length against your qualified weld procedure specification, on every weld, and logs the result against the part for full traceability.