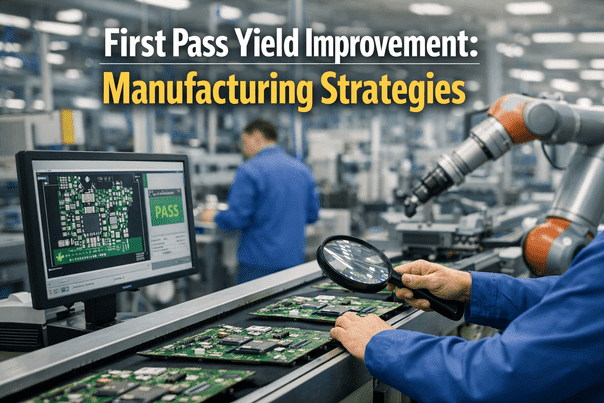
A plant manager rarely gets surprised by a bad first-time-right number, they get worn down by it slowly, one rework ticket at a time. FTR looks like a single clean percentage on a monthly dashboard, but underneath it sits every misaligned fixture, every operator working from memory instead of a current spec, and every process drift nobody caught until the part failed inspection. Pushing FTR above 95% consistently is less about a single fix and more about five specific AI-driven strategies working together across the line. Here is what plants running above that mark are actually doing differently, and where a quick look at your own line data would land on the same benchmark.
Find Out What Is Actually Capping Your FTR
iFactory's AI model breaks FTR down by stage, shift, and product mix, showing exactly where rework is concentrated instead of one blended monthly number.
What a Slipping FTR Rate Actually Costs a Plant
A 95% FTR score sounds strong until a plant manager multiplies the remaining 5% by monthly volume. Every one of those units still consumed labor, material, and machine time before being caught, and the true cost extends well past the part itself.
Five AI Strategies Behind a 95%+ FTR Rate
These five strategies show up in roughly this order across the plants that have pushed FTR consistently above 95%, each addressing a different point where errors get introduced.
Where Does Your Plant Sit on the FTR Curve
FTR performance across manufacturers tends to fall into three fairly distinct tiers, and the gap between them almost always comes down to how much of the process runs on AI-assisted monitoring versus manual judgment.
See Which Tier Your Line Actually Falls Into
Most plant managers are surprised by which stage is dragging their FTR down once it is broken out. A short call can show you the same view for your line.
A Typical FTR Turnaround, Stage by Stage
This pattern repeats across plants that move from a mid-80s FTR score into the mid-90s: the fix rarely comes from one dramatic change, it comes from stacking small corrections at the specific stage where they are needed.
Getting to a Higher FTR Without Stopping the Line
The plants that succeed do not try to fix every stage simultaneously. They target the single lowest-scoring stage first, prove the model there, then expand.
Frequently Asked Questions
How is FTR different from overall yield or scrap rate?
Yield and scrap measure whether a unit was ultimately usable, while FTR specifically measures whether it was made correctly on the first attempt without any rework, correction, or repeated step along the way. A unit can technically pass final inspection and still count against FTR if an operator had to redo a step, request help, or deviate from the standard process to get there. That distinction matters because a plant can have decent yield numbers while still losing significant labor and machine time to hidden rework that never shows up in the scrap report.
Which of the five strategies should we start with?
Start with a stage-level FTR breakdown before adding any monitoring technology, since that is what tells you where the other four strategies will actually pay off. Plants that jump straight to vision-guided assistance or predictive equipment health without first identifying the bottleneck stage often end up investing in the wrong part of the line. The support team can help run that stage-level breakdown against your existing inspection data.
Do we need new sensors and hardware to get started?
Most plants already have enough instrumentation on critical stations, torque guns, temperature probes, and existing vision cameras, to produce a meaningful first pass. Additional sensors can be added incrementally at whichever stage the FTR breakdown identifies as the priority, rather than instrumenting the entire line before seeing any results. This keeps the first phase focused and avoids a large upfront hardware investment before the approach is validated.
How long does it take to see FTR improve at the target stage?
Once live monitoring is connected at the priority stage, most plants see a measurable FTR improvement within four to eight weeks, since the model does not need a long baseline period to start flagging obvious parameter drift or missed steps. Larger gains that come from closed-loop correction, where the fix automatically updates work instructions, typically compound over the following quarter as the model refines what a genuine deviation looks like.
Can this approach work across a mixed product line, not just one product?
Yes, the stage-level breakdown and parameter monitoring both work per product variant, so a mixed line does not need to be treated as one blended process. In fact, mixed lines often benefit the most, since a variant-specific FTR breakdown frequently reveals that one product family is dragging the average down while others are already performing well. A short call can walk through how that breakdown would look for your specific product mix.
Push FTR Above 95% Without Guessing Which Stage to Fix
iFactory's AI model breaks your FTR down by stage and shift, built for plant managers who need to know exactly where rework is concentrated, not just the monthly average.