Throughput is the one number that connects nearly every other metric on a plant floor back to what actually gets paid at the end of the month. OEE can improve on paper without moving a single extra unit out the door, and utilization can climb while output stays flat. Throughput improvement means more good units leaving the plant in the same window of time, and the fastest, cheapest way to get there in 2026 isn't another shift or another machine — it's finding and removing the invisible friction AI can see that a walk-the-floor review usually misses. This guide breaks down five AI-driven strategies operations leads are using to lift throughput 5–15% without adding capex, how to tell a real gain from a lucky week, and shows how a demo can map these strategies to your specific line.
Throughput Playbook
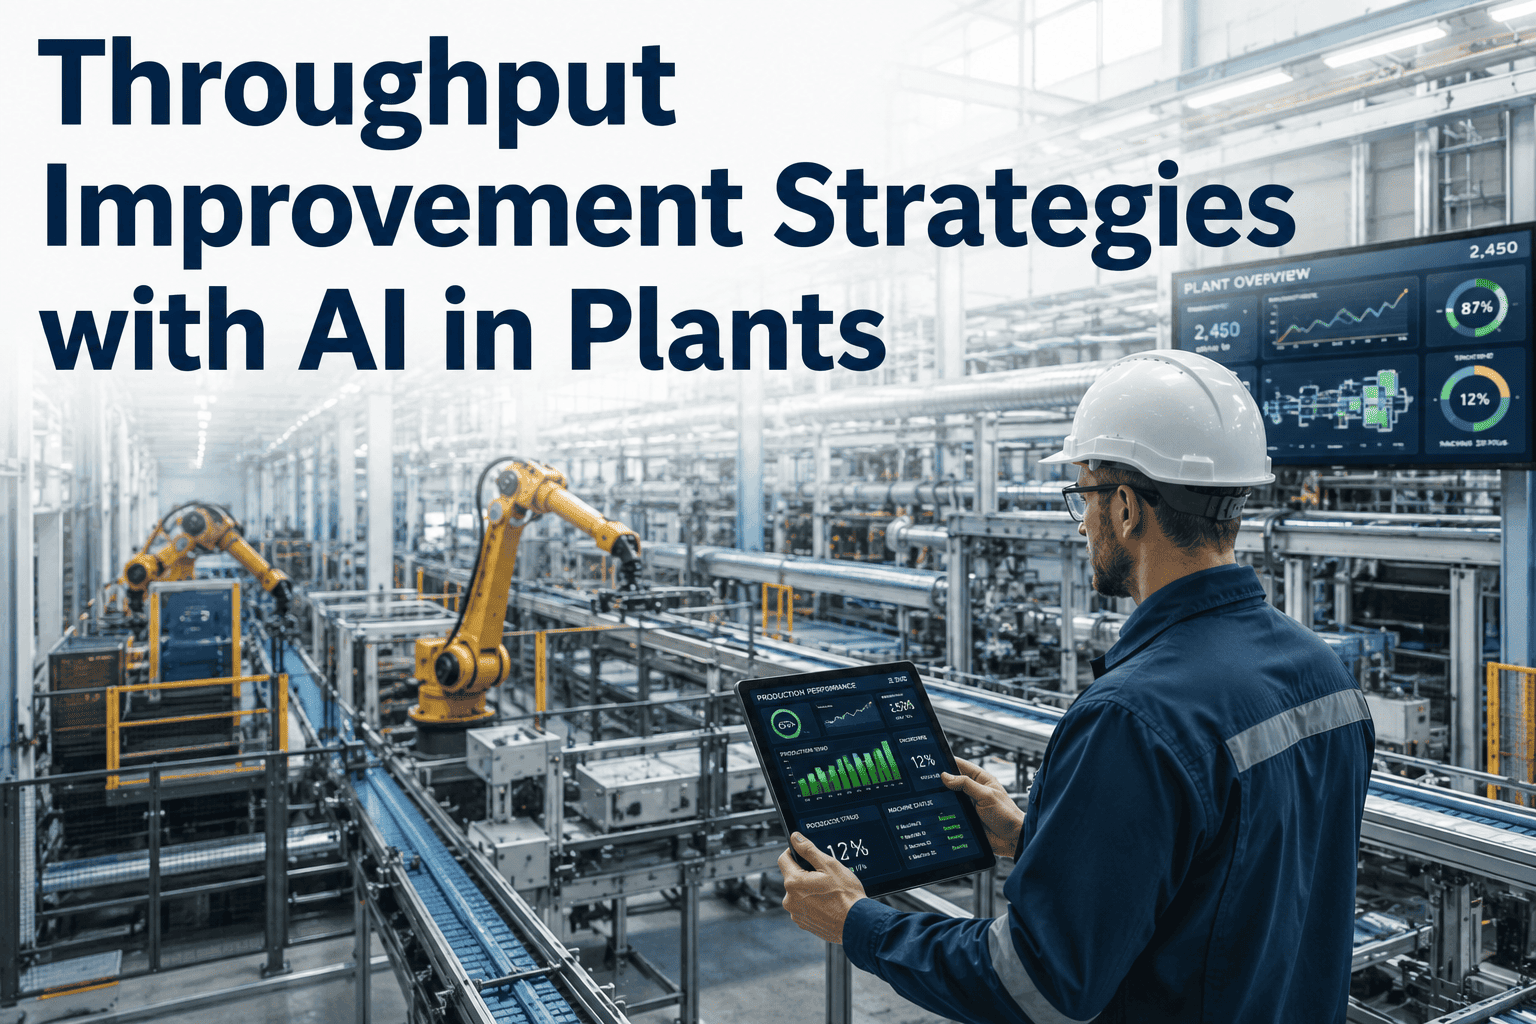
Throughput Improvement Strategies with AI in Plants
Throughput is what gets you paid. Here are five AI strategies operations leads use to lift throughput 5–15% without adding capex or shifts.
Why Throughput Is the Metric That Actually Matters
It's possible to run a plant with respectable utilization numbers, a reasonable OEE score, and still be leaving real output on the table every single shift. That happens because utilization measures whether equipment is running, and OEE blends three factors together into one score that can mask exactly where the real constraint sits. Throughput, by contrast, is a direct measure of good units produced per unit of time, and it's the number that maps most closely to revenue capacity. An operations lead who focuses on throughput first is generally asking a more useful, more actionable question than one focused on OEE alone: not "is the equipment busy," but "how many more sellable units could this line physically produce this week without adding a single resource."
The reason AI has become central to closing that gap isn't that the underlying physics of manufacturing changed — bottlenecks, micro-stops, and changeover time have always existed. What changed is the ability to see them. A human walking the floor once a shift catches the obvious stoppages; they don't catch the twelve-second micro-stops that happen forty times a day, or the fact that a particular changeover sequence is quietly costing more than any other single event on the line, simply because nobody is watching that closely for that long, on every shift, every day of the month. AI models trained on high-frequency machine data catch exactly that pattern, which is why the strategies below consistently outperform traditional continuous improvement approaches on speed to result.
Find the Real Constraint, Not the Obvious One
Most plants improve the station operators believe is the bottleneck, which is frequently the loudest or most visible one rather than the true constraint. AI-driven bottleneck analysis continuously tracks where work-in-process actually accumulates across the full line, updating the answer as product mix and staffing shift — because the true constraint moves throughout the week and a fixed answer from six months ago is often wrong by the time anyone acts on it.
Eliminate Micro-Stops Before They Add Up
A stop under two minutes rarely triggers a maintenance ticket or a formal review, but forty of them across a shift can cost more capacity than one hour-long breakdown. AI pattern detection flags recurring micro-stop clusters tied to a specific fault code, operator handoff, or material feed issue, surfacing a fixable root cause instead of a shrug and a restart.
Sequence Products to Minimize Changeover Drag
Changeover time is capacity that never becomes output. AI sequencing engines reorder the production plan to minimize total transition cost across a shift, recovering hours of run time that were previously lost to a suboptimal order built from habit rather than a calculated changeover matrix.
Predict and Prevent Unplanned Downtime
A breakdown during a scheduled run doesn't just cost the repair time — it costs every unit that would have been produced in that window. Predictive maintenance models flag degrading equipment days or weeks ahead, allowing repairs to be scheduled into planned downtime instead of stealing from planned production.
Balance the Line Dynamically, Not Once a Quarter
Line balancing done once during initial setup drifts out of tune as product mix, staffing, and equipment condition change. AI-driven dynamic balancing continuously reallocates work and flags stations running meaningfully ahead of or behind takt time, keeping the line closer to its theoretical capacity every shift instead of only after a formal re-balance study.
Where the Five Strategies Rank on Impact vs. Effort
Not every strategy delivers results on the same timeline. Some produce a visible throughput lift within a single sprint, while others take longer to implement but compound over time as more historical data accumulates for the model to learn from.
| Strategy | Typical Time to First Result | Typical Throughput Impact |
| Real constraint identification |
1–2 weeks |
2–5% |
| Micro-stop elimination |
2–4 weeks |
3–6% |
| Sequencing optimization |
2–4 weeks |
2–4% |
| Predictive maintenance |
4–12 weeks |
1–3% |
| Dynamic line balancing |
4–8 weeks |
2–5% |
5–15%
typical combined throughput lift from stacking these strategies over two to three quarters
Zero
additional capex or shift hours required for most of the gain
Weeks
not quarters, to see the first measurable result from micro-stop and sequencing fixes
See Your Own Bottleneck
Find Out Where Your Real Constraint Is Hiding
Bring a week of production data to the call and see where AI identifies hidden throughput loss on your line.
Where Throughput Quietly Leaks Out of a Plant
Before layering on new strategies, it's worth naming exactly where the leaks tend to hide, because most plants are losing capacity in more than one of these places simultaneously without a single dashboard that shows the full picture. Individually, each leak looks small enough to shrug off — a few seconds here, a slightly slow cycle there — but stacked across a full shift and multiplied by every day of the month, they routinely account for a double-digit percentage of a line's theoretical capacity, which is exactly the range most plants are trying to recover through far more expensive means like adding a shift or purchasing new equipment.
1
Untracked Micro-Stops
Dozens of short stops per shift that never individually trigger a review but collectively cost more than the plant's largest breakdown.
2
Starved and Blocked States
A downstream bottleneck causing upstream stations to sit idle, counted as "running" time even though nothing productive is happening.
3
Speed Loss Below Design Rate
Equipment running slower than its rated speed for reasons nobody has formally diagnosed, quietly eating capacity every single cycle.
4
Changeover Time Treated as Fixed
A flat changeover estimate used for scheduling instead of the actual, SKU-pair-specific duration, which understates true lost capacity.
5
Reactive Maintenance Windows
Unplanned breakdowns that steal from scheduled production time instead of being caught and scheduled during planned downtime.
6
Static Line Balance
A balance study done once at line startup that no longer reflects current product mix, staffing levels, or equipment condition.
How to Know the Gain Is Real, Not Just a Good Week
One of the most common ways throughput initiatives lose credibility is a false positive: a good week that gets attributed to a new initiative when it was actually driven by a favorable product mix, a fully staffed shift, or simply normal variation. Operations leads who've been burned by this before are right to be skeptical of a single week's data, and the fix isn't to wait longer before declaring success — it's to measure the right way from the start.
1
Baseline Before You Change Anything
Capture at least four to six weeks of throughput data under normal operating conditions before implementing any strategy, so the comparison has a stable reference point.
2
Normalize for Mix and Staffing
Compare throughput per unit of standard time rather than raw units, so a week with an easier product mix doesn't get miscredited to the initiative.
3
Track the Leading Indicator, Not Just the Lagging One
Micro-stop frequency and changeover duration move before total throughput does, giving an early read on whether a fix is actually taking hold.
4
Hold the Gain for a Full Cycle
Confirm the improvement holds across a full product mix cycle, not just during the specific week the change was piloted, before reporting it as sustained.
This discipline matters just as much after the initial win as before it. Throughput gains tend to erode quietly over time if nothing is actively monitoring for drift — a micro-stop pattern that was eliminated can re-emerge after a maintenance change, and a sequencing model tuned for one product mix can gradually lose accuracy as the mix shifts. The plants that hold onto their gains longest are the ones that keep the underlying AI models running continuously rather than treating the initial fix as a one-time project with a defined end date.
Building the Business Case for Operations Leadership
Throughput improvement projects compete for budget and attention against capital requests that promise a more visible, easier-to-model return, which means an operations lead pitching an AI-driven throughput program needs a business case that translates percentage gains into something a finance team can act on. The clearest version of that case starts with current throughput expressed in units per hour or per shift, multiplied by the margin per unit, to establish what even a 5% improvement is worth in dollar terms over a year — a number that is often larger than the cost of a mid-sized capital project, without the capital outlay or lead time a new machine would require.
The second part of the case is speed to result. Capital projects like a new production line or an additional shift typically take many months to plan, procure, staff, and fully commission before they ever contribute a single additional unit of output to the plant's actual capacity. The strategies above, particularly micro-stop elimination and sequencing optimization, can show a measurable throughput change within weeks because they work with equipment and staffing the plant already has, extracting capacity that already exists but isn't currently being captured. That combination — a meaningful dollar figure and a fast time to result — is usually what moves a throughput initiative from a nice-to-have improvement project to a funded priority.
It also helps to frame the request in terms finance already understands: capacity recovered this way is functionally equivalent to adding production hours without the corresponding increase in labor, utilities, or overhead that a new shift would require. A 5% throughput gain on an existing line is, in financial terms, close to getting a fraction of an extra shift's output for the cost of a software implementation rather than new headcount, overtime, or additional equipment. Framing the ask that way tends to land better with finance stakeholders than a purely technical explanation of micro-stops and changeover matrices, because it translates directly into the language a capital allocation committee is already used to evaluating, and it sets a clear, measurable benchmark the initiative can be judged against once it's live.
Frequently Asked Questions
How is throughput different from OEE?
OEE blends availability, performance, and quality into a single composite score, which is useful for diagnosing which of those three factors is dragging performance down, but it doesn't directly tell you how many more units the line could physically produce. Throughput is a direct output measure — good units per unit of time — and it's possible for OEE to improve without a proportional throughput gain if the improvement happens on a station that isn't the actual constraint.
Which of the five strategies should we start with?
Constraint identification is usually the right starting point, because implementing any of the other four strategies on a station that isn't the true bottleneck produces little measurable throughput change even if the underlying fix is well executed. Once the real constraint is confirmed, micro-stop elimination and sequencing optimization tend to deliver the fastest visible results on that specific station.
Do we need new sensors or hardware to get started?
In most cases, no. Modern PLCs and MES systems already capture the machine-state and timestamp data these models need; the gap is usually in how that data is aggregated and analyzed rather than in whether it exists at all. Plants with minimal existing instrumentation may need targeted sensor additions at the identified constraint, but that's typically a small, focused investment rather than a plant-wide retrofit.
How quickly should we expect to see a measurable throughput change?
Constraint identification and micro-stop pattern detection typically surface actionable findings within one to two weeks of connecting to production data, with a measurable throughput change visible within a month once corrective actions are implemented. Predictive maintenance and dynamic line balancing take longer to mature, generally four to twelve weeks, because they depend on the model observing enough operating cycles to distinguish normal variation from a genuine degrading trend.
Can these strategies work on an older line without a modern control system?
Yes, though the approach differs slightly. Older equipment without native data connectivity typically needs retrofit sensors or a lightweight edge device to capture machine state, after which the same analysis techniques apply. The strategies themselves are agnostic to equipment age — what matters is getting reliable, timestamped machine-state data flowing, regardless of whether that line was commissioned last year or twenty years ago.
How do we avoid crediting a throughput gain to the wrong cause?
Establish a normalized baseline before making any change, and compare results on a per-standard-hour basis rather than raw unit counts, so a favorable product mix or a fully staffed week doesn't get miscredited to the initiative. It's also worth tracking a leading indicator, like micro-stop frequency or changeover duration, alongside the throughput number itself, since those move first and give an earlier, cleaner signal than waiting for a full shift or week of aggregate output data.
Do throughput gains from these strategies hold up over time, or do they fade?
They hold up best when the underlying models keep running continuously rather than being treated as a one-time project. A micro-stop pattern that gets fixed can re-emerge after an unrelated maintenance change, and a sequencing model tuned to one product mix gradually drifts as that mix shifts. Plants that pair the initial fix with ongoing monitoring tend to retain the majority of their gain a year later, while plants that treat it as a single project often see a portion of the improvement quietly erode.
Stop Leaving Capacity on the Table
See These Five Strategies Applied to Your Own Line
Get a throughput assessment based on your actual production data before you decide where to focus first.