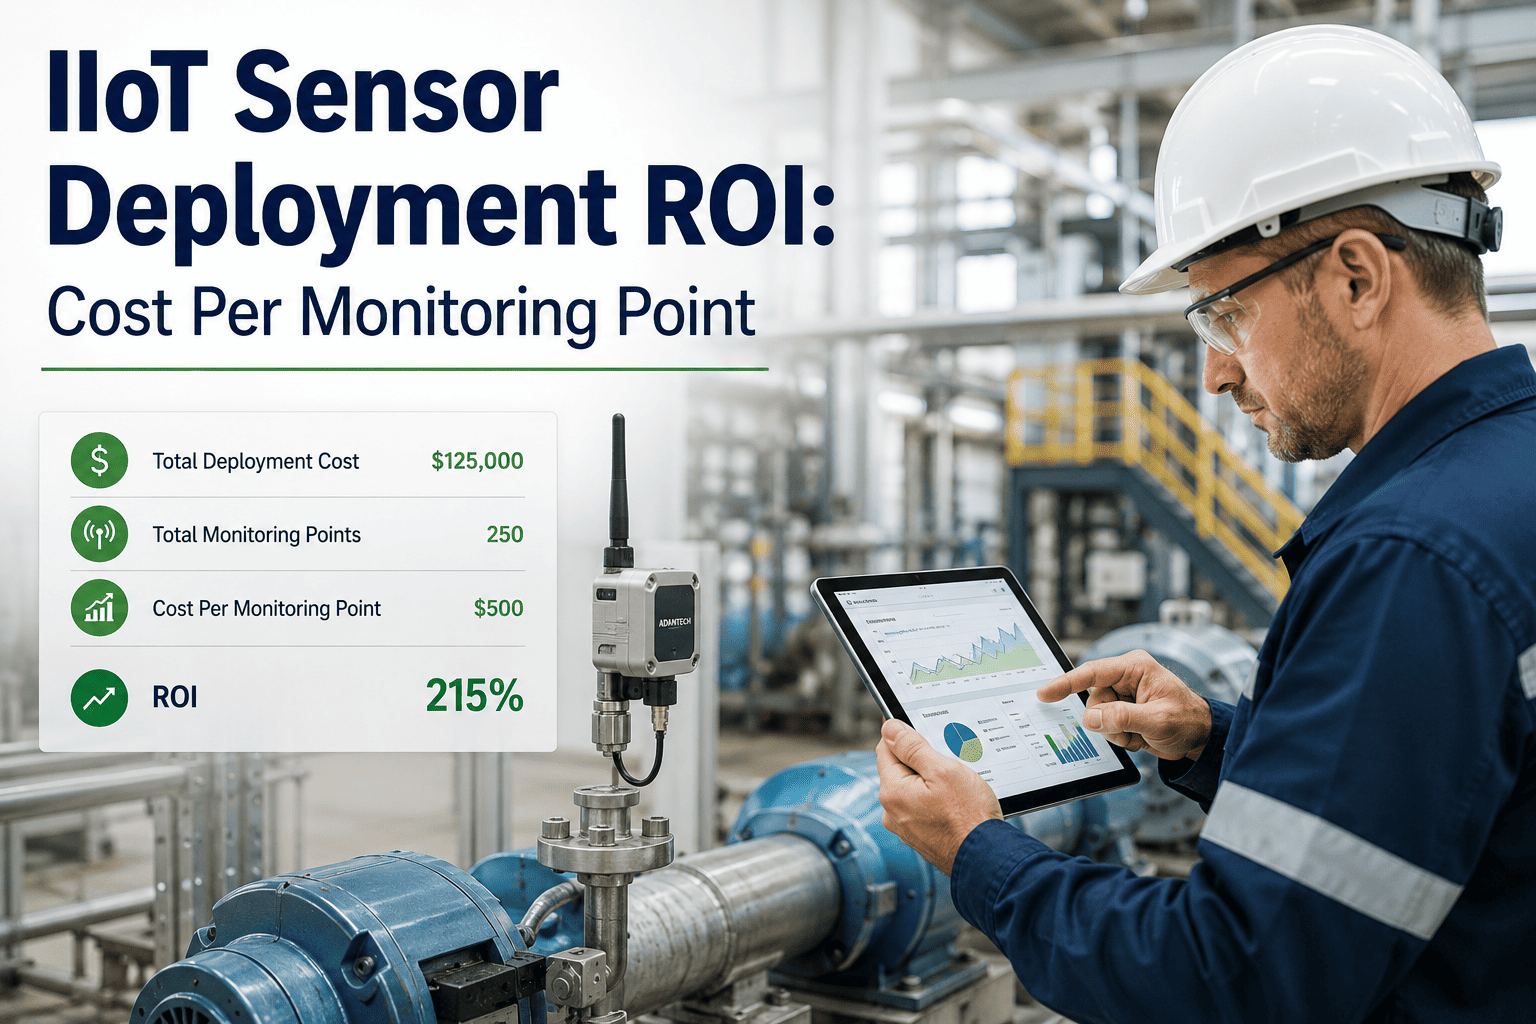
The question a plant manager actually needs answered isn't "how much does an IIoT sensor cost," it's "what does it cost to keep watching this one specific pump, and is that number smaller than what a failure on that pump would cost." Vendors quote hardware prices that look small in isolation, then a project stalls in budget review because nobody built the full picture of connectivity, platform, and integration cost per monitored point. iFactory's IIoT deployment model exists to make that full picture visible before you commit budget, not after.
What does it actually cost to monitor one asset?
Sensor hardware is only one line in the real cost of a monitoring point. Connectivity, the analytics platform, and integration labor determine whether your deployment pays for itself in months or drags on for years.
One sensor cost has four components, not one
A single quoted sensor price hides three other costs that determine whether a monitoring point actually delivers value: the network that gets its data off the asset, the platform that turns raw readings into a trend anyone can act on, and the labor to wire that trend into a work order system. Skipping any one of the four is why so many pilot sensor deployments end up as unused dashboards nobody checks.
Plants that only budget for the hardware line typically discover the other seventy percent mid-project, which is what stalls deployments and sours leadership on the next proposal. Scoping all four components up front is the single biggest predictor of whether a monitoring program survives past its first budget cycle.
Not every asset deserves the same monitoring investment
The mistake most deployments make is spreading a flat budget evenly across every asset in a plant, which means a spare conveyor motor gets the same sensor package as a turbine that would stop the entire line if it failed. A tiered approach matches monitoring intensity to actual criticality, which is both cheaper and more effective than uniform coverage.
| Tier | Asset Criticality | Monitoring Approach | Typical Payback |
|---|---|---|---|
| Tier 1 | Line-stopping, single point of failure | Continuous multi-sensor, real-time alerting | 2-4 months |
| Tier 2 | High-value, redundant or bypassable | Continuous single-sensor, daily trend review | 4-8 months |
| Tier 3 | Moderate value, spare capacity available | Periodic inline reading, weekly trend review | 8-14 months |
| Tier 4 | Low value, easily replaced | Manual inspection, no sensor investment | Not applicable |
Most plants have never actually ranked their assets by monitoring priority, they've just bought sensors for whatever failed most recently. Book a demo and we'll help you build that tiered list from your own maintenance history.
Why the tenth sensor costs less than the first
Pilot Point
Carries the full cost of platform setup, network infrastructure, and integration work by itself. Highest per-point cost in the whole deployment.
Early Scale
Platform and integration cost is now shared across ten points instead of one, and network infrastructure from the pilot already covers this asset.
Plant-Wide
Per-point cost approaches hardware cost alone, since platform, connectivity, and integration are fully amortized across the fleet.
This is the core economic argument for starting with a focused pilot rather than either a single isolated sensor or an unscoped plant-wide rollout: the pilot proves the model while building the shared infrastructure that makes every subsequent point cheaper.
What a well-scoped deployment delivers
Building a business case leadership will actually approve
Sensor deployment proposals stall in budget review far more often because of an incomplete cost picture than because leadership doubts the value of condition monitoring. Building the case around cost per monitoring point, tiered by criticality, with a clear pilot-to-scale cost curve, turns an abstract technology pitch into a specific financial argument that's much easier for a plant controller to approve.
Starting with three to five Tier 1 assets is usually the right size for a first deployment. It's large enough to prove the shared-infrastructure economics that make scaling cheaper, and small enough that the pilot budget doesn't require a capital committee sign-off that could add months to the timeline.
Matching the sensor to the failure mode you're actually chasing
A common and expensive mistake is buying a general-purpose vibration sensor for every asset regardless of what actually fails on that equipment. A pump that has historically failed from seal leaks needs a different monitoring approach than a motor that has historically failed from bearing wear, and matching sensor type to documented failure history is what keeps a deployment from becoming an expensive dashboard nobody trusts.
| Sensor Type | Primary Failure Mode Detected | Best Fit Asset |
|---|---|---|
| Vibration accelerometer | Bearing wear, imbalance, misalignment | Motors, pumps, fans, gearboxes |
| Thermal sensor | Overheating, insulation breakdown, friction | Motors, electrical panels, bearings |
| Ultrasonic sensor | Air and gas leaks, early bearing distress | Compressed air systems, valves, bearings |
| Current and power sensor | Load imbalance, degrading efficiency | Motors, drives, electrical feeds |
Most Tier 1 assets benefit from combining two or three sensor types rather than relying on a single measurement, since different failure modes surface in different signals well before a single sensor type would flag anything unusual. This is also why the platform layer matters as much as the sensor itself, because correlating multiple signals into one confident alert is what separates a useful early warning from a stream of raw data nobody has time to interpret.
A monitoring point that cries wolf gets ignored within a month
The fastest way to kill trust in a new monitoring deployment is setting alert thresholds too conservatively, so that maintenance teams get paged for readings that never actually turn into a real problem. After a few false alarms, alerts start getting dismissed by habit rather than judgment, which defeats the entire purpose of the investment. Thresholds should be calibrated against your own asset's historical baseline rather than a generic industry default, and refined over the first few months as real data accumulates.
The plants that get the most value from their monitoring investment treat the first ninety days as a tuning period, not a finished deployment. Alert thresholds, notification routing, and even which readings get surfaced at all should all be expected to change as the team learns what a genuine early warning looks like on their specific equipment.
Get a real cost-per-point estimate for your plant
iFactory scopes hardware, connectivity, platform, and integration cost together, so you walk into budget review with the full number, not just the sensor line.