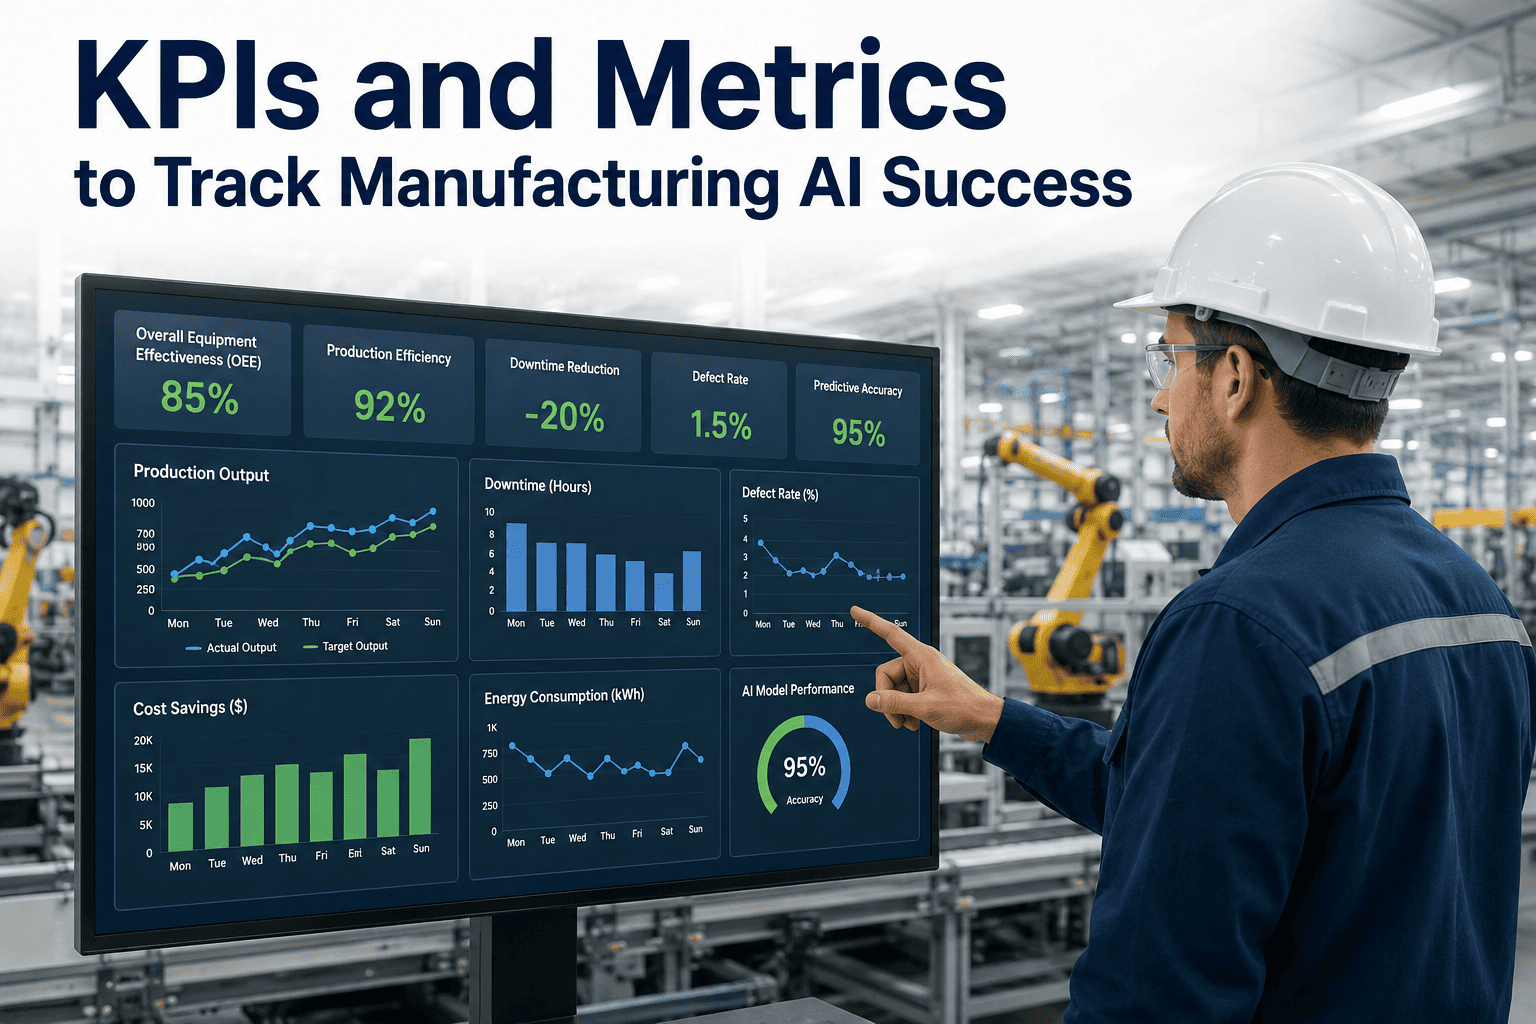
Manufacturing leaders are pouring resources into artificial intelligence, expecting transformative gains in efficiency, quality, and profitability. Yet many organizations lack the structured measurement frameworks needed to validate these investments. Without clear KPIs, AI initiatives risk becoming expensive experiments rather than scalable assets. This guide delivers a comprehensive, multi-dimensional KPI set tailored to manufacturing AI implementations, covering technical performance, operational impact, and financial returns. You will learn which metrics matter most at each stage of deployment, how to track them without drowning in data, and how to align your measurement strategy with business outcomes. Whether you are piloting predictive maintenance or scaling computer vision for quality control, these KPIs will help you prove value and secure executive support. For a deeper dive into aligning AI metrics with your specific production goals, book a demo with our strategy team today.
Prove, Scale, and Optimize Your Manufacturing AI
Track the right KPIs from day one to maximize ROI and operational excellence.
Why Manufacturing AI Demands a New KPI Framework
Traditional manufacturing KPIs like OEE, yield, and throughput remain essential, but they were designed for a world without AI. Smart algorithms introduce new dynamics: model drift, inference latency, and data quality dependencies that directly affect production outcomes. A modern KPI framework must bridge the gap between data science and plant floor operations. It must answer three critical questions: Is the AI model performing as expected? Is the production line benefiting from its insights? And is the business realizing a measurable return on its AI investment? This three-dimensional view ensures that AI initiatives stay aligned with strategic objectives and can be scaled with confidence.
Technical Performance Metrics
- Model Accuracy & Precision
- Inference Latency
- Data Freshness & Completeness
- Model Drift Frequency
These metrics ensure your AI engine is reliable and responsive. Track them daily to catch degradation before it impacts production.
Operational Impact Metrics
- Overall Equipment Effectiveness (OEE) Improvement
- Defect Rate Reduction
- Mean Time Between Failures (MTBF) Increase
- Changeover Time Reduction
These connect AI outputs to tangible floor-level improvements. They are the bridge between model performance and business value.
Financial Return Metrics
- Cost Savings per Unit
- Revenue Uplift from Yield
- AI Project ROI
- Payback Period
These quantify the monetary impact of AI. They are essential for justifying continued investment and securing budget for scale.
Your AI KPI Implementation Roadmap
Define Baseline Metrics
Before deploying AI, capture current OEE, defect rates, downtime, and cost per unit. This baseline is your reference point for all future comparisons.
Deploy Technical Monitoring
Set up dashboards for model accuracy, latency, and data quality. Use automated alerts for drift or data gaps to maintain model health.
Track Operational Impact
Measure changes in OEE, defect rate, and MTBF weekly. Compare against baseline to isolate AI-driven improvements from other initiatives.
Calculate Financial Returns
Aggregate cost savings, revenue gains, and compute ROI. Report quarterly to stakeholders with clear attribution to AI models.
Ready to Build Your AI Measurement Framework?
Stop guessing and start measuring. Our strategy team helps you define, track, and optimize the KPIs that matter most for your manufacturing AI.
Detailed KPI Reference Table
| Dimension | KPI | Measurement Method | Target Frequency |
|---|---|---|---|
| Technical | Model Accuracy | Percentage of correct predictions vs. actuals | Daily |
| Technical | Inference Latency | Time from input to output (ms) | Hourly |
| Operational | OEE Improvement | Current OEE minus baseline OEE | Weekly |
| Operational | Defect Rate Reduction | Percentage decrease in defects | Weekly |
| Financial | Cost Savings per Unit | Reduction in production cost per unit | Monthly |
| Financial | AI Project ROI | (Net benefit / investment) x 100 | Quarterly |
AI Maturity Progress Indicator
Real-World Impact: KPI Success Stories
Automotive Parts Manufacturer
Deployed predictive maintenance AI, tracked MTBF improvement from 120 to 210 hours within 6 months. Technical model accuracy held at 94% throughout. Financial ROI reached 340% in year one.
Electronics Assembly Line
Computer vision for defect detection reduced defect rate by 78%. Inference latency stayed under 50ms, enabling real-time rejection. Cost savings per unit dropped by $0.12, yielding $1.2M annual savings.
Start Measuring What Matters
Your AI success is not an accident. It is a result of disciplined measurement and continuous optimization. Let us help you build the KPI framework that drives real results.
Frequently Asked Questions
How often should I review my manufacturing AI KPIs?
Technical KPIs like model accuracy and latency should be reviewed daily or even hourly via automated dashboards. Operational KPIs such as OEE improvement and defect rate reduction are best reviewed weekly to account for production variability. Financial KPIs like ROI and cost savings should be reviewed monthly or quarterly because they depend on aggregated data over longer periods. Regular reviews help you spot trends early and adjust models or processes before small issues become costly problems. For a tailored review schedule, book a demo with our experts.
What is the most important KPI for an AI pilot project?
For a pilot, the most critical KPI is model accuracy against a validated test set. Without high accuracy, the AI will not deliver reliable insights. However, you should also track inference latency to ensure it meets real-time requirements, and a simple operational KPI like defect rate reduction or downtime reduction to demonstrate early value. Financial ROI is less relevant at the pilot stage because the investment is small and benefits may take time to compound. Focus on proving technical feasibility and operational impact first. Our team can help you define pilot-specific KPIs; book a demo to learn more.
How do I ensure data quality for AI KPIs?
Data quality is foundational to trustworthy AI KPIs. Implement automated data validation checks at the point of ingestion, including completeness, freshness, and consistency rules. Use data profiling tools to detect anomalies and missing values before they enter your models. Establish a data governance team responsible for maintaining data standards and resolving issues. Regularly audit your data pipelines to ensure they are feeding accurate, timely data to your KPI dashboards. For a comprehensive data quality strategy, contact our support team or book a demo for personalized guidance.
Can the same KPIs be used for different types of AI (e.g., predictive maintenance vs. quality inspection)?
While the high-level dimensions (technical, operational, financial) apply to all AI types, the specific KPIs differ. For predictive maintenance, focus on MTBF improvement, downtime reduction, and model accuracy for failure prediction. For quality inspection, prioritize defect rate reduction, false positive/negative rates, and inference latency. Financial KPIs like cost savings per unit and ROI are universal but must be calculated based on the specific operational improvements delivered by each AI application. Tailoring KPIs to the AI use case ensures you measure what truly matters. To develop a customized KPI set, book a demo with our strategy leads.
What are common mistakes when tracking manufacturing AI KPIs?
Common mistakes include tracking too many KPIs without focus, failing to establish a baseline before AI deployment, and not attributing improvements correctly to AI versus other initiatives. Another mistake is ignoring technical KPIs like model drift until the AI starts producing bad recommendations. Many organizations also neglect to communicate KPI results to frontline operators, missing the opportunity to build trust and alignment. Finally, using inconsistent measurement methods over time makes trend analysis unreliable. Avoid these pitfalls by starting with a small set of high-impact KPIs, documenting your baseline, and using automated dashboards for consistency. For a KPI strategy that avoids these errors, book a demo today.