A $12,000 unfavorable material variance and a $12,000 favorable labor variance can sit side by side in the same month-end report and net out to zero on the summary line — while the two numbers are telling completely different stories about what actually happened on the floor. One might mean a supplier raised prices. The other might mean a rushed crew skipped a quality step to hit a deadline, and that shortcut is about to show up as scrap next month. Manufacturing cost accounting only becomes useful the moment it stops reporting a single blended number and starts decomposing every variance into material, labor, and overhead components with a clear investigation trigger attached to each. Book a demo with iFactory's cost analytics team to see variance decomposition connected directly to your production data instead of a month-old spreadsheet.
Cost Accounting · Variance Analysis 2026
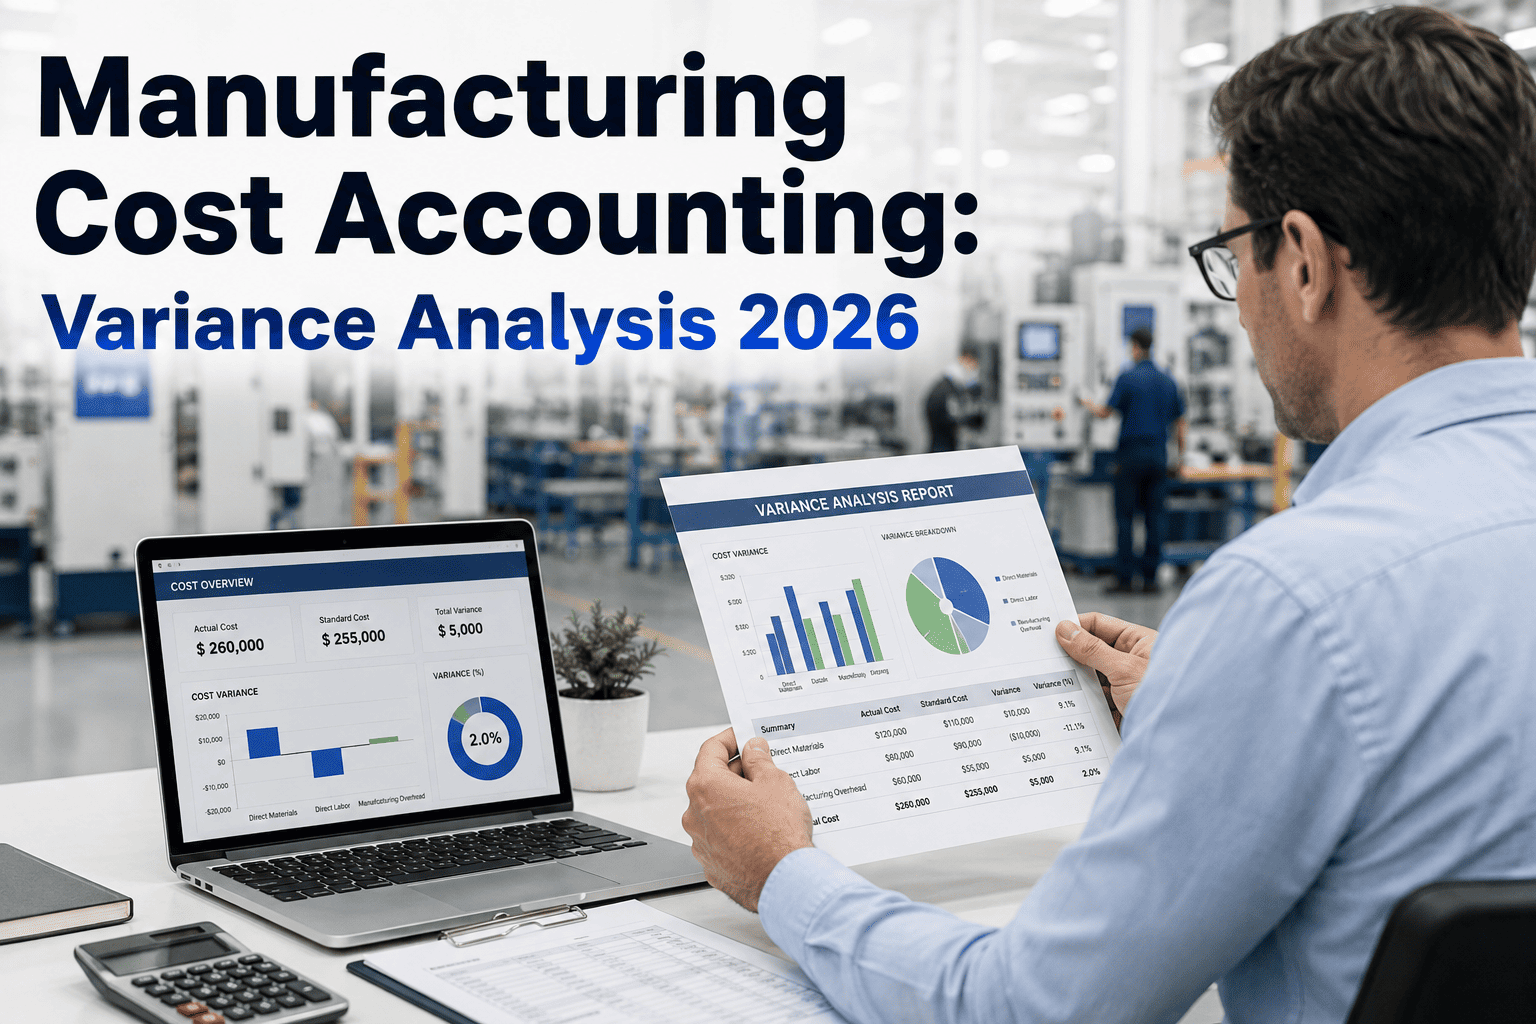
Manufacturing Cost Accounting: Variance Analysis That Actually Points to a Root Cause
Material price and usage, labor rate and efficiency, overhead spending and volume — decomposed into the six components that turn a month-end number into a corrective action, with investigation thresholds that tell your team which variances deserve a meeting and which don't.
The Six Components
Decomposing the Total Variance Into Material, Labor, and Overhead
Material
Price Variance
(Standard Price − Actual Price) × Actual Quantity
Usually a procurement or supplier issue — commodity price shifts, a rush order at premium pricing, or a supplier substitution.
Material
Usage Variance
(Standard Quantity − Actual Quantity) × Standard Price
Usually a process issue — scrap, rework, operator error, or a material substitution that required more volume per unit.
Labor
Rate Variance
(Standard Rate − Actual Rate) × Actual Hours
Usually a staffing mix issue — overtime premiums, a more senior crew than the job required, or a wage increase not yet reflected in standards.
Labor
Efficiency Variance
(Standard Hours − Actual Hours) × Standard Rate
Usually a downtime or training issue — machine stoppages, low-quality incoming material slowing the work, or an inexperienced crew.
Overhead
Spending Variance
Actual Overhead − Budgeted Overhead at Actual Activity
Usually a cost-control issue — utility rate changes, supply cost creep, or unbudgeted indirect labor.
Overhead
Volume Variance
Budgeted Fixed Overhead − Applied Fixed Overhead
Usually a demand or scheduling issue — production volume came in above or below the level the standard assumed for overhead absorption.
Worked Example
Reading a Real Month-End Variance Report
A production run of 1,000 units with a standard cost of $20 in material (4 lbs at $5.00/lb) and $30 in labor (2 hours at $15.00/hour) actually consumed 4,200 lbs at $5.20/lb and 1,820 hours at $16.00/hour. Decomposed, the numbers tell a specific story rather than a single blended overrun.
| Variance | Calculation | Amount | Direction |
|---|
| Material Price | ($5.00 − $5.20) × 4,200 lbs | $840 | Unfavorable |
| Material Usage | (4,000 − 4,200) × $5.00 | $1,000 | Unfavorable |
| Labor Rate | ($15.00 − $16.00) × 1,820 | $1,820 | Unfavorable |
| Labor Efficiency | (2,000 − 1,820) × $15.00 | $2,700 | Favorable |
Read individually, the story is clear: material costs ran over on both price and usage — worth a supplier conversation and a scrap investigation — while the crew, despite an unfavorable rate variance from overtime premiums, actually finished faster than standard, producing a favorable efficiency variance large enough to offset most of the labor overrun. None of that nuance survives if these four numbers get collapsed into a single "labor and material variance: -$960" line on a summary dashboard.
Stop Collapsing Variances Into One Number
iFactory Connects Variance Decomposition Directly to Production Data
Instead of waiting on a month-end spreadsheet reconciliation, iFactory pulls actual material consumption, labor hours, and overhead activity straight from the floor and calculates all six variance components automatically, flagged against the thresholds your team sets.
Investigation Triggers
Which Variances Deserve a Meeting, and Which Don't
Not every variance warrants investigation. A finance team that chases every dollar of deviation burns credibility with operations and drowns the genuinely significant variances in noise. A structured threshold — combining a percentage deviation and an absolute dollar floor — filters routine statistical noise from variances that actually warrant a root cause conversation.
Under 3%
No action — normal process variation
3% – 8%
Monitor — flag if it repeats two periods in a row
8% – 15%
Investigate — assign to the responsible department
Over 15%
Immediate review — standard may be stale or a real problem exists
The dollar floor matters as much as the percentage: a 25% variance on a $40 line item is statistical noise, while a 4% variance on your highest-volume material line can represent tens of thousands of dollars and deserves review regardless of the percentage looking modest.
From Variance to Corrective Action
Routing Each Variance Type to the Right Owner
Material Price Variance
Owner: Procurement
Review supplier contracts, evaluate whether a rush order caused a one-time spike, check whether the standard cost needs updating for a structural commodity price shift.
Material Usage Variance
Owner: Production + Quality
Trace to scrap and rework logs, check for a recent material substitution, verify operator adherence to the specified process.
Labor Rate Variance
Owner: Production Scheduling
Check overtime logs and crew assignment against skill requirements, evaluate whether a more senior team was assigned than the job needed.
Labor Efficiency Variance
Owner: Maintenance + Training
Cross-reference against downtime logs, evaluate operator experience level on the specific job, check incoming material quality.
Overhead Spending Variance
Owner: Plant Finance
Review utility and supply cost trends, check for unbudgeted indirect labor, verify budget assumptions still hold.
Overhead Volume Variance
Owner: Operations Planning
Compare actual production volume against the level assumed in the standard, revisit whether the standard needs rebasing for a sustained demand shift.
The mistake I see most often isn't in the math — the formulas are the same ones every cost accounting textbook teaches. It's in what happens after the number comes out. A controller calculates a $4,000 unfavorable material usage variance, puts it on a slide, and the conversation stops there because nobody in the room owns "material usage" as a job title. The variance has to be routed to a specific person — the shift supervisor whose scrap rate spiked, the buyer who approved a substitute material — or the report becomes a monthly ritual with no behavioral consequence. Standards that never get revisited are just as damaging; I've audited plants running standard costs from three product generations ago, so every report is really measuring "how different is today from a machine we don't run anymore," not real performance.
Renata Oduya-Castellanos
Manufacturing Cost Accounting Consultant · CMA · 18 years advising discrete manufacturers on standard cost systems and variance governance
Controller and Plant Finance Questions
Manufacturing Variance Analysis — Frequently Asked
Why would a favorable variance ever need investigation?
A favorable variance means actual costs came in below standard, which sounds like unambiguous good news, but the underlying cause matters as much as the direction. A favorable material price variance from switching to a cheaper, lower-grade supplier often produces an unfavorable usage variance or quality rejection rate in the following weeks, once the lower-grade material starts failing tolerance checks more often. A favorable labor efficiency variance from rushing a job can create downstream quality holds that cost far more than the labor hours saved. The discipline of investigating favorable variances above the same threshold used for unfavorable ones catches these trade-offs before they compound into a larger problem elsewhere in the cost structure.
How often should standard costs be updated?
Most manufacturers set standards annually as part of the budget cycle, but a fixed annual schedule alone allows standards to go stale between structural changes — a new supplier contract, a significant wage adjustment, or a process change that alters cycle time. A better practice combines the scheduled annual reset with event-triggered updates whenever a structural change occurs, so the standard reflects current reality rather than measuring performance against a baseline that no longer describes how the plant actually runs. Persistent variances in the same direction, month after month, are usually the clearest signal that a standard needs revisiting rather than that operations needs correcting.
What's the difference between overhead spending variance and overhead volume variance?
Spending variance measures whether overhead costs themselves came in as budgeted — did utilities, supplies, and indirect labor cost what was expected at the actual level of activity. Volume variance measures something different: whether the actual production volume matched the level assumed when fixed overhead was applied to each unit. A plant that runs below the volume assumed in its standard will show an unfavorable volume variance even if every individual overhead cost came in exactly on budget, because fixed costs like rent and depreciation get spread across fewer units than planned. Confusing the two leads to a natural but incorrect first reaction — trying to control spending on a variance that is actually a scheduling and demand problem.
Should variance thresholds be the same across all product lines and cost categories?
Uniform thresholds across dissimilar product lines tend to either flood the team with noise from high-variability, low-volume products or miss genuine problems on stable, high-volume lines where even a small percentage deviation represents significant dollars. Thresholds work better when set per cost category and product family, reflecting each one's normal variability and dollar exposure — a tighter percentage threshold on high-volume raw materials, a looser one on low-volume specialty components where natural variation is higher.
Contact our support team for guidance on setting thresholds specific to your product mix.
Can variance analysis be automated instead of built manually each month in a spreadsheet?
Yes, and automation solves the two most common failures of spreadsheet-based variance reporting: the lag between month-end close and when the report actually reaches operations, and the tendency for manually built reports to collapse multiple variance components into a single blended number for the sake of time. Connecting standard costs to actual material consumption, labor hours, and overhead activity as they occur allows variance decomposition to run continuously rather than once a month, and flags threshold breaches to the responsible owner in near real time rather than weeks after the fact.
Book a demo to see automated variance decomposition against your own product cost structure.
Turn Month-End Numbers Into Monthly Action
Get Variance Decomposition That Routes to the Right Owner Automatically
iFactory connects your standard cost structure to real production data and calculates all six variance components continuously, with thresholds and routing rules built around your specific product mix — so variance reports drive corrective action instead of gathering dust in a folder.